

- Traders preparing for a busy week in the currency market should be aware of key releases that could affect investments.
- Australia’s RBA Cash Rate, Europe’s ECB Monetary Policy Statement, and America’s ADP Non-Farm Employment Change report are major releases.
- US Unemployment Claims and JOLTs Job Opening offer insight into labour conditions and job opportunities in the US respectively.
- Federal Funds Rate can shape strategies depending on policy decisions by central banks worldwide.

RBA Interest Hike
The Reserve Bank of Australia has made another move to increase the official cash rate today, bringing it up from 3.6 per cent to an 11-month high of 3.85 per cent – the biggest jump since 2022 when interest rates hit their all-time low!
Gold and Silver Prices Fall
Recent weeks have seen an unexpected and tentative dip in gold and silver prices: a pause from the steady climb that has taken place since late last year. However, this doesn’t appear to be discouraging retail traders who are now leaning more towards upside exposure of these precious metals.
IG Client Sentiment is known for often acting as a contrarian indicator.
So could this bullish attitude indicate further losses ahead for XAU/USD and XAG/USD? Only time will tell!
Gold Client Positioning- Bearish Outlook

Despite a majority of traders still confident that prices for gold will appreciate, the IGCS gauge indicates decreasing optimism. The exposure to downside losses has risen by 3% and 12%, respectively from yesterday and last week – signalling that further short-term drops could be in store.
The XAU-USD Daily Chart

April’s bearish activity saw gold prices tumble, pushing the focus to the 100-day Simple Moving Average which could potentially act as a supportive prop.
If it holds, then attention will return to last year’s all-time highs in 2022.
Silver Bearish Outlook

Silver appears to have hit a wall of downward momentum, with the IGCS gauge showing that an overwhelming majority of retail traders are currently taking up net-long positions.
This bullish bias could be indicative of prices continuing their descent in the near future; however, it’s also worth noting that silver exposure has decreased significantly since yesterday and last week.
While we can never predict what will happen next for sure, all signs point towards more losses yet to come.
XAG-USD Daily Chart

Silver prices have been on the decline since a Bearish Engulfing pattern emerged onto the scene. With only slow progress, market participants are looking to an important support zone at 24.628 as marked by February 2nd’s peak. This has done its job in preventing downward momentum from getting out of hand – so far!
A break below this point, however, could open up silver for further losses down the road.
U.S. Dollar Rally Against The Yen

On Monday, the U.S. dollar gained momentum and picked up steam against its Japanese counterpart due to a surge in yields following positive dates from the monthly ISM manufacturing report; this saw USD/JPY soar more than 0.8% to hit levels not seen since March of this year!
Technical outlook for pair looks promising should it hold above key resistance at 136.60;
If so, bulls could be emboldened enough to attempt breaching 138 – potentially even 140 on the upside – while any setback may lead prices toward 135 or lower as initial support wanes away rapidly with downside price action holding sway over proceedings presently.


S&P 500 Updates
After suffering a setback early last week, the S&P 500 has bounced back by breaching major resistance at 4,200 – a level that had held strong since June 2020. While buyers remain encouraged by this progress, they are yet to prove their strength as bears could still overpower them and drive prices toward support levels near 4125 or even 4060 in the coming days.
On the contrary though if bulls manage to hold on above $4200 then it might set off an uptrend in motion which may eventually lead indexes towards 4310 fueled further with Fibonacci retrenchment from 2022 selloff & August high of 2021.

Crude Oil Prices Stabilize Ahead of Fed & ECB Decisions: What’s Next for WTI?
This week in the petroleum market has been a tale of two stories. While Chinese manufacturing PMI data came up short, US construction spending surprised to the upside amidst news that JP Morgan was taking over First Republic Bank and boosting Treasury yields along with it.
Oil prices have consolidated since mid-last week when oil markets were lifted by OPEC+’s agreement on production cuts but could see volatility pickup later this week as both the Federal Reserve and European Central bank are expected to increase rate hikes by 25 basis points any deviation from expectations will cause ripples throughout crude pricing action.
For bulls looking for an opportunity, breaking decisively above 4200 resistance may signal potential strength pushing past August’s 61% Fibonacci Retracement high at 4310.
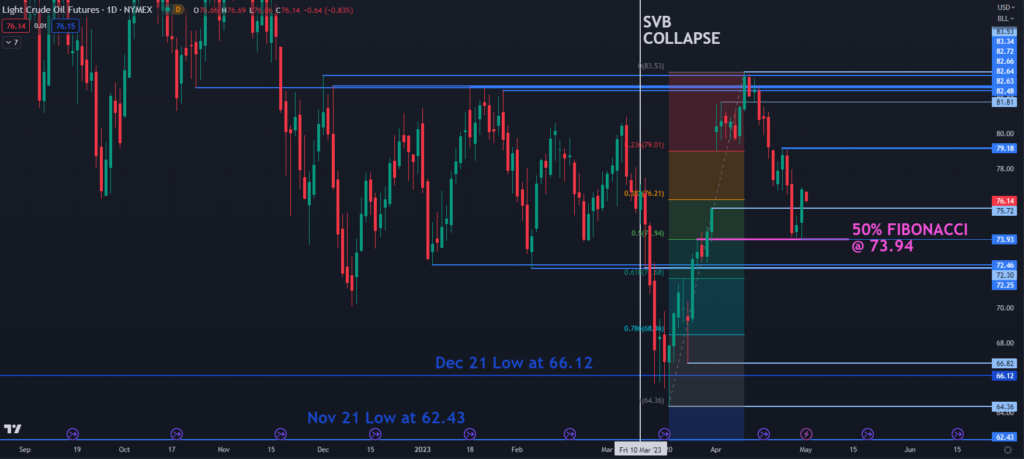
After a recent peak of 79.18, WTI crude appears to be stuck in an uncertain range between support at 73.94 – the 50% Fibonacci Retracement level from 64.36-83.53 and resistance around 82.50– 83.

This Week In Forecast
As the Euro appears to be in limbo, traders look for clues about where it is headed next- will we see a reversal or continuation of current trends? Meanwhile, after an impressive rally against the US dollar, Pound stability remains uncertain.
The Australian Dollar may also find some direction this week as both its own Reserve Bank and Federal Open Market Committee prepare to make announcements. Gold prices remain stagnant within a two month range but are likely on edge with upcoming high impact events such as FOMC rate decisions looming ahead.
Finally, investors take cautious steps forward with big tech earnings giving equity indices slight support before yet another highly anticipated Fed meeting takes place. However technical charts suggest no indication that previous market progressions are at risk of regression just yet!
On May 2nd, 2023 at 10:00 A.M., the latest information on Job Openings and Labor Turnover (JOLTs) will become available to eager observers! Don’t miss out as these figures are sure to shape conversations across many sectors.
Disclaimer:
All information has been prepared by TraderFactor or partners. The information does not contain a record of TraderFactor or partner’s prices or an offer of or solicitation for a transaction in any financial instrument. No representation or warranty is given as to the accuracy or completeness of this information. Any material provided does not have regard to the specific investment objective and financial situation of any person who may read it. Past performance is not a reliable indicator of future performance.