Are you looking for the best way to track trading news and events?
This guide answers the most common search questions about the economic calendar for forex, indices, gold, and crypto.
You’ll find real examples, quick tips, and direct advice, whether you use the Economic Calendar Forex Factory, Economic Events Today, Economic Calendar Today, or Economic Calendar by TradingView.
What Is an Economic Calendar?
An economic calendar is a tool that lists dates and times for important financial events. These could be government reports, central bank meetings, or big economic data releases.
It helps traders spot when markets like EUR/USD, AUD/USD, GBP/USD, NZD/USD, NAS100, SP500, US30, XAU/USD, Gold, and BTC/USD could move.
Why Do Traders Use the Economic Calendar?
- To avoid unexpected price swings in forex pairs and indices
- To plan trades on EUR/USD, AUD/USD, Gold, US30, NAS100, and BTC/USD
- To understand what’s moving markets each day
- Trusted, real-time data for EUR/USD, AUD/USD, GBP/USD, NZD/USD, NAS100, SP500, US30, XAU/USD, Gold, BTC/USD.
Which Economic Events Move Markets the Most?
Event | What It Is | Why It Matters | Example (Real Moves) |
Non-Farm Payrolls (NFP) | US jobs report | Rapidly moves EUR/USD, GBP/USD, NAS100, SP500, Gold, BTC/USD | Surprise NFP: EUR/USD might drop, US30 or Gold might spike |
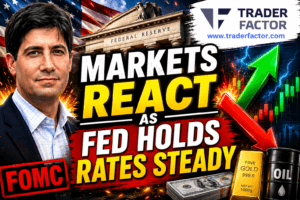
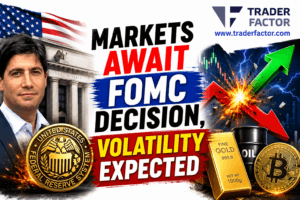
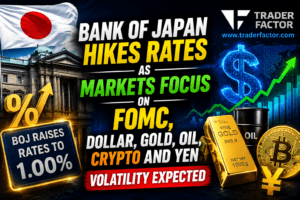
FOMC Meetings & Powell Speeches | US Federal Reserve policy updates; remarks from chair | Critical for USD crosses, indices, gold—sets interest rate and risk tone | Unexpected hawkish tone from Powell can send EUR/USD down, Gold and SP500 diving |
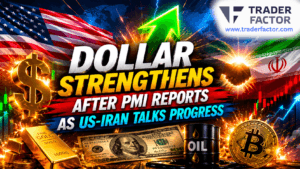
Consumer Price Index (CPI) | US inflation | Shifts rates, hits Gold, SP500, US30, BTC/USD | High CPI: Gold, BTC/USD rise; SP500 falls |
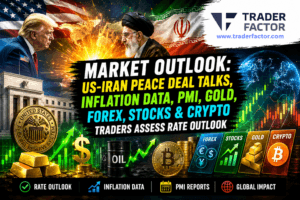
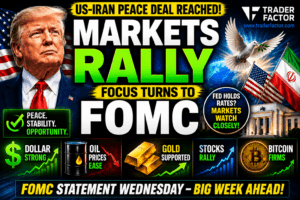
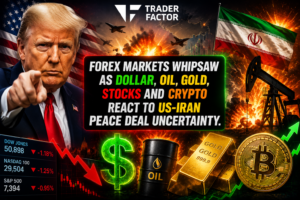
Geopolitical Events (e.g., Trump Speech, Tariffs) | Political statements or tariff changes | Can cause sudden risk-on/risk-off flows in USD, indices, gold, BTC | Trump speech on tariffs triggers big moves in EUR/USD, Gold, and US30 |
Central Bank Rate Decisions | Fed/ECB/BOE rate change | Sets new trends in USD, EUR, GBP, Gold, indices, crypto | Fed hike: USD up, Gold down, indices fall |
Other: GDP, PMI, Retail Sales | Economic growth & demand | Affect forex, indices, commodities, crypto | Strong GDP: SP500, US30 rise; currencies strengthen |
Other data to check: GDP, PMI, Retail Sales―all can affect currency pairs, indices, and crypto.
How Do I Read Economic Calendar Data?
- Compare forecast vs actual
If EUR/USD moves after NFP, it’s often because the result was better or worse than expected. - Don’t just look at the number
A CPI increase affects Gold or BTC/USD only if it surprises traders. - Always use your local time zone
Missing an event can cost a trade in GBP/USD or XAU/USD.
Headline Strategies for Trading the News
Wondering how to act on calendar events?
1. Breakout (“Straddle”) Before News
- Place a buy and sell order around EUR/USD or XAU/USD before big news
- Catch the sharp move, cancel the other order
- Watch for whipsaws in GBP/USD, US30, BTC/USD
2. Fade the Spike
- Wait for the first spike in Gold, NAS100, AUD/USD
- Trade in the opposite direction if price reverses
3. Sit Out Before Major Data Drops
- Don’t trade big setups on EUR/USD or SP500 right before Fed or ECB news
How to Use the TraderFactor Economic Calendar
- Filter for major events only
Find high-impact news for EUR/USD, GBP/USD, Gold, NAS100, US30, and BTC/USD. - Check the full list each morning
Scan Economic Calendar Today before you open trades.
Fast Answers to Top Trading Calendar Questions
What is an economic calendar?
A tool that lists upcoming financial events and data releases that can move markets like EUR/USD, NAS100, or Gold.
Why use an economic calendar for forex trading?
It helps spot when volatility will hit pairs like GBP/USD or AUD/USD so you can plan trades or avoid risk.
How do I read the “impact” rating on event calendars?
Look for High, Medium, or Low labels high-impact events often move pairs like EUR/USD, indices like SP500, or gold prices.
What does “forecast vs. actual” mean?
Compare the expected number to the real result. Big surprises can cause sharp moves in US30 or BTC/USD.
When do most big moves happen?
Right after major news releases like Non-Farm Payrolls or CPI for the US dollar.
Does the economic calendar show all markets?
Yes—major events move forex (EUR/USD, GBP/USD, AUD/USD, NZD/USD), indices (SP500, NAS100, US30), gold (XAU/USD), and crypto (BTC/USD).
What time zone should I use?
Set it to your local time zone so you don’t miss key events hitting SP500 or NAS100.
Are economic calendars like Forex Factory or Econoday reliable?
They provide solid data but always double-check times and verify with your broker.
Which events move gold (XAU/USD) the most?
US inflation (CPI), Fed announcements, and geopolitical news often trigger big gold price swings.
How does news affect BTC/USD?
Macro data (like inflation) and global financial shocks can cause fast moves in crypto.
Do I need to check the calendar every day?
Yes, especially if you day trade forex, gold, indices, or crypto.
Can beginners use an economic calendar?
Absolutely just watch for high-impact events and note how GBP/USD or AUD/USD reacts.
What are “consensus” estimates?
The average forecast by analysts markets often price this in, not the previous number.
Should I hold trades through big news?
Many traders exit before key events on EUR/USD or SP500 to avoid sudden losses.
What’s the best calendar for forex and indices?
Popular options: Economic Calendar Forex Factory, TradingView, Econoday, or your broker’s built-in tool.
Can I set alerts for specific pairs?
Yes, most modern calendars let you set alerts for EUR/USD, NAS100, Gold, and others.
Which events most affect the NAS100 and SP500?
US earnings, inflation data, and central bank announcements.
Are weekends included?
Only if key events or emergency meetings are scheduled. Markets are quieter but some crypto events may occur.
Can I see economic releases for today only?
Use filters like “Economic Calendar Today” for just today’s scheduled events.
How do traders use these events for profit?
By planning entry and exit around volatility buying breakouts or fading spikes on pairs like EUR/USD, Gold, SP500, or BTC/USD.
Takeaway: Why The Economic Calendar Is Your Trusted Source
- We give you real-time, accurate calendar data for all major pairs: EUR/USD, AUD/USD, GBP/USD, NZD/USD, NAS100, SP500, US30, XAU/USD, Gold, and BTC/USD.
- Our team uses proprietary alerts, actual trader experience, and actionable signals.
- Get the answers you need up front.
Start planning every trade smarter with an economic calendar built for today’s forex, index, gold, and crypto traders.