The US CPI Data Report is a crucial piece of information for policy-makers, economists, and investors. This report helps in understanding the consumer price inflation trends in the US market.
Accurate insights derived from this report give us a comprehensive understanding of how the prices of different commodities have been moving within the US economy.
This crucial data presents a glance into the current state of inflation that can be used to inform sound economic decision-making or investment strategies.
The US CPI Data Report is closely monitored by traders and investors as it has a direct impact on the value of the US dollar.
If the report suggests that the inflation rate is higher than expected, it may lead to a decrease in dollar value. This decrease happens because it signals that the central bank may be considering an interest rate hike to curb inflation, which usually attracts foreign investments.
On the other hand, if the report shows a lower inflation rate, it may lead to an increase in the dollar’s value as it suggests that the Federal Reserve may not increase the interest rate in the future, making it a less attractive investment.
Ultimately, the CPI data release can sway market expectations and have a significant impact on the US currency’s immediate and long-term future.
As predicted, the Fed increased interest rates by 25 bps last week but proposed a halt on the upward trend. Presently, markets are anticipating a reduction of 75 basis points in rates by year-end.
However, if the CPI data shows an unexpected increase in price pressures in the last month, it can result in a reevaluation of Fed rate cut expectations. This applies particularly after the stronger-than-anticipated US employment data last Friday.

Dollar Weakens
The value of the US dollar has dropped as anticipation builds for the release of crucial US CPI data, which may drive market exposure in a new direction. Analysts predict an annual read of 5.0% to the end of April.
Meanwhile, concerns over the US debt ceiling and regional banks have left Wall Street with a lower cash session. While all major APAC equity indices are down, Japan’s TOPIX index hovers near three-decade highs.
Yesterday, New York Fed President John Williams restated the Federal Reserve’s stance that FOMC decisions will hinge on data-based assessments going forward.
Today’s market report: little change in treasuries, modest rise in gold, and slight dip in crude oil prices. WTI & Brent futures contracts approaching $73 and $77/bbl, respectively.
In other news China’s crackdown on foreign companies suspected of espionage is escalating, with Canada feeling the heat as well. Economic data to watch: German CPI, Italian industrial production, and most importantly, US CPI.
Stay informed to make savvy investment decisions. Get up to date reports at the Traderfactor Economic Calendar

Analyzing the DXY(USD) Index: Technical Overview

The 21-day simple moving average (SMA) based Bollinger Bands reveal a decrease in US Dollar volatility. As a result, there has been a trend of sideways price movements, which creates an environment favorable for range trading strategies.
An eventual breakout in either direction could lead to strong momentum in that particular direction.
Traders must keep in mind that false breaks have been occurring in the market. This happens when prices rise or fall beyond the existing range trading band but fail to close at those levels.
Potential support levels are 101.03, 101.01, 100.82, and 100.79, while resistance may be met at the previous peaks of 102.40, 102.81, and 103.06.
GOLD MARKET

XAU-USD Chart
Investors keep an eye on gold prices as US inflation data looms. The technical charts are indicating an upward trend, but the risk remains for an increase in price pressures that could impact key support levels.
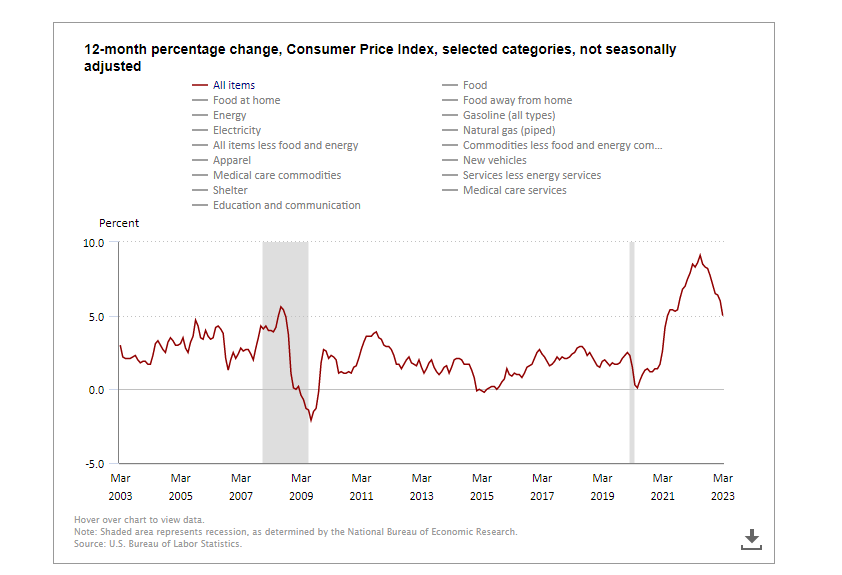
While core inflation measures such as CPI, PCE, and PPI show some moderation, they still exceed the Federal Reserve’s 2% target.
The upcoming CPI index data will provide further insights, with core CPI easing to 5.5% in April from 5.6% in March. Headline CPI is expected to hold steady at 5%.
Australian Dollar

The Australian Dollar remains within a steady range against various currencies, as many central banks plan to pause on rate moves. The AUD/USD pair has been trading within a range of 0.6565–0.6806 for 11 weeks now, with a recent high of 0.6804 on Monday suggesting a possible upward trend.
However, resistance may be offered by the prior peaks in the 0.6784–0.6808 area, which would also surpass the 100- and 260-day Simple Moving Averages. If a break occurs, this could indicate a developing bullish momentum.
Additionally, recent price action has resulted in the convergence of the 10-, 21-, 34-, and 55-day SMAs, just below 67 cents. Should the price fall below 0.6680, there may be a potential for decline towards the lower end of the range, with previous lows in the 0.6550-0.6590 area serving as the next support zone.

Crude Oil Prices

WTI crude oil prices have been on a victorious streak for four consecutive days, matching the longest winning streak since April. If it extends for another 24 hours, it will become the longest winning streak since early March. Following a recent bottom earlier this month, crude oil has increased by about 8%.
The Biden administration has announced its plan to purchase the commodity to replenish the nation’s Strategic Petroleum Reserves, which is currently at a 40-year low.
Investors are closely watching the April US CPI report, which could cool the Federal Reserve rate cut bets. Retail traders have increased their downside exposure to crude oil despite its recent rise.
The IGCS gauge shows that about 76% of retail traders are net-long crude oil, but recent changes in positioning hint that the price trend may reverse higher.
Disclaimer:
All information has been prepared by TraderFactor or partners. The information does not contain a record of TraderFactor or partner’s prices or an offer of or solicitation for a transaction in any financial instrument. No representation or warranty is given as to the accuracy or completeness of this information. Any material provided does not have regard to the specific investment objective and financial situation of any person who may read it. Past performance is not a reliable indicator of future performance.