

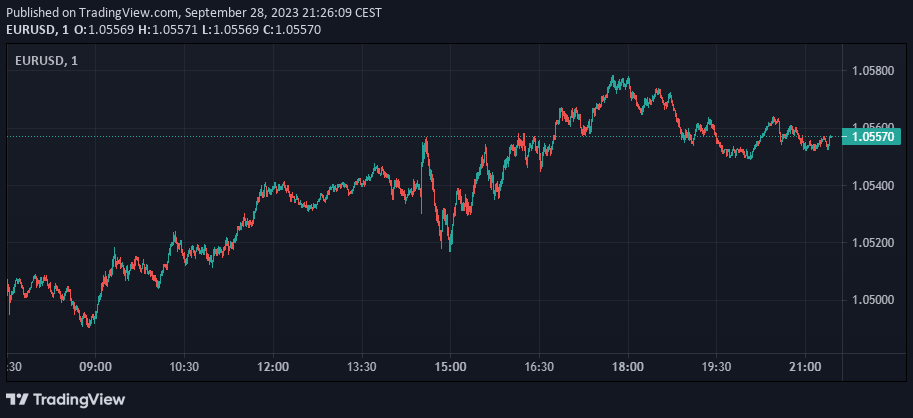
The EUR/USD pair has been making recovery attempts since it hit a low of 1.0487 on Wednesday. The financial markets currently seem to be influenced heavily by sentiment, with a significant amount of concern present. Central banks maintaining a hawkish outlook in September and halting rate hikes have also contributed to this trend.
The global economy has been impacted by rising oil prices throughout the month. Additionally, the German Harmonized Index of Consumer Prices rose by 4.6% YoY in September, indicating inflationary pressures.
In the US, the GDP for Q2 was confirmed at 2.1% QoQ, and initial jobless claims were reported at 204,000, better than the forecasted 215,000. These positive figures have facilitated the EUR/USD’s recovery, allowing it to extend above 1.0550.
Looking ahead, traders will likely keep a close eye on key support levels at 1.0484, 1.0440, and 1.0395, as well as resistance levels at 1.0560, 1.0610, and 1.0660.
EUR USD Daily Chart
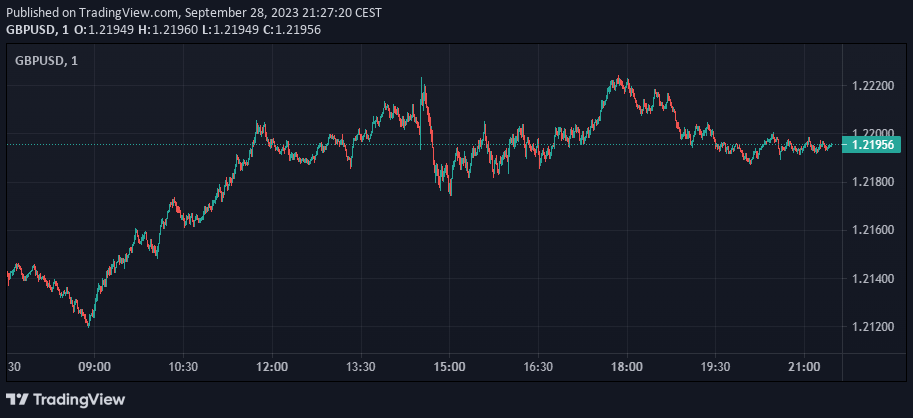
GBP/USD
Meanwhile the GBPUSD extended its recovery by hovering around 1.2200 thanks to a positive shift in sentiment.
Stocks Climb After Positive Data
Major Wall Street indexes experienced a surge on Thursday, September 28, 2023.
The Dow Jones Industrial Average (DJIA), one of the most widely followed equity indices in the world, saw an increase of 71.70 points, or 0.21%, closing at 33,621.97.
The S&P 500, which is regarded as a gauge of the large-cap U.S. equities market, also rose by 21.61 points, or 0.51%, ending the trading day at 4,296.12.
Lastly, the tech-heavy Nasdaq Composite index climbed by 101.03 points, or 0.77%, to close at 13,193.88.
This positive market performance was driven by trader optimism about economic data and stable Treasury yields ahead of the US inflation report.
Unemployment Claims Report: Week Ending September 23, 2023
The U.S Department of Labor has released the latest figures for seasonally adjusted initial claims. In the week ending September 23, the advance figure for these claims was reported to be 204,000. This shows an increase of 2,000 from the previous week’s revised level.
| Data Point | Week Ending September 23, 2023 | Difference from Previous Week’s Revised Level |
|---|---|---|
| Advance Figure for Seasonally Adjusted Initial Claims | 204,000 | +2,000 |
| Previous Week’s Level (Revised) | 202,000 | +1,000 |
| 4-Week Moving Average for Initial Claims | 211,000 | -6,250 |
| Previous Week’s 4-Week Moving Average (Revised) | 217,250 | +250 |
| Advance Seasonally Adjusted Insured Unemployment Rate | 1.1% | No Change |
| Advance Number for Seasonally Adjusted Insured Unemployment | 1,670,000 | +12,000 |
| Previous Week’s Level for Adjusted Insured Unemployment (Revised) | 1,658,000 | -4,000 |
| 4-Week Moving Average for Adjusted Insured Unemployment | 1,673,750 | -12,250 |
| Previous Week’s 4-Week Moving Average for Adjusted Insured Unemployment (Revised) | 1,686,000 | -1,000 |
Interestingly, the previous week’s level was revised upwards by 1,000, shifting the number from 201,000 to 202,000. The 4-week moving average for these claims was 211,000, marking a decrease of 6,250 from the previous week’s revised average. This revised average was also adjusted upwards by 250, from 217,000 to 217,250.
In terms of the advance seasonally adjusted insured unemployment rate, it remained steady at 1.1 percent for the week ending September 16, mirroring the previous week’s unrevised rate.
The advance number for seasonally adjusted insured unemployment during the same week was 1,670,000, showing an increase of 12,000 from the previous week’s revised level. The previous week’s level was revised downwards by 4,000 from 1,662,000 to 1,658,000.
Lastly, the 4-week moving average for these figures stood at 1,673,750, a decrease of 12,250 from the previous week’s revised average. The previous week’s average was also adjusted downwards by 1,000 from 1,687,000 to 1,686,000.
These figures highlight the continuous fluctuations in the employment market, providing crucial insights for policymakers and economists alike. As we move into the final quarter of the year, all eyes will be on how these trends evolve in response to macroeconomic conditions.
U.S. Economy Grows at 2.1% in Second Quarter, Says BEA
The U.S. economy demonstrated a solid growth rate of 2.1% in the second quarter of 2023, according to the third estimate released by the Bureau of Economic Analysis (BEA). This figure matches the previous estimate and indicates that the U.S. economy has been resilient amidst global economic challenges.
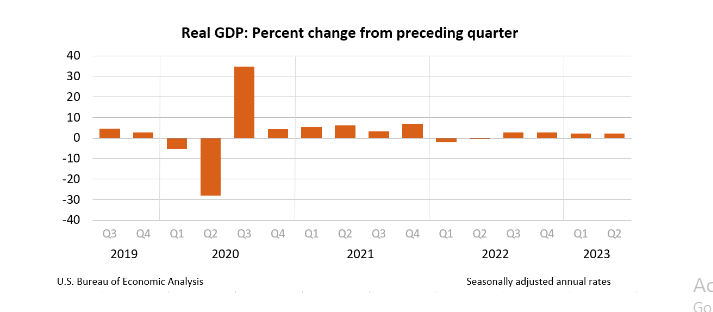
The GDP increase reflects positive contributions from personal consumption expenditures (PCE), nonresidential fixed investment, exports, and federal government spending. These were partly offset by negative contributions from residential fixed investment and private inventory investment.
In addition, the BEA also released revised corporate profits for the second quarter. While the exact figures have not been mentioned in the context provided, it’s important to note that these figures provide valuable insights into the overall financial health of U.S. corporations and can influence future investment, employment, and growth decisions.
The estimates released by the BEA are based on more complete source data than were available for the “second” estimate issued last month. The “third” estimate for the second quarter, based on more complete data, will be released next month.
These recent figures indicate that the U.S. economy is on a stable path, showing resilience in the face of global economic uncertainties. However, economists and investors will be closely monitoring upcoming data releases and global events that could impact future growth.
Read These Next
Creating an Effective Forex Trading Plan
The Winning Mindset for Weekend Forex Trading
Essential Education for Taxes on Forex Trading
What is a Margin Level in Forex?
Forex Breakout Strategy: A Guide for Profitable Trading
Forex Consolidation Breakout Strategies for Traders
Master Forex Flag Pattern Strategy for Profit
Disclaimer:
All information has been prepared by TraderFactor or partners. The information does not contain a record of TraderFactor or partner’s prices or an offer of or solicitation for a transaction in any financial instrument. No representation or warranty is given as to the accuracy or completeness of this information. Any material provided does not have regard to the specific investment objective and financial situation of any person who may read it. Past performance is not a reliable indicator of future performance.