
If you’re a trader looking to maximize your profits while minimizing risks, one way to achieve this is through consolidations or breakouts in the forex market. Consolidation Breakout Strategies are widely used by Forex traders as they can provide beneficial entries and exits into deals with lower losses than normal trades.
Here, we’ll explore what consolidation breakout strategies are and how they can be applied effectively for traders looking to benefit from price movements within these markets. With careful application of consolidated trading ranges, a trader has greater control over their risk exposure when investing in Forex markets.
Overview: Forex Consolidation Breakout Strategies for Traders

When it comes to Forex consolidation breakout strategies, there are various approaches that traders can employ. Here are some key points to focus on:
Understanding Breakouts
A breakout occurs when the price of a currency pair surpasses a certain level of support or resistance, indicating a potential shift in market sentiment and the start of a new trend.
Identifying Consolidation Patterns
Traders should learn to recognize different types of consolidation patterns, such as sideways ranges, triangles, rectangles, pennants, wedges, and diamonds. Each pattern has its own characteristics and may provide different trading opportunities.

Entry and Exit Strategies
Traders need to develop effective entry and exit strategies for breakout trades. This includes setting appropriate stop-loss and take-profit levels, as well as determining the optimal time to enter a trade based on the breakout confirmation.
Risk Management
It’s essential to manage risk properly when trading consolidation breakouts. Traders should calculate their position size based on their risk tolerance and set strict risk-reward ratios to ensure that potential profits outweigh potential losses.
Confirmation Techniques
Traders often use technical analysis tools to confirm breakout signals. These may include indicators like moving averages, trendlines, and chart patterns. By combining these tools with consolidation breakout strategies, traders can increase the probability of successful trades.
Common questions that traders may have about consolidation breakout strategies include:
How do you identify valid breakout signals?
Which currency pairs are best suited for breakout strategies?
What time frames are most effective for trading consolidations?
How do you handle false breakouts?
Are there any specific indicators or tools that can help in identifying consolidations and breakouts?

By exploring these topics and providing insights into the different types of consolidations and breakout strategies, traders can enhance their understanding and make informed trading decisions.
Different Types of Consolidations

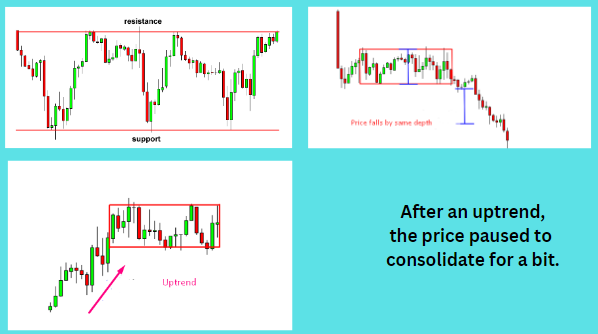
Sideways Consolidations
Sideways consolidations refer to a specific pattern of price movement in the financial markets. It is characterized by a period of consolidation or indecision, where the price fluctuates within a limited range. During sideways consolidations, neither the buyers nor the sellers are in control, resulting in a horizontal trend.
This type of consolidation often occurs after an uptrend or downtrend and serves as a pause or a moment of indecision before the price continues its previous trend or reverses into a new trend. The prices tend to move within a narrow range, with support and resistance levels defining the boundaries of the consolidation.
Traders and investors closely monitor sideways consolidations as they may offer trading opportunities once the price breaks out of the consolidation range. Breakouts from sideways consolidations can indicate a potential shift in market sentiment and the start of a new trend.

It’s important to note that sideways consolidations can occur in various financial markets, including stocks, forex, commodities, and cryptocurrencies. Traders use technical analysis tools, such as support and resistance levels, chart patterns, and indicators, to identify and trade sideways consolidations effectively.
By understanding sideways consolidations and recognizing their characteristics, traders can potentially capitalize on the subsequent breakout moves or adjust their trading strategies accordingly to navigate this period of price consolidation.
Triangle Consolidations
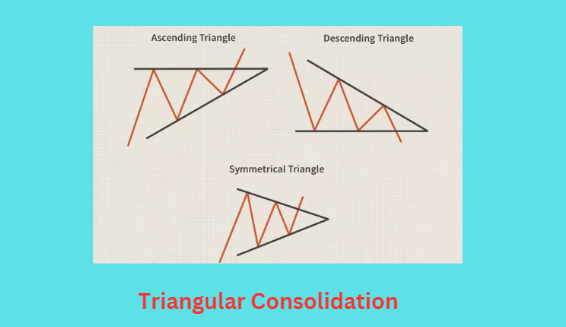
Triangle consolidations are chart patterns in technical analysis that form a triangle-like shape and indicate a pause or consolidation in the prevailing trend. They are continuation patterns that can lead to a resumption of the previous trend.
There are different types of triangle consolidations, including symmetrical triangles and asymmetrical triangle patterns. Symmetrical triangle patterns exhibit low volatility and indicate a period of consolidation, while asymmetrical triangles suggest a potential breakout or reversal.

Traders often use triangle consolidations as a basis for trading strategies. The breakout from a triangle consolidation pattern can be a signal for entering trades in the direction of the breakout.
It’s important to note that triangle patterns can be found in various financial markets, such as trading stocks, commodities, and forex. Traders analyze these patterns using technical analysis tools and concepts like support zone and resistance zone, trend lines, and price breakouts.
Rectangle Consolidations
Rectangle consolidation, also known as a trading range or a sideways channel, is a price pattern that occurs when the price of an asset moves within a relatively narrow range between parallel horizontal support and resistance levels. It is characterized by a series of highs and lows that create a rectangular shape on the price chart.
During a rectangle consolidation, the market is in a state of balance, with neither buyers nor sellers dominating the price action. This period of consolidation often occurs after a significant price move and serves as a pause or accumulation phase before the next major trend.
Traders and investors closely monitor rectangle consolidations as they can provide valuable insights into potential future price movements. Breakouts from the upper( larger positions) or lower boundary of the rectangle can signal the start of a new trend, providing trading opportunities for market participants.

When trading a rectangle pattern, a trader typically wait for a breakout above the resistance level or below the support level. The breakout direction may indicate the subsequent trend, and traders can enter positions accordingly.
It’s important to note that rectangle consolidations can be found in various financial markets, including stocks, commodities, forex, and cryptocurrencies. Traders use technical analysis tools, such as trend lines, support and resistance levels, and volume indicators, to identify and validate the rectangle consolidation pattern.
Pennant Consolidations
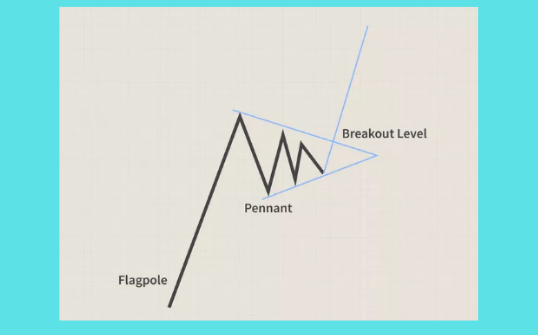
In forex trading, a pennant consolidation is a continuation pattern that occurs after a strong price movement or trend. It is named after its resemblance to a pennant flag, with a triangular shape formed by converging trend lines.
A pennant consolidation typically consists of two trend lines: an upper trend line, drawn along the highs of the price action, and a lower trend line, drawn along the lows. These trend lines converge towards each other, creating a narrowing pattern.
The pennant consolidation pattern represents a temporary pause in the price action, where buyers and sellers take a break before the next move. It signifies a period of indecision in the market, with decreasing volatility and decreasing trading volume.

Traders closely monitor pennant consolidations as they can provide valuable signals for potential future price movements. Breakouts from the pennant formation can indicate the resumption of the previous trend, providing traders with opportunities to enter trades in the direction of the breakout.
When trading a pennant consolidation, traders often wait for a breakout above the upper trend line for a bullish signal or a breakout below the lower trend line for a bearish signal. They may place stop-loss orders just outside the pennant formation to manage risk.
Keep in mind that pennant consolidations are best used in conjunction with other technical analysis tools and indicators to confirm trade signals when analyzing forex or stock. Additionally, traders should consider fundamental factors and news events that may impact the forex market.
Wedge Consolidation
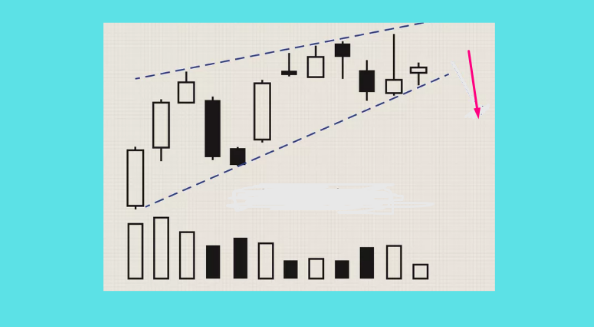
Wedge consolidation is a common chart pattern in forex trading. It is formed when the price of a currency pair moves within converging trendlines, creating a narrowing wedge shape. This pattern indicates a period of consolidation in the market, where buyers and sellers are in a state of equilibrium.
During wedge consolidation periods, the price typically oscillates between the upper and lower trendlines. Traders often look for a breakout from this pattern to signal a potential direction of the next major price movement.
A bullish breakout occurs when the price breaks above the upper trendline of the wedge, indicating a potential upward trend. Conversely, a bearish breakout happens when the price breaks below the lower trendline, suggesting a potential downward trend.

Traders can use various technical indicators and tools to confirm the validity of a wedge consolidation pattern and time their trades accordingly. It is important to consider other factors such as volume, support and resistance levels, and market conditions before making trading decisions based on this pattern.
Remember to conduct thorough analysis and consider risk management strategies before entering any trades. Forex trading involves risks, and it is essential to have a solid understanding of the market and proper risk management techniques.
Diamond consolidation
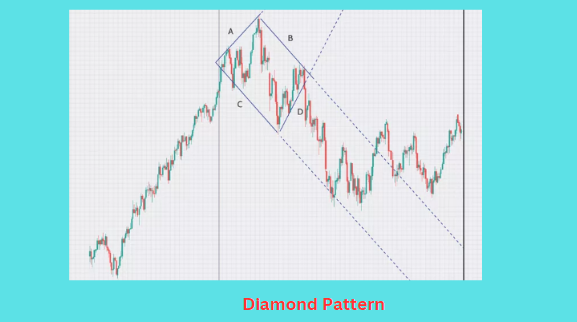
A diamond consolidation pattern, also known as a diamond bottom, is a bullish pattern that typically occurs after a downtrend in forex trading. It is characterized by a significant downward price move followed by a consolidation phase that forms swing points in the shape of a diamond.
The appearance of a diamond bottom pattern can resemble an inverted head and shoulders pattern, where the price forms higher lows and lower highs within the diamond shape. This pattern suggests a potential reversal of the previous downtrend and a bullish market sentiment.
Traders often look for confirmation signals such as a breakout above the upper trendline of the diamond pattern to enter long positions. The target for this pattern is usually projected by measuring the height of the diamond and adding it to the breakout point.
It is important to note that technical analysis patterns like the diamond consolidation should be used in conjunction with other technical indicators and analysis methods to make informed trading decisions.
Causes of Forex Consolidation

Economic News
Economic indicators and news releases such as GDP growth, employment data, inflation rates, and trade balances can have a significant impact on forex markets. Positive or negative economic news can lead to consolidation as traders wait for more clarity and identify consolidation before making new trading decisions.
Central Bank Decisions
The monetary policy decisions taken by central banks, including interest rate changes, quantitative easing programs, and policy statements, can influence forex markets. When central banks signal a more cautious or uncertain approach to their monetary policy, it can lead to a consolidation phase in the forex market.

Political Events
Political instability, geopolitical tensions, elections, and policy changes can all affect forex markets. Uncertainty surrounding political events can cause traders to adopt a wait-and-see approach, leading to consolidation in the forex market.
Market Sentiments
Sentiment and investor psychology play a crucial role in forex markets. During periods of uncertainty or risk aversion, traders may refrain from taking large positions, resulting in a periods consolidations phase.
Technical Factors
Technical analysis, including support and resistance levels, chart patterns, and trend indicators, can also contribute to forex consolidation. When a currency pair reaches a key technical level or enters a sideways trading range, it can lead to consolidation as traders wait for a breakout or breakdown.

It’s important to note that these factors are not exhaustive, and forex consolidation can be influenced by a combination of various factors. Additionally, market conditions and individual currency pairs can also impact the extent and duration of tight consolidation.
Breakout Strategies

Momentum Breakout
This strategy involves taking trades when there is a strong momentum move in the market. Traders look for price breakouts above resistance levels or below support levels, indicating a potential continuation of the current trend.
Trendline Breakout
This strategy focuses on trading breakouts that occur when price breaks above or below a trendline. Traders draw trendlines based on the highs or lows of price movements and enter trades when price breaks through the trendline, signaling a potential trend reversal, consolidation draws or continuation.
Price Action Breakout
This strategy relies on analyzing price patterns and candlestick formations to identify breakout opportunities. Traders look for specific price patterns such as triangles, rectangles, or flags, and enter trades when price breaks out of these patterns, indicating a potential shift in market sentiment.

News Breakout
This strategy involves trading breakouts that occur following major news releases or economic events. Traders monitor economic calendars, markets spend and look for significant news releases that could potentially cause increased volatility and price breakouts. They enter trades based on the direction of the breakout and the impact of the news on the market. Also, watch out when a company’s shares report are released and the stock market is bullish.
False Breakout
This strategy focuses on trading breakouts that initially appear to be genuine but then fail to sustain the momentum. Traders look for situations where price breaks above or below key levels but quickly reverses back within the range. They take advantage of these false breakouts by entering trades in the opposite direction and aiming to profit from the subsequent reversal.

These breakout strategies can be used by traders to capture potential profitable trading opportunities in the financial markets. It’s important to note that each strategy has its own set of rules, risk management techniques, and entry/exit criteria. long-term and short-term traders often combine multiple strategies or use additional technical indicators to confirm breakouts and increase the probability of successful trades.
Technical Analysis Tools

Moving Averages
Moving averages are used to smooth out price data and identify trends. They calculate the average price level over a specified number of periods and are commonly used to determine support and resistance levels and generate buy or sell signals.
Bollinger Bands
Bollinger bands consist of a middle band (usually a simple moving average) and two outer bands that are based on standard deviations. They provide a visual representation of price volatility and can be used to identify potential price reversals or breakouts and other asset.
Relative Strength Index (RSI)
The RSI is a momentum oscillator that measures the strength and speed of price movements. It ranges from 0 to 100 and is used to identify overbought and oversold conditions in the market, as well as potential trend reversals.

Fibonacci Retracement
Fibonacci retracement is a technical analysis tool that uses horizontal lines to indicate areas of support or resistance at the key Fibonacci levels before the price continues in the original direction. These levels are determined by the Fibonacci sequence and ratios.
Ichimoku Cloud
The Ichimoku Cloud is a comprehensive technical analysis tool that provides information about support and resistance levels, trend direction, and momentum. It consists of several components, including a cloud (Kumo), a conversion line (Tenkan-sen), a base line (Kijun-sen), a lagging span (Chikou Span), and a leading span (Senkou Span).
Candlestick Charts
Candlestick charts are a popular charting technique used in technical analysis. They display price data for a specific time period in a visual format that resembles candlesticks. Candlestick patterns are used to identify potential reversals, continuation patterns, and other market signals.

These technical analysis tools can be used by traders and investors to analyze price movements, identify trends, and make informed trading decisions. It’s important to note that no single tool or indicator guarantees accurate predictions, and it’s often beneficial to use multiple tools in combination to confirm signals and increase the probability of successful trades.
While technical analysis is a valuable tool, it’s important to remember that it’s not foolproof. That’s why we always recommend supplementing it with other forms of analysis and risk management techniques.
Advice on How to Trade Forex Consolidation

There are different ways to trade a consolidation zone in forex. Some traders advise carefully considering whether trading is appropriate for you based on your personal circumstances, as forex trading involves risks.
Trading consolidations occur when the price moves sideways in a lack of trend. It signifies indecision among market participants and often precedes a breakout or breakdown.
To trade consolidation in forex, it is important to first identify the support and resistance levels. These levels can be identified by analyzing the price action. Traders can then look for breakouts or breakdowns from these levels to enter trades.
A common rule of thumb in trading consolidation patterns is to aim for at least a 2:1 risk-reward ratio, where the potential profit is twice as large as the possible loss. Various technical indicators and tools can be used in conjunction with consolidation patterns to enhance trading decisions.
In forex trading, consolidation refers to an asset oscillating between well-defined levels of support and resistance. It is often seen as market indecisiveness and usually ends when the price breaks above or below the trading pattern.
Takeaway

Unlocking the Secrets to Successful Forex Trading During Consolidation requires specific strategies and techniques. Here are some key points to consider:
Wait for the Moment of Breakout
Timing is crucial when trading forex during consolidation. It’s important to wait for a clear breakout before entering a trade. This occurs when the price breaks above or below the consolidation range, indicating a potential trend continuation or reversal. Patience is key in waiting for the right moment to make your move.
Harness the Power of Technical Indicators
Utilizing technical indicators can provide valuable insights and help you make informed trading decisions. Indicators such as moving averages, Bollinger bands, and relative strength index (RSI) can assist in identifying potential entry and exit points during consolidation periods.

Keep a Close Eye on Key Levels
Monitoring support and resistance levels is vital during consolidation. These levels act as boundaries for price movement and can provide profitable trading opportunities. Pay attention to how the price reacts near these levels and look for breakouts or bounces to enter trades.
Cultivate the Virtue of Patience
Consolidation periods can test traders’ patience as the market lacks clear direction. Avoid jumping into trades out of boredom or frustration. Wait for strong signals and confirmation before taking action. Being patient can lead to more significant wins.
Safeguard Your Investments with Risk Management
Risk management is crucial in any trading strategy, including during consolidation. Set appropriate stop-loss orders to limit potential losses and protect your capital. Proper risk management helps maintain consistency and optimize trading performance.
Conclusion
Trading consolidations in the forex market can be challenging because of the risk of false breakouts. One important concept to consider is to avoid getting caught in false breakouts, which can lead to losses. It’s recommended to use strategies that help identify high probability breakouts.
Disclaimer:
All information has been prepared by TraderFactor or partners. The information does not contain a record of TraderFactor or partner’s prices or an offer of or solicitation for a transaction in any financial instrument. No representation or warranty is given as to the accuracy or completeness of this information. Any material provided does not have regard to the specific investment objective and financial situation of any person who may read it. Past performance is not a reliable indicator of future performance.