

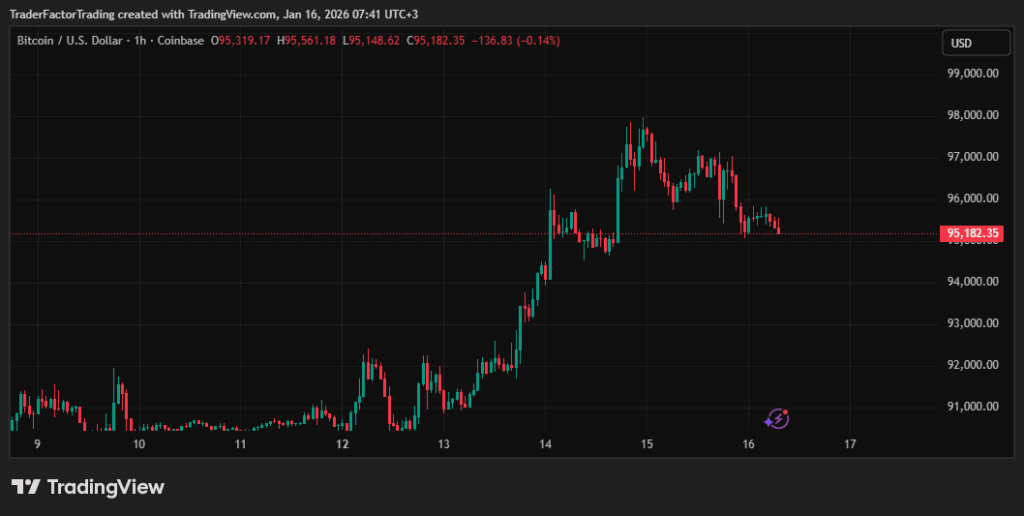
Bitcoin continues to face significant resistance near the psychological six-figure milestone, trading around $95,600 despite sustained capital inflows into spot exchange-traded funds. Market participants are closely monitoring technical indicators and macroeconomic data to understand why the premier cryptocurrency remains range-bound below $100,000. This stagnation occurs even as institutional products record billions in volume, suggesting a complex interplay between profit-taking by long-term holders and new demand entering the ecosystem. Traders are now questioning whether the current consolidation phase represents accumulation before a breakout or a sign of exhaustion in the prevailing bullish trend that dominated the previous quarter.
Market Performance and Technical Resistance
Current Price Action Analysis
The price action for Bitcoin has demonstrated a distinct lack of momentum in recent sessions, struggling to break through the $96,000 to $97,000 resistance zone. Technical analysis reveals that the Relative Strength Index (RSI) is hovering near neutral territory around 43, indicating that neither buyers nor sellers currently have a decisive advantage in the immediate term. This neutrality is frustrating for bulls who anticipated that the recent surge in ETF inflows would provide sufficient liquidity to push prices into uncharted territory. Instead, the market is witnessing a classic consolidation pattern where selling pressure at higher levels absorbs buying interest, keeping the asset strictly range-bound.

Key Moving Averages and Support Levels
Investors are paying close attention to critical moving averages that currently define the market structure for the digital asset. While long-term indicators like the 50-day and 200-day moving averages remain supportive of a broader uptrend, short-term metrics like the 5-day and 10-day moving averages signal potential weakness. Support is firmly established near the $94,000 mark, a level that has been tested repeatedly and held firm against bearish attempts to drive prices lower. If this support level fails to hold, analysts warn of a potential retracement toward $92,000, which would likely trigger a cascade of stop-loss orders from leveraged positions.

The Role of Institutional Flows
ETF Inflow Dynamics vs. Price Impact
A significant divergence has emerged between the volume of capital entering Bitcoin ETFs and the actual price performance of the underlying asset. Despite substantial daily inflows into major funds managed by financial giants, the price impact has been muted compared to previous periods of similar activity. This phenomenon suggests that over-the-counter (OTC) desks may be absorbing much of this institutional demand without it immediately affecting order books on public exchanges. Furthermore, miner selling and long-term holder distribution appear to be counteracting the buy pressure from ETFs, creating an equilibrium that prevents rapid price appreciation despite the positive fund flows.

Derivatives and Options Market Outlook
The derivatives market offers additional insight into why Bitcoin remains pinned below the $100,000 threshold despite broader optimism. Open interest in call options with a strike price of $100,000 for January remains high, representing billions in notional value. However, market makers who sold these calls act as a dampening force as they hedge their exposure, often selling the underlying asset as prices approach the strike price. This hedging activity creates a natural barrier or “gamma wall” that makes it increasingly difficult for the price to advance without a massive surge in spot market volume to overwhelm the derivative-related selling pressure.

Macroeconomic Headwinds and Sentiment
Inflation Data and Monetary Policy
Broader economic factors continue to exert influence over risk assets, including cryptocurrencies, as traders adjust their expectations for future interest rate cuts. Recent inflation data suggests that price pressures in the general economy remain sticky, potentially delaying aggressive monetary easing by central banks. This uncertainty strengthens the US dollar index, which historically shares an inverse correlation with Bitcoin prices. When the dollar shows strength, it becomes more expensive to purchase Bitcoin, and risk appetite generally diminishes across global markets. Consequently, macro traders remain cautious, reducing the speculative fervor needed to drive a breakout above $100,000.
Wrapping Up The Bitcoin Price Performance
Bitcoin remains locked in a battle between bullish institutional flows and bearish technical resistance below the $100,000 mark. While the fundamental backdrop of ETF adoption remains positive, market mechanics and macroeconomic uncertainty are currently capping upside potential. Traders should monitor the critical support at $94,000 and resistance at $96,000 for signs of the next major directional move.

Disclaimer:
All information has been prepared by TraderFactor or partners. The information does not contain a record of TraderFactor or partner’s prices or an offer of or solicitation for a transaction in any financial instrument. No representation or warranty is given as to the accuracy or completeness of this information. Any material provided does not have regard to the specific investment objective and financial situation of any person who may read it. Past performance is not a reliable indicator of future performance.