TradingView is a leading cloud-based charting software and social networking software that allows both novice and experienced traders to make more informed trading decisions. It provides a wide array of charts, technical analysis tools, and indicators for stocks, commodities, cryptocurrencies, and forex markets. With its user-friendly interface, it’s heralded as a go-to platform for financial traders worldwide.
The purpose of this TradingView review 2023 is to provide an in-depth look at TradingView’s features, particularly focusing on its usability for beginners in the forex trading sphere. By analyzing its charting capabilities, real-time data access, the value proposition of the Pro version, and the benefits of its community and networking features, we aim to help beginners decide if TradingView is the best forex trading and charting tool for their needs in 2023. Throughout this review, we’ll consider the platform’s ease of use, educational resources, and overall value for money.

TradingView (rating) Accessibility: Quality of Research/Analysis: Price
Accessibility:
TradingView’s platform is highly accessible, designed with a user-friendly interface that caters to both beginners and experienced traders. It can be accessed via a web browser on any device, including desktops, laptops, tablets, and smartphones, without the need for downloading any software. The platform supports 22 languages, making it accessible to a global audience. The ability to customize charts and the layout of the workspace adds to its accessibility, allowing users to tailor the platform to their specific needs.
Quality of Research/Analysis:
The quality of research and analysis on TradingView is impressive. With over 100 pre-built technical analysis indicators and a powerful scripting language for creating custom studies and signals, traders have an extensive toolkit at their disposal. The platform’s stock screener and social networking features further enhance its research capabilities, allowing users to filter and sort stocks based on specific criteria and gain insights from a diverse community of traders. However, it’s important to note that the quality of user-generated content can vary.
Price:
How much does TradingView cost?
TradingView offers a range of pricing options to suit different budgets and needs. The free version provides access to basic charting, research tools, and social networking features. For more advanced features such as real-time financial statements data, more indicators and alerts, and priority customer support, users can upgrade to one of the paid plans. The TradingView cost mostly starts at $14.95 per month for the Pro version, $29.95 per month for the Pro+ version, and $59.95 per month for the Premium version. While some users may find the cost of the premium plans quite high, many agree that the wealth of features and tools provided offer good value for money.

Key Features of TradingView

Charts and Technical Analysis
TradingView excels at chart based and analytical techniques using various tools and options. TradingView provides an extensive tool for beginners and experienced traders to analyze the markets in an unbiased fashion. TradingView consists of 14 chart types in depth market analysis, over 20 time frames, 90 drawing tools, and 100 indicators based on custom built. Trading View is the desktop version of TradingView which provides rapid, usable and reliable charts.
Chart Types
TradingView boasts an impressive 14 types of charts, including line, bar, candlestick, and more advanced options like Renko, Kagi, and Point & Figure charts. This intraday spread chart gives traders the flexibility to view market data in a manner that best suits their trading style and strategy.
Time Frames
With over 20 different time frames to choose from, ranging from one minute to one month, TradingView caters to all types of traders, whether they’re day traders looking at minute-by-minute changes or long-term investors studying monthly trends and line breaks.
Drawing Tools
The platform provides over 90 drawing tools, such as trend lines, Fibonacci retracements, pitchforks, and Gann fans. These tools are crucial for mapping out support and resistance levels, identifying trend patterns, and predicting potential price movements.

Indicators
TradingView offers more than 100 pre-built technical indicators, including popular ones like Moving Averages, Relative Strength Index (RSI), and Bollinger Bands. Additionally, the platform supports Pine Script, a coding language that allows traders to create their own custom indicators and strategies.
The desktop version of TradingView maintains the same robust functionality as the web-based platform, offering rapid, usable, and reliable charts. Users can customize their workspace, save their best stock charting tool layouts, and even trade directly from the charts with certain brokers.
TradingView’s comprehensive charting and detailed technical analysis tools provide users with a versatile and dynamic environment to analyze the markets effectively. Whether you’re a novice trader looking to learn the ropes or an experienced trader seeking advanced analytical capabilities, TradingView is a platform worth considering.
Analytical Tools
TradingView offers a wide range of analytical tools that cater to both beginner and experienced traders. These include over 100 pre-built technical analysis indicators, such as Moving Averages, RSI, MACD, Stochastic Oscillator, and Bollinger Bands, among others.
Moving Averages
Moving averages are one of the most commonly used technical analysis tools on TradingView1. They help traders identify potential buy and sell signals by smoothing out price data over a specified period of time. This helps to filter out the ‘noise’ from random short-term price fluctuations, providing a clearer view of the overall trend.

Relative Strength Index (RSI)
The Relative Strength Index (RSI) is a momentum oscillator that measures the speed and change of price movements within a comprehensive range It is typically used to identify overbought or oversold conditions in a market. An RSI reading above 70 indicates that a market may be overbought, while a reading below 30 suggests it may be oversold.
Moving Average Convergence Divergence (MACD)
The Moving Average Convergence Divergence (MACD) is a trend-following momentum indicator that shows the relationship between two moving averages of a security’s price. The MACD triggers technical signals when it crosses above (to buy) or below (to sell) its signal line. The speed of crossovers is also taken as a signal that a market is overbought or oversold.
Stochastic Oscillator
The Stochastic Oscillator is a momentum indicator that shows the location of the close relative to the high-low range over a set number of periods. It generates a value between 0 and 100 and is typically used to identify overbought and oversold conditions, with readings over 80 considered overbought and under 20 considered oversold.
Bollinger Bands
Bollinger Bands are a volatility indicator that creates an envelope around price action. The bands widen during periods of increased volatility and narrow during periods of decreased volatility. The position of the price within the bands can help identify whether a price is relatively high or low.
Pine Script™ in TradingView
Another standout feature of TradingView is its support for Pine Script™. This proprietary scripting language allows users to create and share their own custom studies and signals. Traders can use Pine Script to develop their own unique trading strategies, backtest these strategies, and even publish them on the TradingView platform for others to use.
Pine Script includes a variety of functions and features that allow users to manipulate data, including time series, overlays, inputs, and more. This flexibility makes it a powerful tool for anyone looking to implement and test their own automated trading strategies and ideas.
TradingView’s wealth of analytical tools and the flexibility offered by Pine Script make it a valuable platform for any trader. Whether you’re just starting out or are an experienced trader, these features can help you analyze the markets more effectively and develop successful trading strategies.
Stock Screener and Research Capabilities
Although primarily known for its forex charting, TradingView offers a robust stock screener that helps traders filter and sort stocks based on specific criteria such as market cap, dividend yield, volume, and more. The screener includes data from multiple international exchanges, making it a valuable tool for traders interested in global markets.
Beyond the TradingView stock screener, TradingView’s research capabilities are further enhanced by its social networking feature. Users can follow other traders, participate in discussions, and share their own analyses and predictions. This community-based approach to research allows users to gain insights and ideas from a diverse range of trading perspectives.
Overall, TradingView’s key features – its advanced charting system, comprehensive analytical tools, and thorough stock screener and research capabilities – make it a powerful platform for forex traders at all levels of experience.

Multi Time Frame Charts
Another interesting feature worth mentioning is Multi-Timeframe Charts. It can see different time frames in one chart simultaneously giving you a more detailed trading perspective. Price data and other technical indicators are included. If you are interested in adding more periods to the price chart, click the option “MultiTime period chart” in the menu. This adds shaded boxes to the base price financial data, and all boxes represent periods of the larger time frame. Green-coloured boxes indicate a rise in the cost for the same period, and green-coloured boxes indicate a decline in price.
Candlestick Pattern Recognition In TradingView
The candlesticks feature is now available for trading views. Trading View can display over 80 candlestick patterns on your chart and includes multi-candle patterns such as night and morning dojos.
Understanding Candlestick Patterns in TradingView
TradingView, one of the most popular online stock charting software platforms, offers a comprehensive candlestick pattern recognition system. This system can identify over 85 patterns, ranging from one to five candles in length.
Simple and Complex Candlestick Patterns
The patterns recognized by TradingView include both simple and complex formations. For instance, single candlestick formations like Doji, Hammer, and Shooting Star are easily identified as paper trading well. These are basic patterns that provide insights into market sentiment.

Additionally, two-candle patterns such as Bullish, Bearish, and Dark Cloud Cover are recognized. These patterns often signal potential trend reversals, making them crucial for traders.
More complex multi-candle patterns like Morning and Evening Stars are also part of the system. These patterns typically consist of three candles and can signal potential reversals after an uptrend or downtrend.
How to View Candlestick Patterns on TradingView
Accessing these patterns on TradingView is straightforward. First, click on “indicators” in your chart. Then, select “Patterns” under the “Technical” category. From there, you can see multiple charts or choose a specific candlestick formation to view. This feature allows traders to visualize and understand market trends better.
Statistical Analysis of Candlestick Patterns
An additional feature that sets TradingView apart is its provision of statistical analysis for each pattern. This analysis can be instrumental for traders as it provides deeper insights into the potential success rate of each pattern.
The Role of Candlestick Pattern Recognition in Successful Trading
While candlestick pattern recognition is a valuable tool in a trader’s arsenal, it’s essential to remember that no single tool can guarantee successful trading outcomes. For this reason, these tools should be used alongside other forms of analysis and risk management strategies.
Understanding market dynamics, applying thorough technical and other fundamental data analysis, and managing risk effectively are all crucial elements of successful trading. Candlestick pattern recognition is just one piece of the puzzle, albeit an important one.

TradingView for Beginners

Ease of Use for Beginners
TradingView is designed with an intuitive interface that makes it highly accessible even for beginners. The platform’s key features, such as chart types, time frames, drawing tools, and indicators, are well organized and easy to navigate. For instance, users can easily switch between different chart types or adjust time frames with just a few clicks. Furthermore, beginners can start drawing Fibonacci retracement frames and other technical analysis tools onto their charts with relative ease.
The platform also allows users to customize their workspace according to their preferences, providing a more personalized trading experience. Additionally, TradingView has made placing trades simpler by enabling direct trading from charts with certain brokers.
Available Learning Resources and Community Support
TradingView offers extensive learning resources to help beginners get acquainted with its features and tools. Their Help Center provides detailed guides on how to use built-in indicators, drawing tools, and other features.
For a more structured learning approach, beginners can opt for online tutorials or courses. For example, Udemy offers a complete TradingView tutorial that takes new traders from beginner to intermediate.

Moreover, TradingView hosts a vibrant community of traders where beginners can follow experienced traders, participate in discussions, and learn from shared analyses and predictions. This social networking feature not only aids in learning but also provides a platform for beginners to interact and gain insights from a diverse range of trading perspectives.
TradingView’s user-friendly interface, comprehensive learning resources, and supportive community make it an excellent platform for beginners who want to explore trading.
Best brokers with TradingView Support
One important feature of TradingView is broker integration. The following brokers have integrated their platforms with TradingView to provide traders with a seamless interaction, which enables users to export chart data easily.
ActivTrades
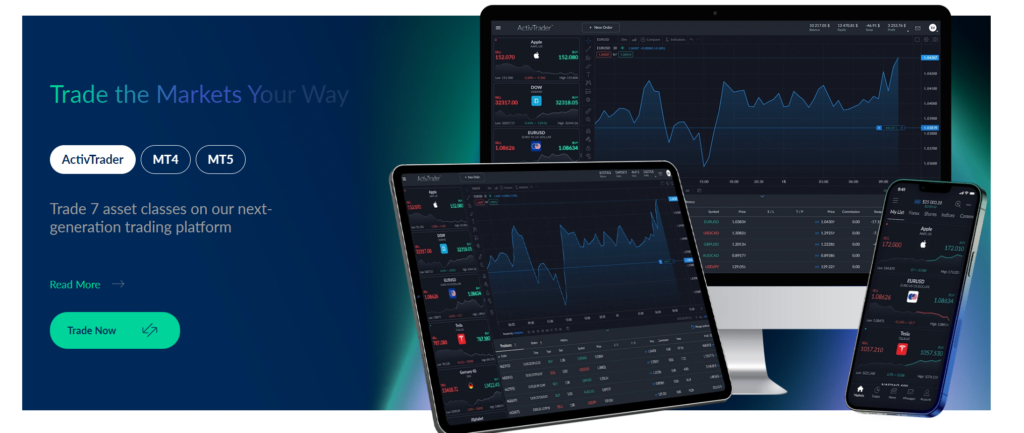
ActivTrades is a UK-based broker established in 2001 and regulated by the UK’s Financial Conduct Authority (FCA), the Commission de Surveillance du Secteur Financier (CSSF) in Luxembourg, and the Security Commission of the Bahamas (SCB). It’s also listed as one of the brokers that can be traded through on TradingView, making it a good choice for traders interested in these trading products.
Open an account – choose ActivTrader Trading Platform and use TradingView for Free: Open An Account.
The broker offers over 1000+ tradable instruments, including Forex, CFDs, Shares, Indices, Commodities, and ETFs. It provides access to more than 35+ indices, 50+ Forex pairs, 15+ commodities, 24 ETFs, and 500+ shares.

ActivTrades is known for its low trading fees. For example, it charges low CFD trading fees for a $2,000 leverage position held for a week and low forex fees for a $20,000 30:1 long position held for a week.
The minimum deposit for trading with this broker was $500, but it has been reduced to $10 USD, EUR, or GBP. ActivTrades also offers a range of cryptocurrency pairs for trading, including popular cryptocurrencies like Litecoin, Ethereum, and Bitcoin.
The broker uses a transparent pricing model without commission on all non-share CFD markets. Overnight fees apply to forex swaps and shares. Due to UK Financial Authority rules, the broker offers no bonuses or promotions.
ActivTrades supports globally recognized trading platforms such as Meta Trader 4 and 5, along with their proprietary platform ActivTrader. In addition, other trading platforms are accessible on desktop, web, and mobile devices.
EightCap
Australian-based broker EightCap, also known as 8cap, was founded in 2009 and is regulated by two jurisdictions of tier-1 and tier-2 levels. It offers over 200 foreign currency trading pairs and other financial instruments, providing a diverse range of investment options for traders.
Open an account with EightCap and use TradingView for Free: Open An Account
Eightcap supports TradingView, providing a seamless trading experience for its users. In addition, it provides two types of accounts: Raw and Standard. The minimum deposit to open an account is $100. Leverage starts at 1:100, with a maximum of 1:500 for TraderFactor Ltd clients.
For Raw accounts, spreads start from 0.0 pips, and a commission of $3.5 per traded lot is charged. In contrast to retail investor accounts, Standard accounts have spread from 1.0 pip and no commission.

EightCap offers cryptocurrency trading through CFDs, expanding the opportunities for institutional investors interested in digital currencies. The broker provides deposit and withdrawal options, including bank wire, China UnionPay, credit/debit card, Skrill, Neteller, BPay, and Poli.
The firm takes client data protection seriously, using standard SSL encryption and complying with APPs and GDPR. This ensures that users can confidently trade, knowing their personal information is secure.
Regarding education, EightCap offers trading platform tutorials, videos, and a selection of educational articles. This helps both novice and experienced traders to enhance their trading knowledge and skills.
Customer support is available through phone calls, live chat, and email, ensuring that traders can get assistance when they need it.
Interactive Brokers
Interactive Brokers is a well-established broker that provides a wide range of trading tools and assets. The platform offers full real-time market data, one-time monitoring, alerts, watchlists, and a customizable account dashboard that makes tracking your investments straightforward and efficient.
They also support multiple trading platforms, including desktop, web, and mobile versions for both Android and iOS devices, making trading accessible no matter where you are. Their unique tools, such as the Accumulate/Distribute Algo and Fundamentals Explorer, provide an edge for traders looking for advanced strategies and in-depth analysis.
Saxo Bank
With access to international markets and various asset classes, Saxo Bank caters to traders with diverse investment interests. Its web-based trading platform integrates seamlessly with TradingView, offering a comprehensive suite of tools for robust market analysis and trade execution. This makes it a suitable choice for traders who prefer a unified trading experience.

FOREX.com
As a specialist in forex trading, FOREX.com offers robust trading platforms and educational resources, catering to both novice and experienced traders. Their user-friendly interface integrates well with TradingView, allowing traders to capitalize on TradingView’s advanced charting capabilities while executing trades on FOREX.com’s platform.
TradeStation
TradeStation stands out for its advanced trading technologies and online brokerage services. It enjoys high customer trust, reflected in its 4.4/5 rating on TradingView’s verified reviews. The platform offers a comprehensive set of tools that enable traders to track, analyze, and place trades effectively.
OANDA
OANDA is highly recognised for its transparent pricing model and emphasis on customer-focused tools. The positive feedback from its users has earned it an excellent rating of 4.6/5 on TradingView’s verified reviews. This makes OANDA an ideal choice for traders prioritising transparency and effective customer service.
Webull
Webull offers free stock/ETF trading and pays high interest on uninvested cash, making it a cost-effective option for traders. Its integration with TradingView offers traders a seamless, no-commission trading experience.
Alpaca Trading
Alpaca stands out for its impressive API and commission-free trading. As one of the brokers you can trade through on TradingView, Alpaca provides a cost-effective trading solution, especially for those who utilize algorithmic trading strategies.
Real-time data access with TradingView
As noted, TradingView provides premium users with real-time data access only. It offers live quotes, stock charts, and expert trading ideas. The platform delivers real-time data on all types of financial markets everywhere, including forex, cryptocurrencies, stocks, indices, futures, and bonds.
In the context of forex trading, TradingView’s real-time data access means traders can view the most recent exchange rates, market trends, and economic indicators as they happen. Traders can use these real-time updates to make informed decisions about buying and selling currencies.

Importance of Real-Time Data in Forex Trading
Informed Decision Making
With TradingView’s real-time data feeds, traders can have the latest information at their fingertips, enabling them to make well-informed trading decisions. Without this instant data, traders could base their strategies on outdated information, leading to less-than-optimal trading decisions and potential losses.
Identifying Opportunities
The forex market is known for its volatility, with currency values fluctuating rapidly. This volatility can create lucrative trading opportunities. Real-time data from TradingView allows traders to spot these opportunities as they arise and quickly act on them.
Risk Management
Real-time financial and economic data also plays a critical role in risk management. By monitoring live market trends and price movements, traders can identify potentially risky situations earlier and adjust their strategies accordingly to protect their investments.
Efficiency
Real-time data allows traders to respond promptly to market changes. This efficiency can mean capitalizing on a beneficial market shift or missing out entirely.
Accuracy
Lastly, TradingView’s real-time data ensures traders have the most accurate and up-to-date information. This accuracy is invaluable in a market where even small miscalculations can lead to significant losses.
Overall, real-time data access through platforms like TradingView is an essential tool for any forex trader. It provides the most current and accurate information, enabling traders to make informed decisions, identify opportunities, manage risks, and trade more efficiently.
TradingView Social Network and Community
TradingView is more than just a charting platform. It’s a vibrant social network and community of traders passionate about sharing ideas, strategies, and opinions.
The TradingView community includes official channels, forums, social media groups, and other communication platforms where members interact, exchange knowledge, ask questions, and collaborate. It’s a global community of market enthusiasts where traders can stay updated on what others are doing, see their forecasts, and even learn from their trading codes.
One unique feature of the TradingView community is its social trading aspect. This refers to traders sharing their investment strategies and trading signals with community members. This feature is built into the core of the Tradingview pricing platform, making it easy for traders to learn from each other and make more informed trading decisions.

Another key component of the TradingView community is its team of moderators. These active members have earned the trust of other members and the TradingView staff. They volunteer their time to help manage the community and ensure it remains a positive and helpful environment for all members.
Furthermore, TradingView provides comprehensive support to its community members. The platform has a dedicated Help Center where users can find answers to questions about using various TradingView features, including its charts, trades, billing, data, and desktop & mobile apps.
To maintain a healthy and respectful community, TradingView has established house rules and guidelines for publishing content on the platform. These rules help manage the large community of millions of traders and investors worldwide.
TradingView’s social network and community form a significant part of its appeal. It offers traders a space to connect with like-minded individuals, share trading ideas, learn from each other, and improve their trading skills.

TradingView Pro: Is It Worth It?
Comparison between Free and Pro versions
TradingView offers a range of subscription plans to cater to the diverse needs of traders, including Free, Pro, Pro+, and Premium. Here is a comparison between the two Free plan and Pro versions:
TradingView Free Version
The Free version of TradingView, as the name suggests, costs nothing and allows users to perform stock analysis and screening and read community trade ideas at no charge. It provides basic charting tools and lets users publish view trading, and share trade ideas anywhere. However, it has some limitations, such as the number of indicators per chart, the number of saved chart layouts, and the availability of customer support.
TradingView Free Version Pro Version
TradingView Pro is the first step up from the free Tradingview account. It offers advanced features, such as intraday technical analysis for day traders, more charts, intervals, and indicators, and a distraction-free trading experience. Other features include priority customer support, enhanced watchlists, custom time intervals, and extended trading hours.
Analysis on whether the Pro version is worth its cost
Whether TradingView Pro is worth its cost depends on an individual trader’s needs and trading frequency.
The free version might be sufficient for casual traders or those just starting out. It offers basic features to help newcomers understand market trends and develop their trading strategies.
However, the Pro version can be a valuable investment for active traders or those who rely on more sophisticated analysis. Additional features like more indicators, custom time intervals, and extended trading hours can significantly enhance trading efficiency and effectiveness.
Moreover, the Pro version removes ads, providing a distraction-free trading environment many traders appreciate. Priority customer support also ensures that any issues or queries are addressed promptly, further enhancing the user experience.
If you’re a serious trader who requires advanced tools and a seamless trading experience, the TradingView Pro version could be a worthwhile investment.

TradingView Alerts
Understanding TradingView Alerts
TradingView’s server-side alerts are a useful feature that allows traders to stay on top of their trades without constantly monitoring the markets. These alerts can be set up to notify users when certain conditions are met, such as when a price reaches a specific level or an indicator gives a certain signal.
Setting Up TradingView Alerts
Setting up alerts in TradingView is simple. Users can create an alert by clicking on the ‘Alerts’ tab on the right-hand side of the screen and then selecting ‘Create Alert’. From there, they can choose the condition for the alert (for example, when the price crosses a certain level), the frequency of the alert (once, every time it happens, etc.), and the method of notification (pop-up, email, SMS, or webhooks).
Customizing TradingView Alerts
One of the great things about TradingView alerts is that they can be customized to suit the user’s needs. Traders can set alerts based on a wide range of conditions, custom technical indicators including price levels, technical analysis indicators, and even create custom indicators Pine Script strategies. This makes them a versatile tool for any trading strategy.
Advantages of TradingView Alerts
TradingView alerts provide several benefits to traders. They can help save time by automating the monitoring process, allowing traders to focus on other aspects of their trading strategy. They also reduce the risk of missing a potential trading opportunity due to being unable to watch the market constantly.
TradingView alerts are a powerful tool that can enhance any trader’s strategy by providing timely and accurate notifications of market conditions.

Pros and cons of TradingView
Pros of TradingView
- TradingView is one of the most versatile platforms available for traders. It provides various tools and features that cater to different trading styles and strategies.
- The platform offers simple, fast, and sleek charts that are easy to navigate. Zooming in and out is smooth, making it comfortable to use.
- TradingView boasts a huge library of indicators, providing traders with a wealth of analytical tools to help them make informed decisions.
- With its 19 million user community, TradingView offers an excellent platform for learning from other traders and sharing insights.
- Users can compare different stocks or crypto coins, enhancing their market analysis.
- The platform allows users to save their chart views, eliminating the need to constantly adjust filters.
- While TradingView is free for anyone to use, paid subscriptions offer additional features, such as an increased number of indicators and charts.
Cons of TradingView
- The free version of TradingView has certain limitations, such as fewer indicators and less data history.
- The platform may not be the best choice for value or dividend investors, as it primarily focuses on technical analysis.
- TradingView does not offer stock screening, which can be a drawback for some traders.
Overall, TradingView’s pros outweigh its cons, making it a valuable tool for any trader. Whether you’re a beginner or an experienced trader, TradingView offers a range of features that can help you analyze the markets effectively and develop successful trading strategies.

Does Tradingview Offer Signals?
Tradeview enables customers to create price alerts for their favourite stocks and assets. Alerting can be easily configured by enabling traders to keep updated on market changes.
TradingVIEW Basic offers a single alert, Pro offers 20 server-side alerts, and Premium gives ten. Premium customers receive 100 server-side alerts.
Trading View alerts can also contain indicators, trading strategies and custom drawings to give the user an overview of the current price level.
However, it’s important to note that while these signals can assist traders in making informed decisions, they are not always accurate. Trading success requires more than signals; it also involves proper risk management and patience.

How Reliable is TradingView’s Data and News?
TradingView connects with multiple data channels, providing access to over 1.3 million instruments globally. This extensive coverage suggests the platform draws from numerous data sources, which could potentially enhance the reliability and comprehensiveness of its data.
However, as with any tool, reliability can sometimes depend on the specific usage and context. While many find TradingView’s historical data more reliable, some discrepancies have been noted. Therefore, it may be prudent for users to cross-verify important data with other reliable sources when making crucial trading decisions.
Is TradingView Worth the Money?
TradingView’s incredibly useful features include a variety of charts, customizable charts, Real-Time information, and a support team for traders. It offers various subscriptions geared to the various market needs and budget requirements of swing traders.
Who Are the Best Forex Brokers?
Here are some trusted multiregulated forex brokers suitable for all styles of trading :
OneRoyal: Known for its social trading platform, OneRoyal offers many educational resources and a convenient demo account for practice.
IronFx: This broker provides a simple platform and a risk management tool, helping you better control your trading risks.
Admirals: Admirals stands out with exceptional customer support and a wide range of educational resources.
ActivTrades: Offers a user-friendly platform, extensive educational resources, and versatile demo accounts.
EightCap: EightCap wraps it up with an intuitive platform, top-notch educational materials, and an effective customer support team.
Disclaimer:
All information has been prepared by TraderFactor or partners. The information does not contain a record of TraderFactor or partner’s prices or an offer of or solicitation for a transaction in any financial instrument. No representation or warranty is given as to the accuracy or completeness of this information. Any material provided does not have regard to the specific investment objective and financial situation of any person who may read it. Past performance is not a reliable indicator of future performance.
Authors
-

Zahari Rangelov is an experienced professional Forex trader and trading mentor with knowledge in technical and fundamental analysis, medium-term trading strategies, risk management and diversification. He has been involved in the foreign exchange markets since 2005, when he opened his first live account in 2007. Currently, Zahari is the Head of Sales & Business Development at TraderFactor's London branch. He provides lectures during webinars and seminars for traders on topics such as; Psychology of market participants’ moods, Investments & speculation with different financial instruments and Automated Expert Advisors & signal providers. Zahari’s success lies in his application of research-backed techniques and practices that have helped him become a successful forex trader, a mentor to many traders, and a respected authority figure within the trading community.
View all posts -

Phyllis Wangui is a Financial Analyst and News Editor with qualifications in accounting and economics. She has over 20 years of banking and accounting experience, during which she has gained extensive knowledge of the forex, stock news, stock market, forex analysis, cryptos and foreign exchange industries. Phyllis is an avid commentator on these topics and loves to share her insights with others through financial publications and social media platforms.
View all posts

