
In the latest releases by the Bureau of Economic Analysis (BEA), it was revealed that the Personal Consumption Expenditures (PCE) price index, excluding food and energy, increased by 0.2 percent in July. This moderate rise in prices reflects the ongoing inflationary pressures the economy has been facing in recent months.
The overall core PCE price index, which includes all goods and services, also increased by 0.2 percent in July compared to the previous month. These figures indicate that prices are continuing to climb, albeit at a steady pace.
When examining the data further, it becomes clear that the increase in prices was primarily driven by higher costs for services. Prices paid for services rose by 0.4 percent, highlighting the growing expenses in sectors such as food services and accommodations, financial services and insurance, and housing and utilities.
On the other hand, prices for all goods and services experienced a slight decrease of 0.3 percent. However, certain categories within goods spending saw notable increases less food and other prices. “Other” nondurable goods and recreational goods and vehicles were the major contributors to the rise in goods spending.
Comparing the current data with last year’s figures, the PCE price index for July showed a significant increase of 3.3 percent. Prices for goods decreased by 0.5 percent, while prices for services rose by 5.2 percent during this period. Excluding food and energy, the PCE price index increased by 4.2 percent from one year ago.
Despite the rise in prices, the PCE data shows real Personal Consumption Expenditures (PCE) increased by 0.6 percent in July. This growth can be attributed to a 0.9 percent increase in spending on goods and a 0.4 percent increase in spending on services. The report suggests that consumers are still willing to spend, albeit at a slightly slower pace.
The Personal Income and Outlays report also revealed that personal income increased by $45.0 billion in July, with a significant portion of this increase coming from compensation. Disposable personal income (DPI) saw a minor increase of less than 0.1 percent.
While the expected increase in personal income is positive news, it was partially offset by a decrease in personal current transfer receipts. Real DPI, which takes inflation into account, experienced a slight decrease of 0.2 percent in July.
These latest figures indicate that while personal income is growing, inflationary pressures are persisting. With the PCE price index remaining above the Federal Reserve’s target of 2 percent, policymakers expect they will continue to closely monitor these trends and assess their impact on both inflation gauge the overall health of the economy.
Comparative Analysis of Economic Indicators: March to July 2023
Personal Income
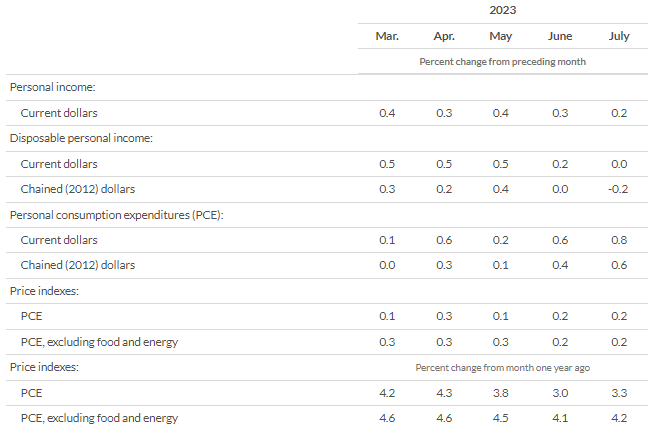
From March to July, personal income experienced a consistent growth trend, albeit at a moderate pace. The month of March saw a 0.4% increase, followed by consecutive increases of 0.3%, 0.4%, 0.3%, and 0.2% in April, May, June, and July, respectively. These figures indicate a positive trajectory in personal income, highlighting potential improvements in individuals’ earning capacity.
Disposable Personal Income
Moving on to disposable personal income, we examine two aspects: current dollars and chained 2012 dollars. In terms of current dollars, the growth rate remained relatively stable throughout the five-month period. March, April, and May witnessed a consistent 0.5% increase, while June and July experienced slightly lower growth rates of 0.2% and 0.0%, respectively.
However, when considering chained 2012 dollars, there was some fluctuation. March and May saw increases of 0.3% and 0.4%, respectively. However, April and June recorded smaller gains of 0.2% and 0.0%, respectively, followed by a slight decrease of -0.2% in July. These changes indicate a more nuanced picture of disposable and personal consumption expenditures price and income.
Personal Consumption Expenditures
Moving on to personal consumption expenditures (PCE), we observe a different pattern of growth in consumer behavior as compared to personal income and disposable than personal consumption expenditures and income. PCE, in current dollars, demonstrated a steady upward trend from March to July.
The growth rates for those months were 0.1%, 0.6%, 0.2%, 0.6%, and 0.8%, respectively. This suggests an increased level of spending by individuals during this period.
Similarly, when considering chained 2012 dollars, PCE showed consistent growth, though at a slightly lower magnitude. The growth rates for March to July were 0.0%, 0.3%, 0.1%, 0.4%, and 0.6%, respectively.
These figures indicate that while there is overall growth in personal consumption expenditures, the rate of increase in consumer expenses may be influenced by factors such as inflation and changing purchasing power.
Price Indexes – PCE
Turning our attention to price indexes, we examine the PCE, a measure of inflation which provides insight into the inflationary pressures within the economy.
From March to July, the PCE price index experienced a gradual increase. The monthly increases ranged from 0.1% to 0.2%. Although these changes may seem small, they reflect the ongoing rise in prices across various sectors of the economy.
Price Indexes – PCE, Excluding Food and Energy
To gain a more accurate understanding of underlying inflationary pressures, it is essential to consider the price index excluding food and energy. This price index is capturing inflation and provides a measure underlying inflation trend of core inflation, excluding the volatile food and energy sectors.
Similar to the overall PCE price index and inflation, the price index excluding food and energy also showed a gradual increase from March to July. The monthly increases ranged from 0.3% to 0.2%, reinforcing the presence of inflationary pressures across the broader economy.
Price Indexes – PCE (Percent change from month one year ago)
Finally, let’s assess the changes in price indexes compared to the same period last year. In March, the PCE price index experienced a 4.2% increase compared to the previous year.
This upward trend continued in April, May, and June with increases of 4.3%, 3.8%, and 3.0%, respectively. July recorded a 3.3% increase, indicating a general upward trend in prices over the past year.
Price Indexes – PCE, Excluding Food and Energy (Percent change from month one year ago)
When considering the consumer price index, excluding food and energy prices, the same upward trajectory is evident. March witnessed a 4.6% increase compared to the previous year, followed by identical increases of 4.6% in April and May. In June and July, the increases in consumer price index were slightly lower at 4.1% and 4.2%, respectively. These figures underscore the persistent inflationary pressures within the economy, especially when core inflation is considered.
The comparative economic analysis, of economic indicators for the period of economic analysis from March to July 2023 provides valuable insights into the state of the economy. Personal income and consumption expenditures exhibited growth, while price indexes indicated a general upward trend in prices. These findings contribute to a broader understanding of the economic climate.
The Core PCE Price Index (Personal Consumption Expenditures)
The PCE (Personal Consumption Expenditures) price index is a measure of the average change in prices that consumers pay for goods and services. It is one of the key indicators used by economists and policymakers to track inflation and assess the overall health of the economy.
The PCE price index takes into account a wide range of consumer spending categories, including durable goods (such as cars and appliances), nondurable goods (such as food and clothing), and services (such as healthcare and transportation). It provides a comprehensive view of price changes across these different sectors.
PCE Price Index Variations
The PCE price index is often reported with two variations: the overall PCE price index, which for underlying inflation trend includes all goods and services, except commodities, and the PCE price index excluding food and energy, which focuses on core inflation by excluding the more volatile food and energy sectors.
Economic analysis
By monitoring changes in the PCE price index, policymakers can make informed decisions about monetary policy, interest rates, and other economic measures to maintain price stability and promote sustainable economic growth.
Disclaimer:
All information has been prepared by TraderFactor or partners. The information does not contain a record of TraderFactor or partner’s prices or an offer of or solicitation for a transaction in any financial instrument. No representation or warranty is given as to the accuracy or completeness of this information. Any material provided does not have regard to the specific investment objective and financial situation of any person who may read it. Past performance is not a reliable indicator of future performance.