

The EUR/USD exchange rate is struggling below 1.05500 following the release of the US Durable Goods Orders data. The better-than-expected US Durable Goods Orders data has preserved the USD strength preventing the EUR/USD pair from staging a rebound.
EUR USD Daily Chart

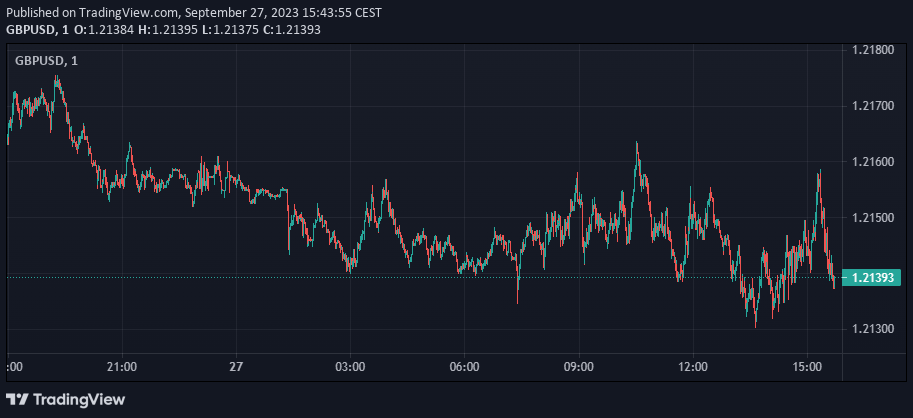
GBP/USD Trades Below 1.2150
The GBP/USD exchange rate is struggling below 1.2150 and has been trading near a multi-month low set mid-week.
The persistent strength of the US Dollar (USD) has limited the pair’s rebound, despite a modest improvement in risk mood. This comes after the recent US Durable Goods Orders data, which showed a slight increase, bolstering the USD’s strength.
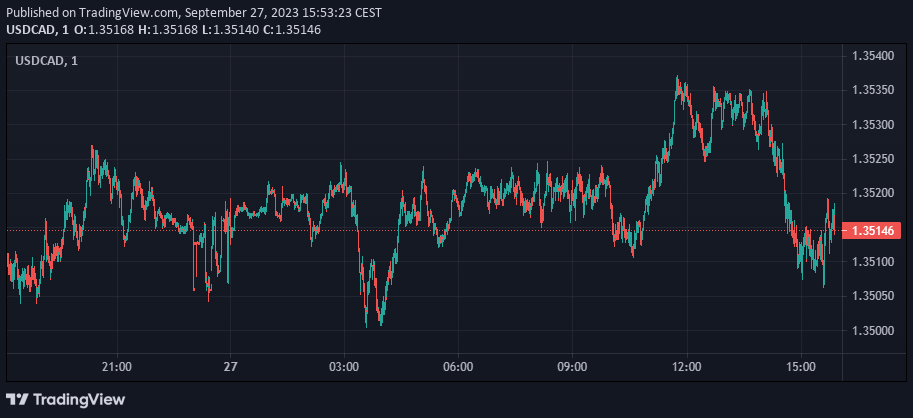
USD/CAD Strives to Maintain Momentum Above 1.3510
The USDCAD exchange rate is struggling to extend gains for the second consecutive day, hovering above 1.3510 during the European session on Wednesday. The pair has been experiencing upward support due to risk aversion and improved US Treasury yields.
Despite the positive momentum, the pair is still facing resistance at higher levels, with markets closely watching the developments in the US and Canada. The persistent strength of the US Dollar (USD) has limited the pair’s rebound, despite a modest improvement in risk mood.
USDCAD Daily Chart
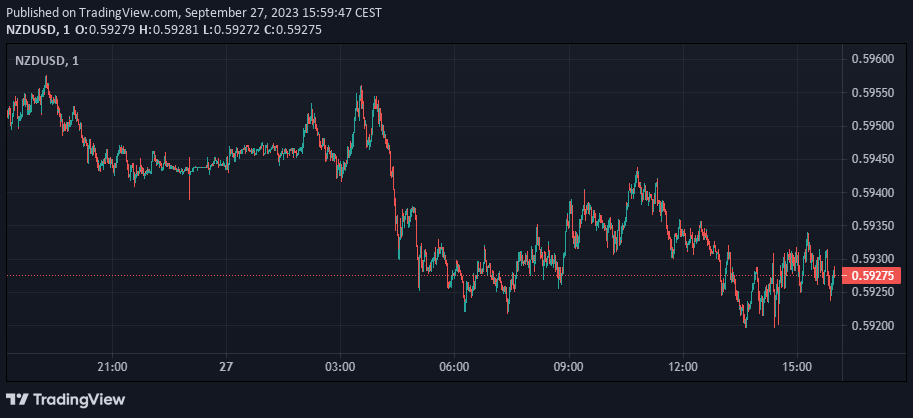
NZD/USD Continues to Dip Below 0.5950 Amidst US Dollar Strength
NZD/USD Continues to Face Downward Pressure Amid US Dollar Surge. The pair’s slight increase is supported by the robust US Dollar (USD) and risk aversion. The pair is currently trading around 0.59275, marking a 0.20% decline for the day.
NZDUSD Daily Chart
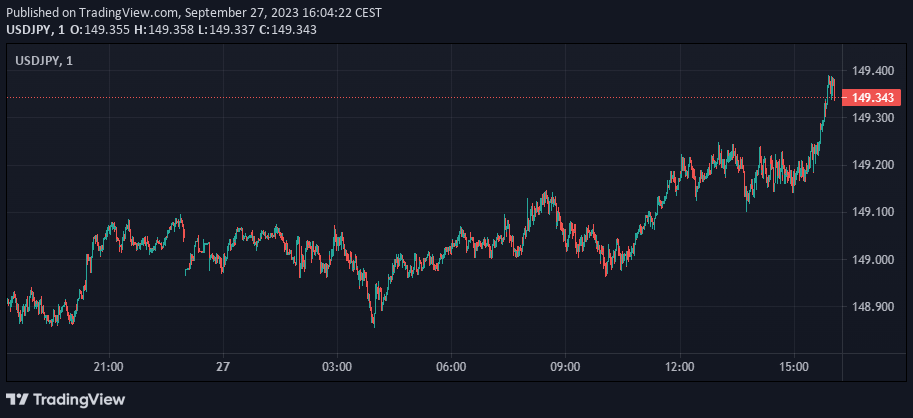
The USDJPY Strengthens Above 149.30
The USD/JPY exchange rate is on an upward trend, above 149.30 on Wednesday, September 27, 2023. The strength of the JPY USD is being fueled by heightened demand for the US currency.
USD Yen Daily Chart
In a report by the U.S. Census Bureau, new orders for manufactured durable goods in August 2023 showed a slight increase of 0.2 percent, amounting to $284.7 billion. This rise comes after a decrease of 5.6 percent in July 2023, signaling a potential recovery in the manufacturing sector.
| Category | Change | Amount in August (in billions) |
|---|---|---|
| New Orders | +0.2% | $284.7 |
| Excluding Transportation | +0.4% | – |
| Excluding Defense | -0.7% | – |
| Shipments | +0.5% | $284.6 |
| Unfilled Orders | +0.4% | $1,335.9 |
| Inventories | +0.2% | $523.6 |
| Nondefense New Orders for Capital Goods | -2.9% | $86.1 |
| Shipments of Capital Goods | +1.2% | $83.3 |
| Unfilled Orders for Capital Goods | +0.4% | $780.6 |
| Inventories of Capital Goods | +0.3% | $226.0 |
A Closer Look at the Numbers
Excluding transportation, new orders increased by 0.4 percent. However, when excluding defense, new orders saw a decrease of 0.7 percent. Machinery led the increase, with a rise of 0.5 percent to $37.8 billion, marking an increase in four out of the last five months.
Shipments on the Rise
Shipments of manufactured durable goods also saw an increase in August, rising by 0.5 percent to $284.6 billion. This followed a minor decrease in July. The transportation equipment sector, which had seen two consecutive monthly decreases, led the increase with a rise of 0.9 percent to $92.5 billion.
Unfilled Orders and Inventories
Unfilled orders for manufactured durable goods in August increased by 0.4 percent to $1,335.9 billion, following a 0.5 percent increase in July. Transportation equipment was a significant driver of this increase.
Inventories of manufactured durable goods in August also saw an increase of 0.2 percent to $523.6 billion following two consecutive monthly decreases. Again, transportation equipment led this increase.
Capital Goods
Nondefense new orders for capital goods in August decreased by 2.9 percent to $86.1 billion. However, shipments increased by 1.2 percent to $83.3 billion. Defense new orders for capital goods in August saw a significant increase of 18.6 percent to $14.8 billion.
Revised July Data
Revised data for July shows new orders for all manufacturing industries at $579.3 billion, shipments at $578.2 billion, unfilled orders at $1,330.9 billion, and total inventories at $852.8 billion.
The next release of this data will be on October 26, 2023.
Disclaimer:
All information has been prepared by TraderFactor or partners. The information does not contain a record of TraderFactor or partner’s prices or an offer of or solicitation for a transaction in any financial instrument. No representation or warranty is given as to the accuracy or completeness of this information. Any material provided does not have regard to the specific investment objective and financial situation of any person who may read it. Past performance is not a reliable indicator of future performance.