
According to the Office for National Statistics (ONS), the UK’s GDP expanded by only 0.2% in Q2 2023 compared to the previous quarter. This figure is lower than anticipated and reflects a slowdown in economic growth. In comparison, the Eurozone saw a GDP growth of 0.1%, while the overall GDP growth for the UK was 0.5%.
The weaker UK GDP data, which contracted more than expected, can be attributed in part to industrial action and extreme weather conditions. Analysts had predicted a smaller decline of 0.2%, but factors such as the junior doctors’ strikes impacted the growth of the health service.
Additionally, the exceptionally wet weather in July, which was the wettest on record could have impacted growth. Analysts have raised concerns about the possibility of the UK entering a recession. These factors have contributed to the uncertainty surrounding a potential rate hike by the Bank of England and its impact on the economy.
Overview of UK’s GDP Figures
| Sector | July 2023 Growth Rate (%) | June 2023 Growth Rate (%) |
|---|---|---|
| Monthly GDP | -0.5 | 0.5 |
| Three-month GDP | 0.2 | – |
| Services | -0.5 | 0.2 |
| Consumer-Facing Services | 0 | 0.5 |
| Production | -0.7 | 1.8 |
| Construction | -0.5 | 1.6 |
The July 2023 GDP estimate shows a decline of 0.5%, with falls across all three main sectors. This follows a growth of 0.5% in June 2023. Over the three-month period to July 2023, GDP increased by 0.2%, with growth observed in all three sectors.
In July 2023, services output decreased by 0.5%, contributing significantly to the overall decline in GDP. Consumer-facing services showed no growth in July, while production output fell by 0.7%. The construction sector also experienced a contraction of 0.5% in July.
Sector-wise Performance
| Period | Growth Rate (%) |
|---|---|
| July 2023 | -0.5 |
| June 2023 | 0.5 |
| Three months to July 2023 | 0.2 |
| Three months to April 2023 | 0.2 |
| Production (Three months) | 0.6 |
| Services (Three months) | 0.1 |
| Construction (Three months) | 0.1 |
The monthly real Gross Domestic Product (GDP) for July 2023 is estimated to have fallen by 0.5%, following a growth of 0.5% in June 2023. There are no revisions to previously published data in this release. Data revisions will be provided in the upcoming Quarterly National Accounts release on September 29 and in the next monthly GDP release on October 12.
Looking at the broader picture, GDP showed a growth rate of 0.2% in the three months to July 2023 compared to the three months to April 2023. Production was the main contributing sector to the three-month growth with a 0.6% increase. Services and construction output also increased by 0.1% each in the same period.
Market Reacts to Weaker UK GDP Data, Raises Concerns about BOE Rate Hike
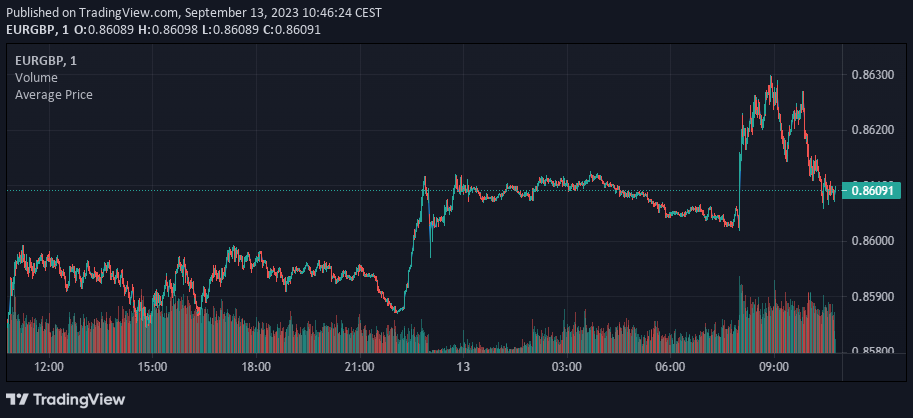
EURGBP edged above 0.86080 on Wednesday’s trading as weaker-than-expected UK GDP data created uncertainty about a potential rate hike by the Bank of England and its impact on the economy. Traders closely watch the ECB’s monetary policy for clarity on the direction of the EURGBP cross.
| EURGBP Highlight | |
|---|---|
| Last price | 0.8625 |
| Daily Change | +0.0012 (0.14%) |
| Daily Open | 0.8613 |
| ———————– | —————— |
| Trends | |
| Daily SMA20 | 0.8564 |
| Daily SMA50 | 0.8582 |
| Daily SMA100 | 0.8617 |
| Daily SMA200 | 0.8712 |
| ———————– | —————— |
| Key Levels | |
| Previous Daily High | 0.8613 |
| Previous Daily Low | 0.857 |
| Previous Weekly High | 0.8601 |
| Previous Weekly Low | 0.8524 |
| Previous Monthly High | 0.8669 |
| Previous Monthly Low | 0.8493 |
| Daily Fibonacci 38.2% | 0.8597 |
| Daily Fibonacci 61.8% | 0.8587 |
| Daily Pivot Point S1 | 0.8584 |
| Daily Pivot Point S2 | 0.8556 |
| Daily Pivot Point S3 | 0.8542 |
| Daily Pivot Point R1 | 0.8627 |
| Daily Pivot Point R2 | 0.8641 |
| Daily Pivot Point R3 | 0.8669 |
These figures provide a snapshot of the current state of EUR/GBP.
The last price refers to the most recent trading price of EUR/GBP. For example, if the last price is 0.8625, it means that the currency pair was last traded at this price level.
The daily change indicates the difference between the current last price and the previous day’s closing price. For instance, if the daily change is +0.0012, it means that the currency pair has increased by 0.0012 units compared to the previous day’s closing price.
The daily moving averages (DMAs) provide an average price over different time periods. For example, if the DMA 20 is 0.8564, it represents the average price of EUR/GBP over the past 20 days. Traders use DMAs to identify potential trends in the market. If the DMA 50, DMA 100, and DMA 200 are all lower than the current last price, it suggests a potential downtrend. Conversely, if they are higher, it indicates a potential uptrend.

The key levels highlight significant price levels from various perspectives. For example, the previous daily high and low represent the highest and lowest prices reached during the previous trading day. Similarly, the previous weekly high and low denote the highest and lowest prices within the previous week, while the previous monthly high and low indicate the highest and lowest prices over the past month. These levels are important for traders as they can act as support or resistance levels.
Fibonacci levels are mathematical ratios derived from the Fibonacci sequence. In the context of trading, they are used to identify potential support and resistance levels. For instance, the daily Fibonacci 38.2% and 61.8% levels represent potential retracement levels where the price might reverse or consolidate before continuing its previous trend.
Pivot points are calculated levels that can indicate potential support and resistance levels for the current trading day. The daily pivot point, along with support and resistance levels (S1, S2, S3, R1, R2, R3), can help traders determine potential price targets or areas of interest.

Disclaimer
The information provided in this article is based on publicly available sources and should not be considered financial advice. It is always recommended to conduct thorough research and consult with a professional before making any investment decisions.