

GBP/USD Resilience Post BoE Policy Announcement
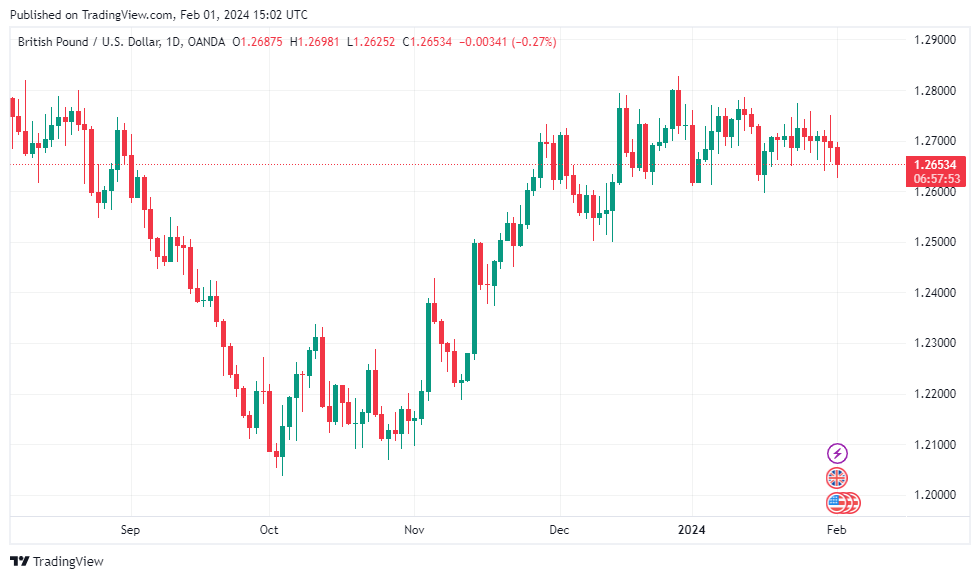
Following the Bank of England’s decision to maintain the policy rate, GBP/USD showed resilience by stabilizing above 1.2650, despite earlier losses. Governor Andrew Bailey’s cautious stance on policy timing contributed to this stability.
GBPUSD Daily Chart
BoE Key Rate Decision and Potential Impact on Pound Sterling
The BoE’s anticipated decision to leave the key rate unchanged, coupled with the potential influence of revised macroeconomic projections and Governor Andrew Bailey’s policy commentary on Pound Sterling’s valuation in the latter part of the day.
UK Economic Indicators and Their Influence
Recent UK economic data highlighted persistent inflation levels and better-than-expected performance in the private sector, potentially impacting market reactions to any dovish adjustments in the BoE’s policy statement.
Potential Scenarios for GBP/USD Movement
Exploring potential scenarios for GBP/USD movement, including the market’s response to a dovish policy adjustment by the BoE and the impact of Bailey’s approach to policy timing and data-dependent guidance on the currency’s valuation.
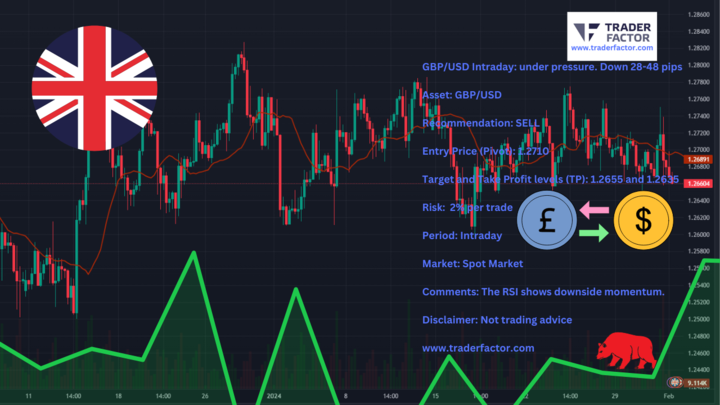
GBP/USD Under Pressure, Down 28-48 Pips
In intraday trading, the GBP/USD currency pair faced downward pressure, with a decrease of 28-48 pips. Analysts recommended a sell strategy for this asset, with an entry price (pivot) at 1.2710 and target take profit levels set at 1.2655 and 1.2635. The risk per trade was advised at 2%, and the analysis pertained to the spot market for the specified period. Furthermore, the RSI indicator suggested a prevailing downside momentum, contributing to the sell recommendation for GBP/USD. This analysis was in line with the recent trends and forecasts surrounding the currency pair’s performance.
EUR/USD Holds Steady Above 1.0800 After US Data
In the early American session on Thursday, the EUR/USD pair continues to fluctuate slightly above the 1.0800 mark. The US data revealed that weekly Initial Jobless Claims exceeded expectations, constraining the USD’s advances and enabling the pair to maintain its position.
Federal Reserve Announcement Impact
The EUR/USD pair hovers around the 1.0800 level, under pressure due to broad US Dollar strength subsequent to the Federal Reserve (Fed) monetary policy announcement. The decision to keep the interest rate unchanged, as widely anticipated, led to a surge in the US Dollar’s value. The Federal Open Market Committee (FOMC) statement underwent significant changes, removing the language concerning additional rate hikes and substituting it with a cautious approach toward upcoming data. Furthermore, policymakers emphasized the necessity for “greater confidence” in inflation nearing its 2% target before considering rate cuts.
Jerome Powell’s Press Conference
Following the announcement, Chairman Jerome Powell’s press conference indicated that a rate cut in March is not the primary scenario. His comments boosted demand for the USD and resulted in negative movements in Wall Street. Despite the somber mood, Asian and European stocks displayed mixed trading patterns during the first half of the day.
EUR/USD Intraday Analysis
In the intraday trading session, the EUR/USD pair encountered downward pressure, resulting in a decline of 30-50 pips. Analysts recommended a sell strategy for this asset, with an entry price (pivot) set at 1.0845 and target take profit levels established at 1.0780 and 1.0760. The risk per trade was advised at 2%, and the analysis pertained to the spot market for the specified period. Furthermore, the RSI indicator indicated a prevailing downside momentum, aligning with the sell recommendation for EUR/USD. These insights are in line with the latest trends and forecasts surrounding the currency pair’s performance, as sourced from various financial analysis platforms.
BTC/USD Intraday Analysis
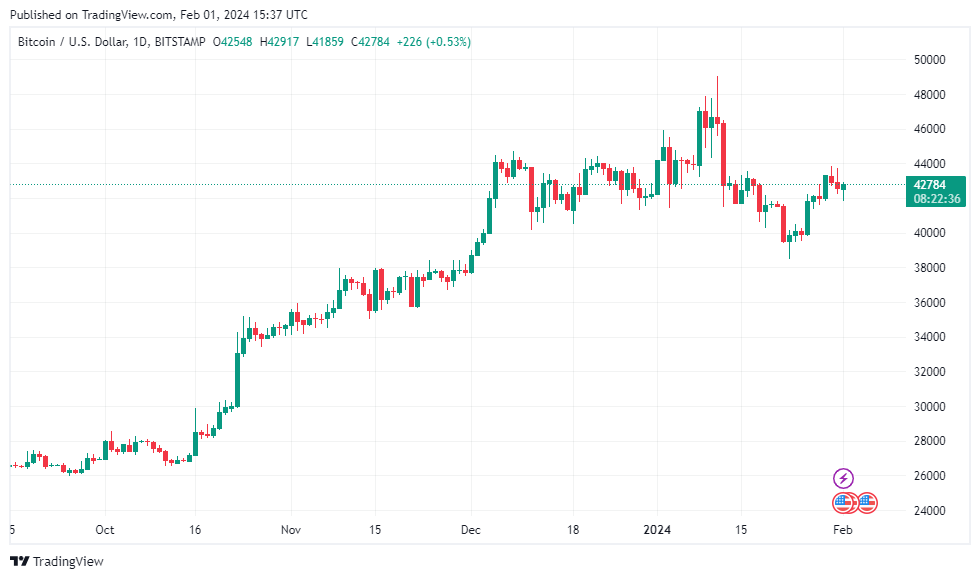
In the intraday trading session, the BTC/USD pair encountered prevailing downside movements, dipping to the range of 40710 – 41150. Consequently, analysts recommended a sell strategy for this asset, with the entry price (pivot) set at 42630, and identified this level as a resistance point. The target and take profit levels were not specifically defined in the context provided. The risk per trade was advised at 1%, and the analysis was pertinent to the spot market for the specified period.
Furthermore, the Relative Strength Index (RSI) was reported to be below 50, while the Moving Average Convergence Divergence (MACD) indicated a negative configuration, positioned below its signal line, thus aligning with the sell recommendation for BTC/USD. These insights were sourced from various financial analysis platforms and are reflective of the latest trends and forecasts regarding the cryptocurrency pair’s performance.
BTCUSD Daily Chart
Disclaimer:
All information has been prepared by TraderFactor or partners. The information does not contain a record of TraderFactor or partner’s prices or an offer of or solicitation for a transaction in any financial instrument. No representation or warranty is given as to the accuracy or completeness of this information. Any material provided does not have regard to the specific investment objective and financial situation of any person who may read it. Past performance is not a reliable indicator of future performance.