Markets in turmoil as middle east tensions escallate: Iran’s attack on a UAE oil hub shatters the ceasefire, WTI soars above $101, the DXY surges, and gold plunges. RBA hikes rate to 4.35%, with USD/JPY on intervention watch. Full support and resistance levels.
⚡ Key Takeaways
🇮🇷⚡🇦🇪 Iran attacks UAE
First major ceasefire breach – targets Fujairah oil hub. War risk returns.
🛢️🚀 Oil > $101
WTI surges on supply fears; analysts warn $120–$150 if Hormuz closes.
💵 Dollar firm
DXY near 98.5 – safe‑haven demand, but capped below 99.
🟡📉 Gold crumbles
Plunges to $4,537 – dollar and yields outweigh safe‑haven status.
🇦🇺📈 RBA hikes to 4.35%
Third straight hike – but AUD slides on risk‑off mood.
🇯🇵💥 Yen on intervention watch
USD/JPY at 159.59 – 160 is the “red line” (Japan spent $35bn last week).
Markets React to Middle East Tensions Escalation as US‑Iran Trade Threats over Strait of Hormuz
Market Report: May 5, 2026
Global markets were rattled on Monday after Iran launched fresh attacks against the United Arab Emirates, shattering the fragile two‑week ceasefire. The escalation threatens a key alternative oil route that had bypassed the Strait of Hormuz, sending oil prices soaring and investors rushing into safe‑haven assets such as the US dollar. Meanwhile, the Reserve Bank of Australia raised interest rates to 4.35% to combat war‑driven inflation, yet the move failed to lift the Australian dollar as broad‑based risk aversion kept commodity currencies under pressure.
“What is driving the market today?”
“Gold is trading near 4530 in a volatile range above 4500 support, while oil holds a strong bullish trend above 100. The US Dollar Index (DXY) remains under pressure below 99, supporting upside in EURUSD and GBPUSD. Overall, forex markets show a risk-on bias with geopolitical tensions driving volatility in commodities.”
How to use this table: S2 and S1 are key downside levels where buyers typically step in; a break below S2 signals trend weakness. R1 and R2 are upside obstacles; a break above R2 confirms strong momentum.
Gold Analysis (XAUUSD)
Gold (XAUUSD) – Technical & Fundamental Analysis
“Gold is trading around 4530 after bouncing from 4500 support and rejecting 4565 resistance. Gold is structurally bearish in the short term, but supported by safe-haven flows creating a conflict-driven consolidation.
“The metal is currently in a short-term bearish structure following a 4H break of structure, but is holding above 4500 due to ongoing safe-haven demand from geopolitical tensions. This creates a mixed environment where downside pressure exists, but dips are being supported.”
If safe-haven demand weakens and 4500 breaks, downside momentum could accelerate toward 4480 and 4450. This makes current price action highly reactive to news flow rather than pure technical structure.”
Oil Analysis (WTI Crude)
“Oil remains highly sensitive to geopolitical risk, with prices rising sharply after Iran targeted the UAE’s Fujairah export zone. This development threatens a critical oil transit route outside the Strait of Hormuz, through which nearly 20% of global supply flows. As a result, WTI crude is holding above 100 in a strong bullish trend, with resistance at 105 and 110, while support is seen at 100 and 97.”
Oil Prices Surge Above Geopolitics and Supply Risks Shake Markets
If tensions escalate into a full disruption of the Strait of Hormuz, analysts warn oil prices could surge toward 120–150 per barrel. In the short term, price action remains volatile, with geopolitical headlines outweighing macroeconomic factors such as interest rate decisions.
Currencies Analysis (Forex market)
“Which currency pairs are moving most as the RBA hikes and the yen weakens?”
The US dollar firmed across the board as investors sought safety, while the Australian dollar weakened despite a widely expected rate hike, and the yen remained on intervention watch after last week’s suspected action.
DXY (US Dollar Index)
“DXY remains under pressure in a bearish structure, trading around 98.5 after failing to break back above the 99 resistance zone. The index is consolidating between 98.2 and 99.0, with downside momentum still dominant. This reflects a market environment where dollar strength is fading as traders price in softer monetary policy expectations and increased global risk appetite.”
“However, the dollar is not in a one-way decline. Safe-haven flows from geopolitical tensions intermittently support the USD, preventing a deeper breakdown. This creates a range-bound but bearish-biased structure, where rallies into resistance are being sold while dips attract limited demand.”
EURUSD
“EURUSD is trading near 1.1686 above 1.1650 support, targeting 1.1725 and 1.1780. Fundamentally, euro strength is driven by a weaker US dollar and stable eurozone outlook.”
GBPUSD
“GBPUSD is trading around 1.3524 with a bullish bias above 1.3485 support, targeting 1.3580 and 1.3650. Fundamentally, the pound is supported by resilient UK data and relatively hawkish expectations.”
AUDUSD
“AUDUSD is trading near 0.7165 above 0.7135 support, targeting 0.7210 and 0.7280. Fundamentally, the Australian dollar is supported by higher interest rate expectations and strong commodity prices.”
NZDUSD
“NZDUSD is trading around 0.5866 with a neutral-to-bullish bias above 0.5830, targeting 0.5905 and 0.5950. Fundamentally, the kiwi is supported by risk sentiment and commodity trends.”
USDCAD
“USDCAD is trading near 1.3623 with a bearish bias below 1.3680, targeting 1.3585 and 1.3550. Fundamentally, the Canadian dollar is supported by rising oil prices.”
USDJPY
“USDJPY is trading around 159.59 near resistance, with support at 158.80. Fundamentally, yen weakness and rate divergence dominate, with intervention risk above 160.”
Forex Market Today: Key Movers USD, Yen, Gold and Oil
USDCHF – Technical & Fundamental Analysis
“USDCHF is trading near 0.7841 with a bearish bias below 0.7885. Fundamentally, the Swiss franc is supported by safe-haven demand and a weaker US dollar.”
“US equities remain bullish, with NASDAQ, Dow Jones, and S&P 500 holding above key support levels. Fundamentally, strong liquidity and investor risk appetite are supporting markets, though geopolitical risks remain.”
Bitcoin Analysis (BTCUSD)
“Bitcoin remains in a bullish market structure, consolidating above 79,500 after reclaiming higher levels near 80,000. Price action shows accumulation following volatility, with buyers defending dips and maintaining upward momentum. The next key resistance lies at 82,500, where breakout confirmation could trigger the next expansion leg.”
“Despite the bullish structure, Bitcoin is still sensitive to macro liquidity conditions and geopolitical risk sentiment. While risk-on flows support crypto, any sudden strengthening of the US dollar or equity risk-off shock could temporarily slow momentum. This creates a controlled bullish environment rather than a parabolic trend.”
Equities Analysis
“Which US indices are most vulnerable to rising oil prices?”
US stocks closed lower across the board on Monday as the Iran‑UAE attack spooked investors. The Dow Jones Industrial Average tumbled 1.13%, the S&P 500 dropped 0.41%, and the Nasdaq declined 0.19%. The Dow closed down 557 points, while the S&P 500 and Nasdaq also finished in the red. Defensive sectors such as utilities and consumer staples outperformed, while energy shares saw some buying on the oil spike. Rising oil costs threaten corporate margins, particularly for transportation, industrial, and consumer discretionary companies. The NAS100 traded at 27,160, the Dow at 49,006, and the S&P 500 at 27,742. Resistance for the NAS100 stands at 27,400 and 27,800, with support at 27,000 and 26,800.
Geopolitical Developments
“How does the Iran‑UAE attack affect global risk sentiment?”
Iran’s missile and drone strikes against the UAE’s Fujairah petroleum zone have fundamentally changed the risk calculus. The attack marks the first major breach of the US‑Iran ceasefire established on 8 April and signals that the war is far from over. The UAE reported its air defences intercepted 15 missiles and four drones, but a “large fire” broke out at an oil refinery, injuring three Indian nationals. Meanwhile, the US Navy has launched “Project Freedom” to guide foreign ships out of the blocked Strait of Hormuz, with President Trump warning that “Iran would be blown off the face of the earth” if it attacks US vessels. These developments have increased volatility, boosted the US dollar, and kept oil prices elevated.
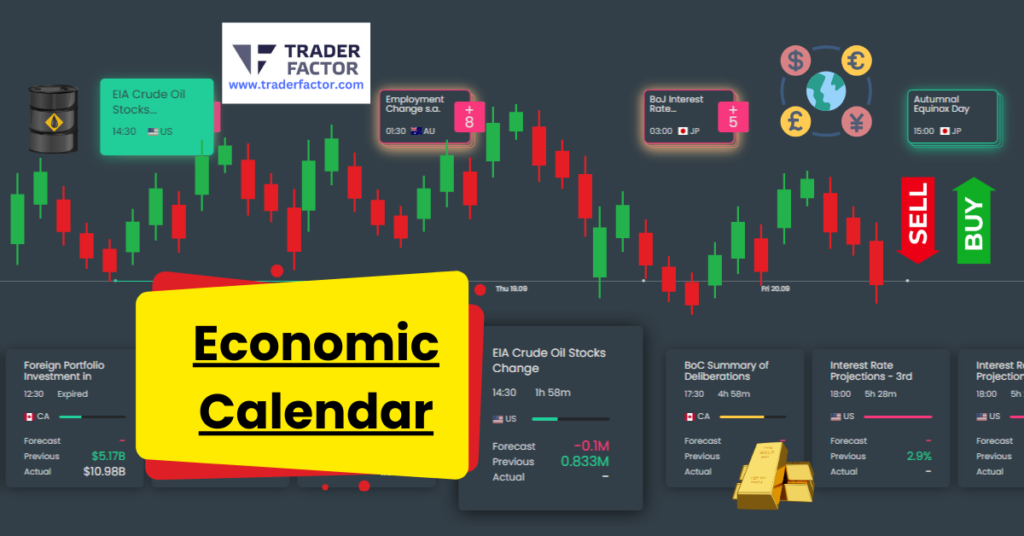
Economic Calendar & Key Events
“What economic data should traders watch this week?”
Use this robust economic calendar, providing live and future data on over 1,000 economic events from 55 countries.
The remaining calendar is packed with high‑impact data. On Tuesday, the US ISM Services PMI (14:00 GMT) and JOLTS Job Openings (14:00 GMT) will provide insights into the strength of the services sector and labour demand. JOLTS is forecast at 6.87 million, slightly down from the previous 6.882 million. On Wednesday, New Zealand employment and unemployment reports will directly impact NZD, while Fed officials – including New York Fed President John Williams and St Louis Fed President Alberto Musalem – are due to speak. Traders will watch for any hints on the path of interest rates given the renewed inflation threat from higher oil prices. Strong US data would reinforce the dollar’s strength, while soft prints could trigger a relief rally in equities and gold.
Final outlook on Middle East Tensions Impact on Markets
Markets are in a high‑volatility phase driven by three converging forces: Middle East conflict, central bank actions, and a heavy economic calendar. The RBA’s rate hike to 4.35% has failed to lift the Australian dollar due to risk‑off sentiment; the yen remains on intervention watch near 160; oil is bid above $100 on supply fears; and gold has lost its safe‑haven lustre amid dollar strength. The next potential catalysts are US JOLTS data, FOMC speeches, and New Zealand employment figures. Traders should respect the support and resistance levels in the table and prepare for swift reversals as headlines evolve.
Gain a competitive edge in your trading journey!
About the Author
Zahari Rangelov
Head of Business Development, TraderFactor
Zahari specializes in broker analysis, regulatory research, and trading education. He has over a decade of experience helping traders navigate the complex world of online brokers. His expertise spans technical and fundamental analysis, medium-term trading strategies, risk management, and trading psychology. A respected mentor and speaker, Zahari regularly leads webinars and seminars covering market sentiment, speculative instruments, and automated trading systems. His research-backed, practical approach has established him as a trusted authority within the global trading community.
Reviewed By:
Reviewed by Alex Kanyi, Head of Compliance at TraderFactor
“This report is for general information only. Trading involves significant risk. Seek independent advice before acting on any content.”
All information has been prepared by TraderFactor or partners. The information does not contain a record of TraderFactor or partner’s prices or an offer of or solicitation for a transaction in any financial instrument. No representation or warranty is given as to the accuracy or completeness of this information. Any material provided does not have regard to the specific investment objective and financial situation of any person who may read it. Past performance is not a reliable indicator of future performance.