

Oil prices jump above $106per barrel amid Iran tensions and supply disruption fears. Gold holds near 4550 as USD strengthens. Full forex and market analysis with key levels.
⚡ Key Takeaways – Oil Surge & Market Impact
- ➡️ Oil surges above $106 – Iran tensions and Strait of Hormuz supply fears drive WTI higher.
- ➡️ Gold holds near $4,550 – safe‑haven demand supports prices despite a strong US dollar.
- ➡️ Dollar strengthens (DXY near 99) – rising oil fuels inflation expectations, boosting the greenback.
- ➡️ Forex: USDJPY bullish near 160, EURUSD under pressure, USDCAD range‑bound despite high oil.
- ➡️ Bitcoin at $75,442 – resilient, acting as alternative hedge; key support $74,500, resistance $77,000.
- ➡️ Equities pressured – rising costs and inflation fears weigh on NAS100 and S&P 500.
- ➡️ Key events ahead – US GDP, Core PCE, BOE/ECB speeches; oil remains the main inflation driver.
- ➡️ Outlook: volatile, headline‑driven; trade using S1/S2/R1/R2 levels and wait for confirmation.
Oil Prices Advance on Geopolitical Uncertainty and Supply Disruption Fears
TraderFactor Market Report | Week of April 30, 2026
Global markets are being driven by geopolitical escalation and energy supply risks, with oil prices surging above 106. Oil is rallying on Iran conflict headlines, the US dollar is strengthening (DXY near 99), gold is holding near 4550 as a safe haven, and equities are under pressure due to rising costs. The key driver is oil → inflation → central banks → market direction.
“What is driving the market today?”
Oil prices are rising due to escalating geopolitical tensions involving Iran and fears of supply disruptions in key global routes like the Strait of Hormuz. This is increasing inflation risks, supporting the US dollar, pressuring equities, and keeping gold supported as a safe haven.
Traders are reacting to fresh headlines about Iran blockade threats and potential military escalation, which have reintroduced a significant risk premium into crude oil. Higher oil feeds directly into inflation expectations, which in turn forces central banks to reconsider rate cut timelines. As a result, the dollar is gaining, stocks are falling, and gold is holding steady as a hedge.
Support & Resistance Summary Table
| Asset | S2 | S1 | R1 | R2 |
|---|---|---|---|---|
| Gold (XAUUSD) | 4480 | 4520 | 4600 | 4680 |
| WTI Crude Oil | 100.00 | 103.00 | 110.00 | 120.00 |
| EURUSD | 1.1600 | 1.1640 | 1.1700 | 1.1750 |
| USDJPY | 159.50 | 160.00 | 161.50 | 163.00 |
| GBPUSD | 1.3400 | 1.3450 | 1.3550 | 1.3600 |
| AUDUSD | 0.7050 | 0.7100 | 0.7200 | 0.7250 |
| NZDUSD | 0.5800 | 0.5820 | 0.5900 | 0.5950 |
| USDCAD | 1.3600 | 1.3650 | 1.3750 | 1.3800 |
| USDCHF | 0.7850 | 0.7900 | 0.8000 | 0.8050 |
| NAS100 | 26,800 | 27,000 | 27,600 | 28,000 |
| S&P 500 | 7,000 | 7,100 | 7,300 | 7,400 |
| US30 (Dow) | 48,000 | 48,500 | 49,500 | 50,500 |
How to use this table: S2 and S1 are key downside levels; a break below S2 signals trend weakness. R1 and R2 are upside obstacles; a break above R2 confirms strong momentum.
Oil Analysis (WTI Crude)
“Why is oil surging above $106 per barrel?”
Oil prices are rising due to Iran‑related geopolitical tensions and fears of supply disruptions, with bullish momentum likely to continue if risks escalate.
Oil markets are reacting sharply to Iran blockade threats, potential military escalation, and supply chain disruptions. Reports of oil potentially moving toward $120 highlight how sensitive markets are to geopolitical risk. As long as the Strait of Hormuz remains under threat, buyers will remain aggressive, and any dip is likely to be shallow.
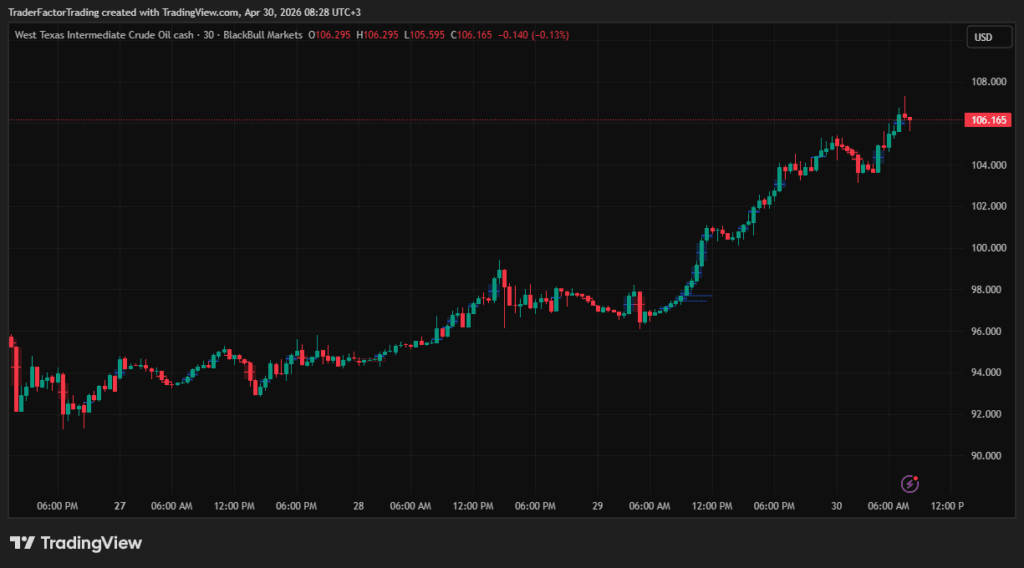
Key Levels
- Support: 103.00 / 100.00
- Resistance: 110.00 / 120.00
Technical Outlook
- Price remains in a strong uptrend, with higher highs and higher lows
- Momentum is bullish, but the market is approaching overbought conditions
- A break above 110 could trigger continuation toward 120
- A pullback toward 103–100 may offer buy opportunities if support holds
Trend remains bullish, but watch for short-term corrections before continuation.
Gold Analysis (XAUUSD)
“Why is gold holding near 4550 despite a strong dollar?”
Gold is supported by geopolitical uncertainty as a safe haven, which offsets the headwind from a stronger US dollar.
The metal has found a floor near 4520–4550, but upside is limited because a strong dollar and rising yields (due to inflation fears) cap demand. If oil continues its rally and inflation expectations spike, gold could break above 4600. Conversely, a diplomatic breakthrough would send gold lower toward 4480. But note that a strong dollar is threatening gold’s position as a safe haven.
Currencies Analysis (Forex Market)
“Which forex pairs are moving most as oil surges?”
The US dollar is strengthening as rising oil prices increase inflation concerns, keeping pressure on major currency pairs while USDJPY remains bullish.
Below is the detailed breakdown for each major pair.
EURUSD
“Is the euro about to break below 1.1640?”
EURUSD is under pressure from a strong dollar and softer Eurozone inflation, with support at 1.1640 and resistance at 1.1700.
The pair has been grinding lower as the dollar benefits from safe‑haven flows and higher oil prices. If the US GDP or Core PCE data surprises to the upside, EURUSD could test 1.1600. A dovish ECB press conference would add further downside pressure.
USDJPY
“Why is USDJPY still climbing toward 163?”
The Bank of Japan’s ultra‑loose policy creates a persistent yield advantage for the dollar, keeping USDJPY bullish even as oil prices rise.
The pair is trading above 160 and shows no signs of reversing. Japanese authorities have not intervened, and unless the BOJ changes its tone, any dip is a buying opportunity. The next target is 161.50, then 163.00.
GBPUSD
“Can the pound hold above 1.3450?”
GBPUSD is under pressure from a strong dollar and the Bank of England’s expected hold at 3.75%, which offers no support to the pound.
The pair has broken below 1.3500 and is testing the 1.3450 support. If the BOE sounds dovish or hints at future cuts, cable could drop to 1.3400 or lower. Strong resistance remains at 1.3550.
AUDUSD
“Why is the Australian dollar weak?”
AUDUSD is being pressured by a strong US dollar and weaker commodity prices outside of oil, with the pair trading near 0.7100.
Even though oil is rallying, the Aussie is not benefiting because the RBA is expected to cut rates later this year. The 0.7100 support is key; a break below could accelerate toward 0.7050.
NZDUSD
“Why is the kiwi underperforming?”
NZDUSD is trading near 0.5820, pressured by a strong dollar and a dovish RBNZ outlook compared to the Fed.
The pair is stuck in a downtrend, with resistance at 0.5900. Unless global risk sentiment improves sharply, NZDUSD is likely to test 0.5800 support.
USDCAD
“Will stronger oil finally push USDCAD lower?”
USDCAD is trading near 1.3650, caught between rising oil prices (CAD‑positive) and broad dollar strength, which has so far prevented a breakdown.
Even with WTI above 106, the pair has refused to break below 1.3600 because the Bank of Canada is expected to hold rates steady and may even hint at future cuts. For a sustained move lower toward 1.3550, we would need oil to hold above 106 and a clear dovish signal from the Fed. Otherwise, USDCAD is likely to remain in a 1.3600–1.3750 range.
USDCHF
“Is the Swiss franc losing its safe‑haven appeal?”
USDCHF has climbed to 0.7900 as the dollar benefits from higher yields and safe‑haven flows, while the franc is weighed down by SNB’s tolerance of a weaker currency.
The pair is approaching resistance at 0.8000. A break above would signal a major dollar shift and could accelerate toward 0.8050–0.8100. For now, the uptrend remains intact.
Equities Analysis
“Why are US stocks under pressure as oil surges?”
Equities are falling because rising oil prices increase costs for businesses, fuel inflation fears, and reduce investor risk appetite.
The NAS100 is holding near 27,000, but upside momentum is limited. Higher oil directly impacts transportation, industrial, and consumer discretionary sectors. If oil continues toward 110, earnings expectations could be revised lower, pushing indices toward their S2 levels: NAS100 26,800, S&P 500 7,000.
Bitcoin Analysis (BTCUSD)
“Why is Bitcoin holding near 75,500 despite market volatility?”
Bitcoin is trading at 75,442, showing resilience as it benefits from safe‑haven flows and institutional demand, even while traditional risk assets like equities struggle.
The cryptocurrency has decoupled slightly from the broader risk‑off sentiment, as some investors view BTC as a hedge against both inflation and geopolitical uncertainty. With oil prices surging and the US dollar strong, Bitcoin has managed to hold above the key 75,000 support. A break above 77,000 would target 78,500, while failure to hold 74,500 could see a pullback to 73,000. For now, the market is in a consolidation phase, awaiting fresh catalysts from central bank meetings.
Key Levels for BTCUSD
| S2 | S1 | R1 | R2 |
|---|---|---|---|
| 73,000 | 74,500 | 77,000 | 78,500 |
Geopolitical Developments
“How are US‑Iran tensions affecting oil and markets?”
Escalating tensions between the US and Iran are driving oil prices higher, increasing inflation risks, supporting the US dollar, and pressuring equities.
Key headlines include Trump warning Iran amid stalled talks, oil jumping on potential military action, reports of an extended blockade pushing oil higher, and Iran threatening response to US actions. The market reaction is clear: oil sharply up, USD up, gold supported, equities down.
Economic Calendar (Key Events)
“What economic data will move markets today?”
Key data including Weekly jobless claims, US GDP and Core PCE will influence the US dollar, while central bank statements from the ECB and BOE may drive volatility in EUR and GBP.
Key events: Eurozone Core CPI (impacts EUR), BOE Policy Statement (rate expected at 3.75%, impacts GBP), Canada GDP m/m (impacts CAD), US GDP q/q (major USD driver), Core PCE Price Index (key inflation metric), and ECB Press Conference (EUR volatility). Inflation remains the central theme — driven heavily by rising oil prices.
Final Outlook
Oil prices are driving global markets as geopolitical tensions increase supply risks and inflation expectations. This is strengthening the US dollar, supporting gold, and putting pressure on equities, with volatility expected to remain elevated.
What to watch next:
- Any diplomatic breakthrough (would reverse oil rally)
- US GDP and PCE data (could amplify dollar strength)
- Central bank signals from BOE and ECB
Use the support/resistance summary table above for entries and exits. Avoid chasing breakouts without confirmation, as headlines can reverse sentiment quickly.
About the Author
Zahari Rangelov
Head of Business Development, TraderFactor
Zahari specializes in broker analysis, regulatory research, and trading education. He has over a decade of experience helping traders navigate the complex world of online brokers. His expertise spans technical and fundamental analysis, medium-term trading strategies, risk management, and trading psychology. A respected mentor and speaker, Zahari regularly leads webinars and seminars covering market sentiment, speculative instruments, and automated trading systems. His research-backed, practical approach has established him as a trusted authority within the global trading community.
Reviewed By:
Reviewed by Alex Kanyi, Head of Compliance at TraderFactor
“This report is for general information only. Trading involves significant risk. Seek independent advice before acting on any content.”
[Subscribe to the TraderFactor Newsletter]
Last Updated: April 2026
Disclaimer:
All information has been prepared by TraderFactor or partners. The information does not contain a record of TraderFactor or partner’s prices or an offer of or solicitation for a transaction in any financial instrument. No representation or warranty is given as to the accuracy or completeness of this information. Any material provided does not have regard to the specific investment objective and financial situation of any person who may read it. Past performance is not a reliable indicator of future performance.