Financial markets faced a tumultuous week, driven by escalating geopolitical and economic tensions. The combination of a disappointing market response to JOLTS and NFP data, Federal Reserve Chair Jerome Powell’s cautionary outlook, and newly imposed tariffs drastically intensified negative investor sentiment. The Nasdaq, S&P 500, and Dow Jones Industrial Average all experienced significant losses, leaving many uncertain about the future. Analysts voiced concerns about a looming recession, while traders reacted sharply. Despite minor boosts from employment data, the market trends underscore deep unease about global trade dynamics, inflation risks, and reduced corporate earnings expectations.
Table of Contents
ToggleMajor Index Performance
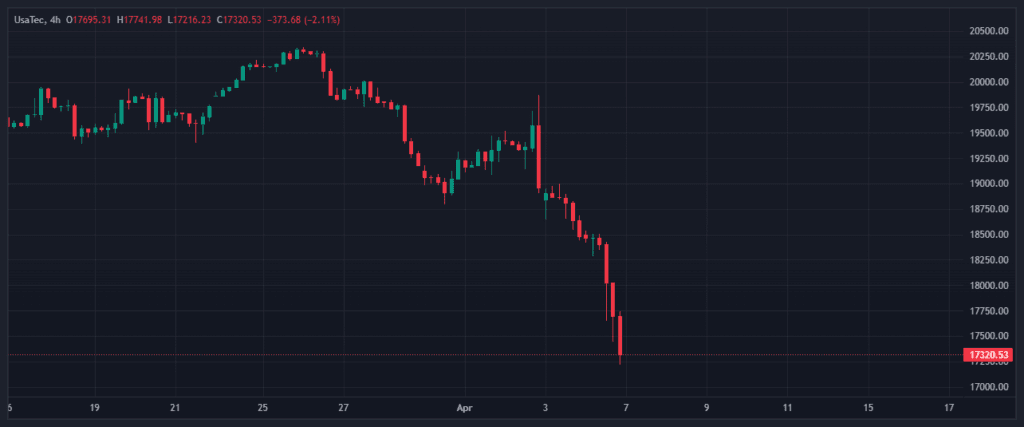
Nasdaq Plunges Into Bear Market
The Nasdaq’s 10% weekly decline underscores the vulnerability of technology stocks in the current economic environment. Among the key drivers was President Trump’s announcement of sweeping tariffs, which directly impacted companies reliant on global supply chains. Tech giants such as Nvidia, Apple, and Microsoft suffered significant losses, reflecting investor concerns about increased production costs and disrupted supply chains. The retaliatory tariffs from China amplified fears of slower earnings growth, further eroding confidence in the index. While a strong labor market could have been a stabilizing factor, it was overshadowed by trade tensions and inflation concerns.
On the charts, the Nasdaq broke below critical support levels, signaling bearish momentum. The index is now firmly in bear market territory, having declined over 20% since its peak in December. The Relative Strength Index (RSI) indicated oversold conditions, reflecting the steep downward pressure. Moving averages point to a strong downtrend, with the 50-day moving average crossing below the 200-day moving average earlier this week, forming a death cross. Trading volume spiked during the sell-off, signifying panic selling and further downside risks.

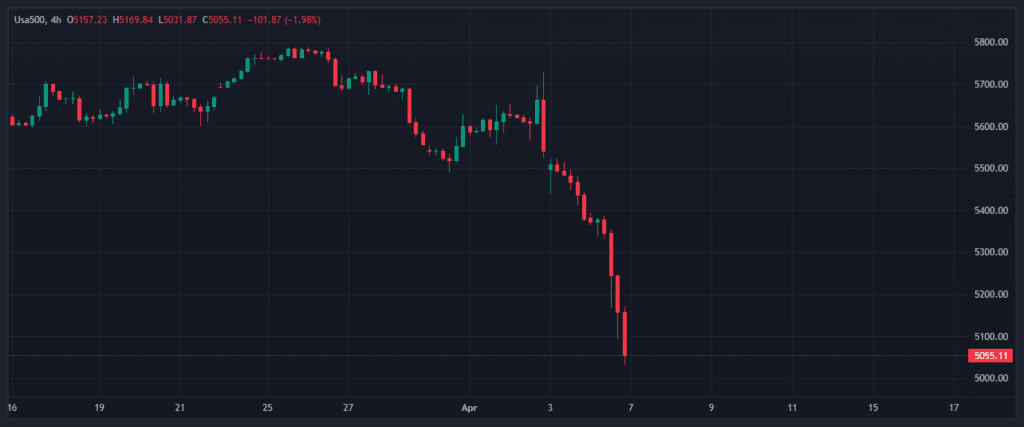
S&P 500 Hits Two-Year Low
The S&P 500 wrapped up its worst weekly decline since March 2020, finishing at 5,074.08. The 9.1% weekly drop marked heightened volatility and widespread losses across sectors. While robust job growth temporarily steadied markets, mounting fears about higher inflation and slower global trade reversed gains. Tech, energy, and industrials were particularly hit, alongside consumer discretionary stocks. Falling Treasury yields reflected investors rushing to safe assets. Gold prices temporarily surged, later retracting near the session’s close.
From a technical perspective, the S&P 500 closed near its two-year low of 5,074.08. Breaking below the 5,200 mark triggered further selling, as it was a key psychological support level. The RSI dropped below 30, indicating oversold conditions. The MACD reads firmly in negative territory, with widening divergence, signaling continued bearish pressure. The index sliced through its 200-day moving average mid-week, confirming a long-term downtrend. Immediate support is expected around 5,000, with resistance near 5,300. Continued pressure below 5,000 could test pre-pandemic levels.

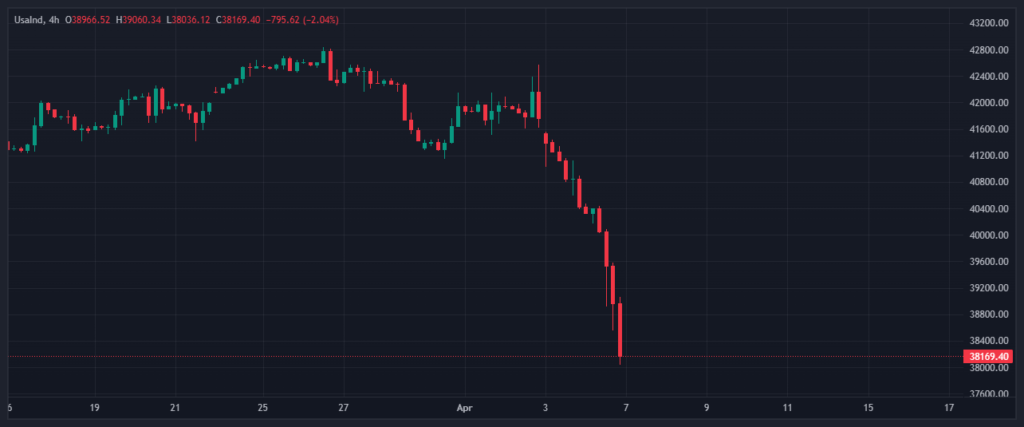
Dow Jones Faces Steep Losses
The Dow Jones Industrial Average logged a 7.9% weekly drop, closing at 38,314.86. Friday alone saw a loss of 2,231 points, representing one of the index’s sharpest single-day declines in recent years. Defensive sectors like healthcare and utilities could not shield the Dow from widespread instability. Trade-sensitive corporations, including Boeing and Caterpillar, posted the largest losses. This performance leaves the Dow in correction territory for the first time since 2022, down 10% from its December highs.
Technically, the Dow entered correction territory, dropping more than 10% from its December peak to close at 38,314.86. A critical 38,500 support level was breached during Friday’s session, leading to further selling pressure. The RSI fell to levels indicating oversold conditions below 30. The technical structure is weakening, as the index forms lower highs and lower lows, confirming a downward trend. The Fibonacci retracement suggests the next support level at 37,800, while resistance stands at 39,500. Further breaches below these levels could lead to extended downside risks.

Macroeconomic Drivers
The Tariff Fallout Intensifies
President Donald Trump’s tariff announcement late Wednesday sent markets into a downward spiral. The U.S. imposed new rates on major trading partners, including China, triggering retaliatory moves. China escalated the trade war by imposing 34% tariffs on all U.S. imports. The move further stoked anxieties about inflationary pressures and diminished global trade flows, adding to recession fears. China’s measures signal prolonged tensions, which are expected to weigh on consumer pricing and industrial production worldwide.
Powell’s Warnings Add to Market Worries
Federal Reserve Chair Jerome Powell’s comments on Friday reiterated the risks inherent in the current fiscal policy. He emphasized that tariffs may exacerbate inflation while endangering overall economic growth. These statements pushed bonds higher but left equities under significant pressure. Investors heeded Powell’s cautious tone, interpreting it as further evidence that monetary policy adjustments may not keep up with macroeconomic headwinds.
Outlook and Final Thoughts
This week’s performance across U.S. markets signals a pivotal moment. Investor confidence remains shaken amid rising global uncertainties and fears of slower growth. While employment data showed promise, its influence was overshadowed by escalating trade dynamics and inflation risks. Moving forward, market stability will hinge on policy adjustments and resolutions to trade disputes. A cautious approach to risk sentiment is warranted.
Disclaimer:
All information has been prepared by TraderFactor or partners. The information does not contain a record of TraderFactor or partner’s prices or an offer of or solicitation for a transaction in any financial instrument. No representation or warranty is given as to the accuracy or completeness of this information. Any material provided does not have regard to the specific investment objective and financial situation of any person who may read it. Past performance is not a reliable indicator of future performance


