USD/JPY
The yen has been significantly under pressure with USD/JPY staring at new highs as it continues on an ascending trend, making higher highs.
It seems prepared to surpass the 24-year high reached last week.
With the price crossing back above the 10-day SMA, the bullish momentum might gain further traction.
The price must be above the short term SMA, the latter must be above the medium term SMA, and the medium term SMA must be above the long term SMA in order for a Triple Moving Average (TMA) formation to occur.
Additionally, there must be a rising trend throughout all SMAs.
So, if three of the 10-, 21-, 55-, 100-, or 260-day SMAs are checked, the requirements for a bullish triple rolling average have already been satisfied.
Between 131.25 and 131.35, where there are two break points and an ascending trend line, could be a support zone.
The 55-day SMA, which is currently at 130.65 and runs parallel to the trend line, may also act as support.
136.71, which was the peak recently, may serve as resistance.

EUR/JPY
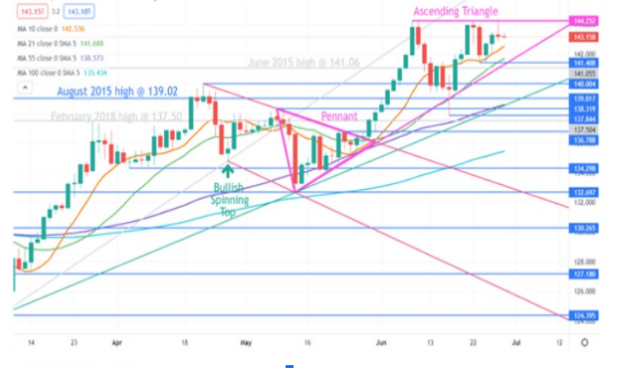
After breaking the topside of a Pennant formation in the previous month, EUR/JPY has kept moving upward.
It previously reached a 7-year high of 144.25 and has occasionally presented difficulties to hold at that level.
The bullish momentum for the EUR/JPY may be following a similar course to that of the USD/JPY. When the 10-, 21-, 55-, and 100-day Simple
Moving Averages are checked, it is obvious that the conditions for a Triple Moving Average (TMA) formation have been met.
An ascending triangle, which has a rising lower trendline and horizontal line, is a continuation pattern of a bullish or bearish market.
The pattern shows that sellers are less successful in their efforts to drive prices lower each time, which is the basic interpretation of the pattern.
Eventually, the upside resistance allows the price to exit the triangle, continuing its upward trajectory.
For the EUR/JPY, an ascending triangle is clearly apparent, and a topside breakout is anticipated to take place.
The recent low and rising trend line, which are currently situated at 141.41, may provide support on the downside.

Disclaimer:
All information has been prepared by TraderFactor or partners. The information does not contain a record of TraderFactor or partner’s prices or an offer of or solicitation for a transaction in any financial instrument. No representation or warranty is given as to the accuracy or completeness of this information. Any material provided does not have regard to the specific investment objective and financial situation of any person who may read it. Past performance is not a reliable indicator of future performance.


