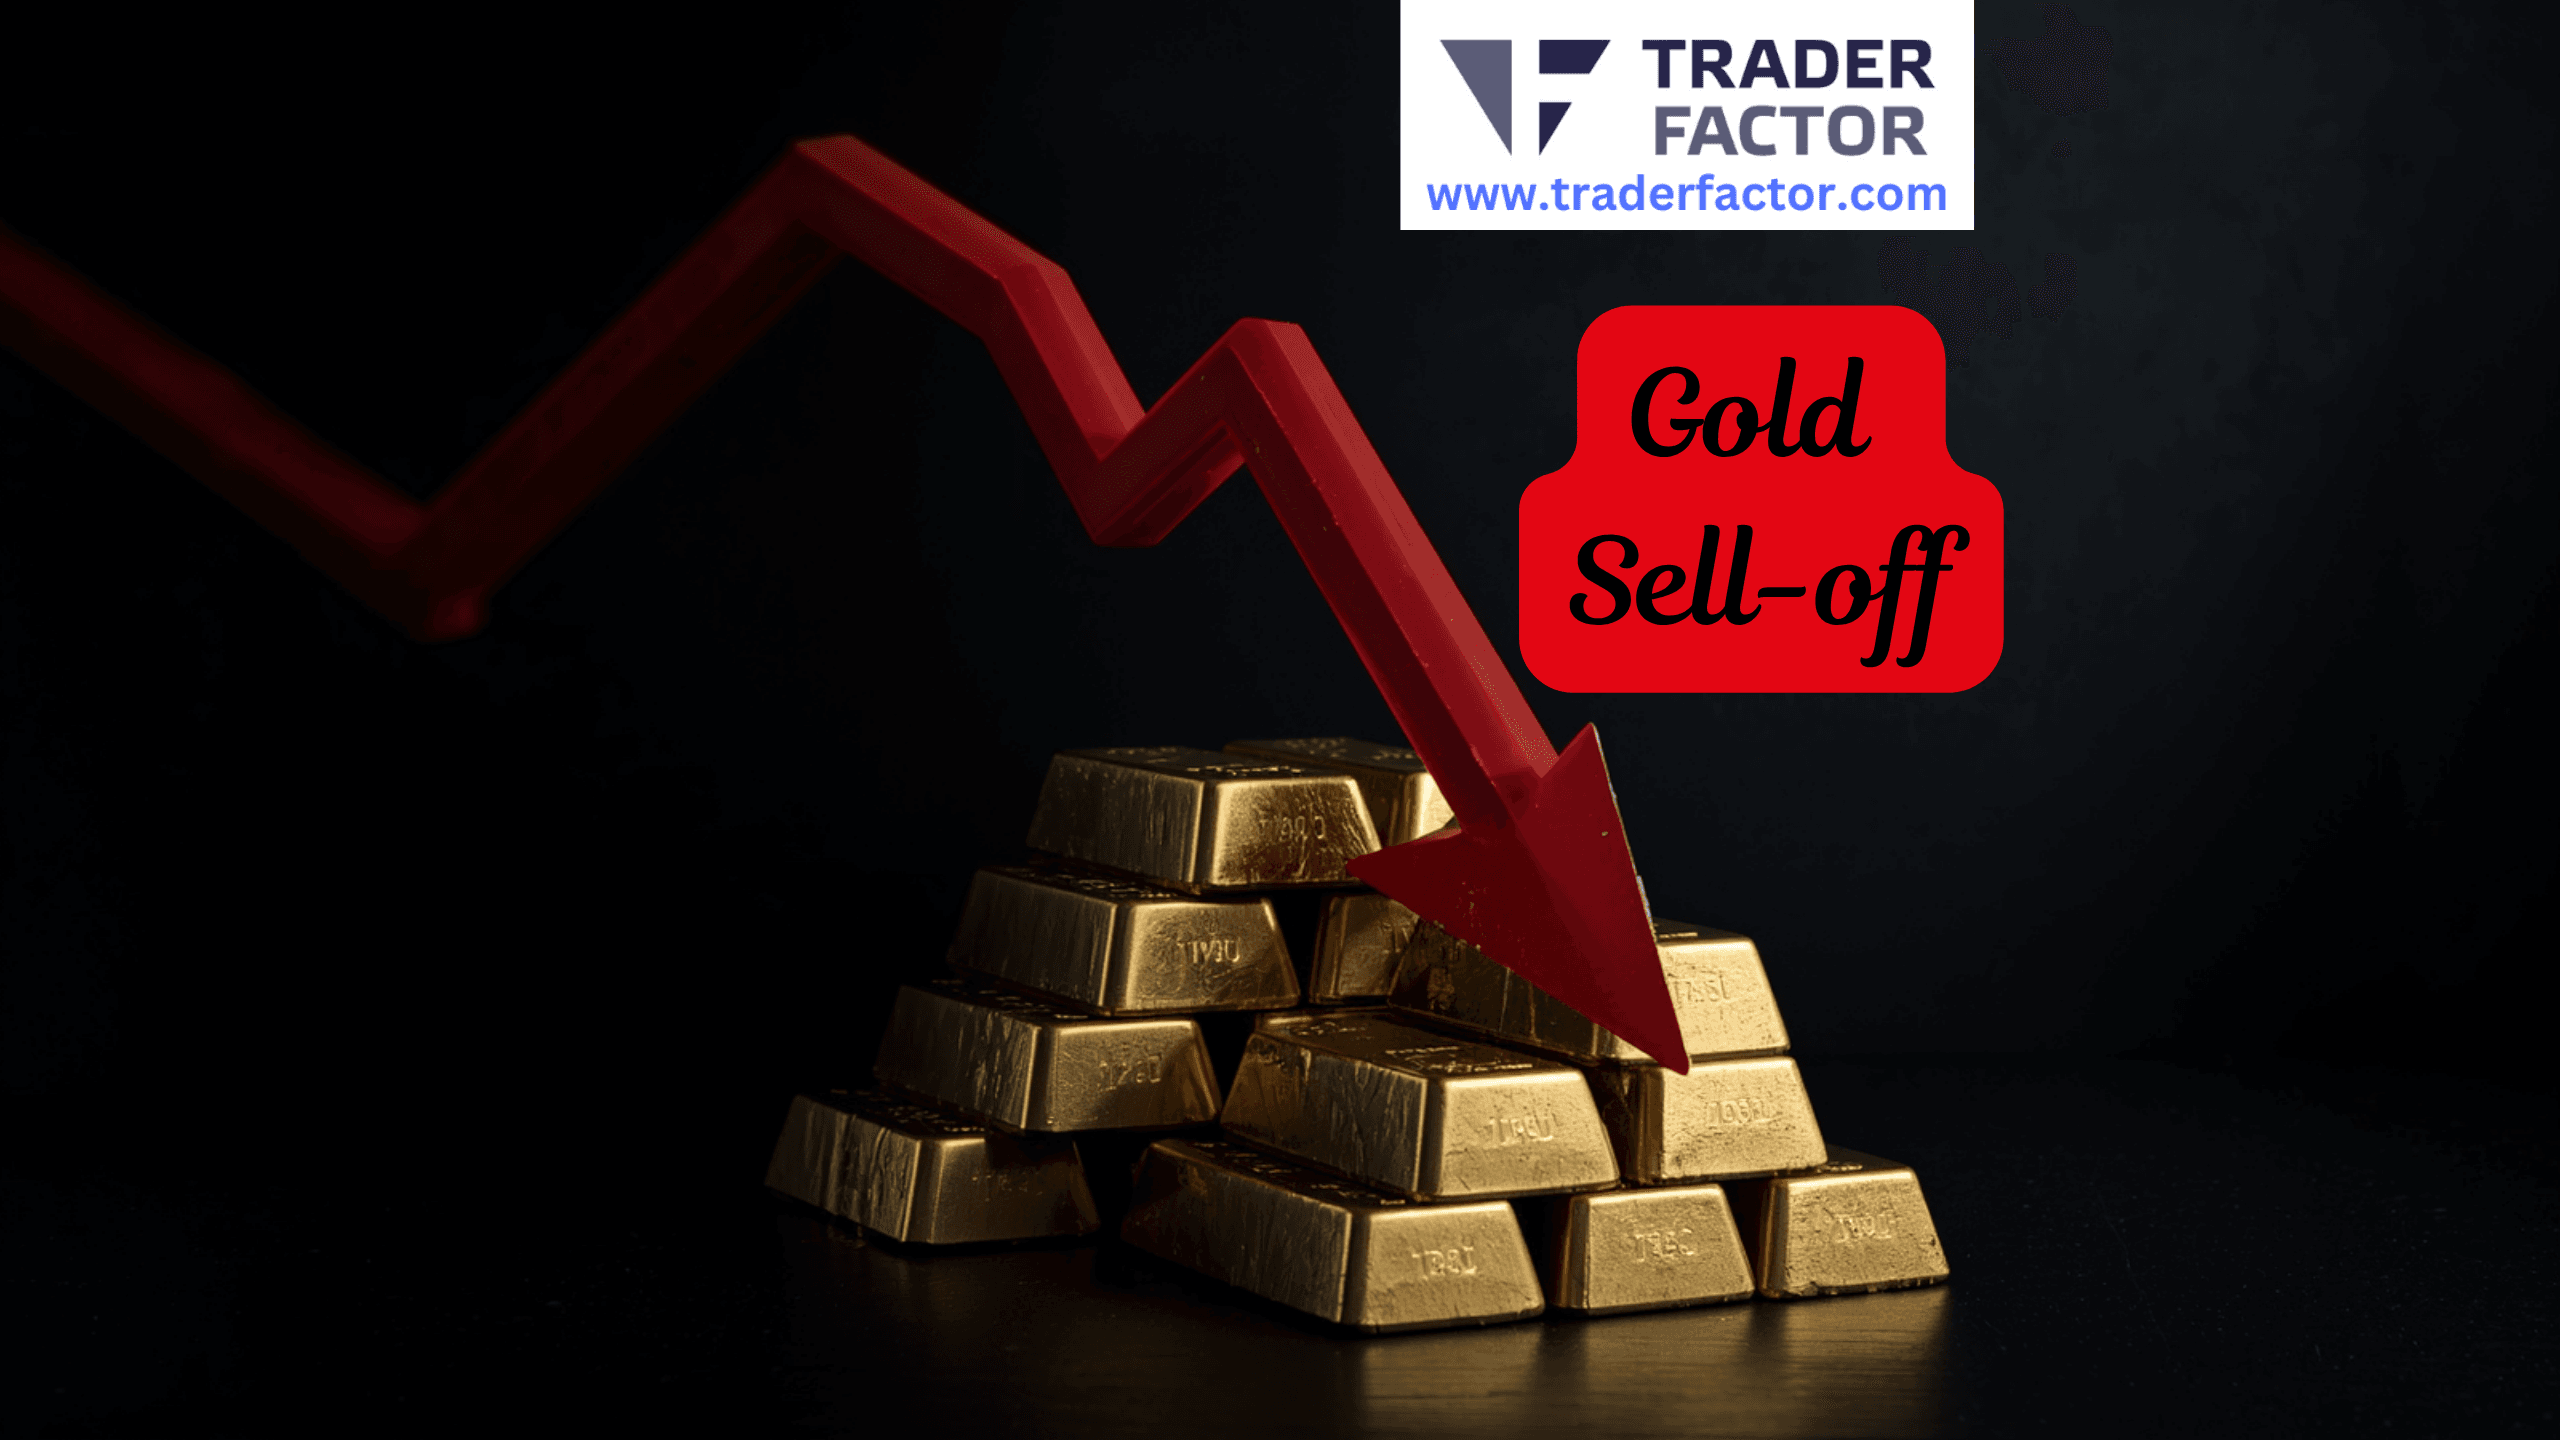

Gold price tumbles to $4,650 as hawkish Fed, hot PPI, and a strong dollar spark a three-week selloff. All eyes on Powell’s Saturday speech for the next move.
Gold Selloff Intensifies: 3-Week Bear Run Pushes Prices to $4,650, Powell Speech Next
By Zahari Rangelov – Published: March 20, 2026 | Updated:
Gold has been on a relentless downward slide for three weeks, accelerating in recent sessions to hit $4,650 a level not seen since early February.
The precious metal is now down more than 10% from its recent peak above $5,200, erasing months of gains as the market reprices expectations for US monetary policy and reassesses geopolitical risks.
The selloff intensified this week, with gold breaking through key psychological and technical levels. The $4,800 support, which had held since mid-February, gave way on Wednesday, triggering a cascade of stop-loss orders and pushing prices toward $4,650.
Table of Contents
ToggleKey Takeaways
- Gold tumbled to $4,650, marking a three-week low and accelerating a bearish trend.
- This week’s catalysts: Hawkish FOMC hold and a slightly hotter PPI reinforced dollar strength.
- Technical breakdown: Gold broke key support at $4,800, opening the door to $4,600.
- Market sentiment has shifted: Safe-haven flows have reversed as traders embrace risk assets.
- Next catalyst: Fed Chair Powell speaks Saturday—any hints of rate cuts could spark a reversal.
📅 Last verified: March 20, 2026
From Record Highs to Three-Week Lows. What’s Driving Gold Price Lower?
1. Stronger US Dollar
The US Dollar Index (DXY) has climbed to 99.90, its highest level since January. A stronger dollar makes gold more expensive for holders of other currencies, reducing demand.
2. Hawkish Federal Reserve & PPI Data
This week’s FOMC meeting delivered a hawkish hold. While rates remained at 3.75%, the dot plot still signals one potential rate cut in 2026, and Chair Powell emphasized that surging energy prices from the Iran war have made the inflation outlook “highly uncertain.” Markets interpreted the tone as hawkish, pushing Treasury yields higher.
Compounding this, Tuesday’s PPI report came in slightly hotter than expected (0.4% vs 0.3% forecast), reinforcing fears that inflation remains sticky. Together, these developments strengthened the dollar and weighed on gold.
3. Easing Geopolitical Risk Premium
The Iran war continues, but markets appear to have priced in much of the risk. No major escalation in recent days has allowed the geopolitical risk premium in gold to fade. Safe-haven flows have rotated into the US dollar instead.
4. Profit-Taking and Technical Selling
After gold’s strong rally earlier this year, long positions have become crowded. The breakdown through key support levels triggered algorithmic selling, amplifying the downside.
Technical Analysis: Key Levels Breached
| Indicator | Current Status |
|---|---|
| Price | $4,650 |
| Immediate Support | $4,600 / $4,550 |
| Major Support | $4,500 |
| Resistance | $4,800 / $4,900 |
| 50-Day SMA | $4,920 (now resistance) |
| 200-Day SMA | $4,350 |
| RSI (14) | 32 – approaching oversold territory |
| MACD | Bearish crossover, below signal line |
The daily chart shows gold breaking below the 50-day simple moving average ($4,920) and the key psychological $4,800 level. The next major support lies at $4,600, followed by $4,500.
The Relative Strength Index (RSI) has dropped to 32, nearing oversold levels, which could attract dip buyers. However, momentum remains firmly to the downside, and any bounce is likely to face selling pressure near $4,800.
Market Sentiment: Risk-On Returns
The shift in sentiment is evident across asset classes:
- US stocks are rallying, with the S&P 500 trading near 6,700.
- Bitcoin is holding above $70,000.
- Safe-haven flows have moved to the US dollar, which is trading at multi-month highs.
Investors are betting that the Fed will maintain higher rates for longer, supporting the dollar and weighing on non-yielding assets like gold.
Next Catalyst: Powell Speaks Saturday
All eyes now turn to Fed Chair Jerome Powell, who is scheduled to speak on Saturday, March 21. His remarks will be the first public comments since the FOMC meeting earlier this week.
Markets will parse his words for:
- Any softening of the hawkish tone
- Further clarity on the timing of potential rate cuts
- Acknowledgment of slowing growth or geopolitical risks
A dovish lean could trigger a sharp gold rebound toward $4,800. A reiteration of the hawkish stance would likely extend the selloff toward $4,600 or lower.
What to Watch Next
| Event | Date | Potential Impact |
|---|---|---|
| Fed Chair Powell Speech | Saturday, March 21 | High – could reverse or extend the selloff |
| Geopolitical Headlines | Any day | Escalation in Iran war could quickly reverse the trend |
| Gold ETF Flows | Daily | Continued outflows would signal persistent bearish sentiment |
| US Dollar Strength | Ongoing | A pullback in DXY could spark a gold bounce |
Trader’s Outlook
| Scenario | Likely Reaction |
|---|---|
| Powell hawkish (no cuts soon) | Gold tests $4,600, possibly $4,500 |
| Powell dovish (cuts in sight) | Gold bounces toward $4,800 |
| Geopolitical escalation | Safe-haven flows return, gold spikes above $4,800 |
| Oversold bounce | Short-term rebound to $4,750, but selling pressure likely |
Key Levels to Watch
| Level | Price |
|---|---|
| Current Price | $4,650 |
| Support | $4,600 / $4,550 / $4,500 |
| Resistance | $4,800 / $4,900 / $5,000 |
| 50-Day SMA | $4,920 |
| 200-Day SMA | $4,350 |
More Reading on TraderFactor
| Article | What You’ll Learn |
|---|---|
| [Best Time to Trade EURUSD] | Master the optimal trading hours |
| [XAUUSD Pip Value Guide] | Calculate pip values for gold |
| [Forex Spreads vs. Commissions] | Understand trading costs |
| [What Is Leverage in Forex Trading?] | Learn how to use leverage safely |
| [Best Currency Pairs for Forex Trading] | Compare pairs by volatility and spread |
About the Author
This guide was prepared by Zahari Rangelov, Head of Business Development at TraderFactor. Zahari specializes in trading strategies, market analysis, and risk management. He has over a decade of experience helping traders navigate complex financial markets.
Stay Updated
Get our latest trading guides and market analysis delivered straight to your inbox.
[Subscribe to the TraderFactor Newsletter]
Disclaimer:
All information has been prepared by TraderFactor or partners. The information does not contain a record of TraderFactor or partner’s prices or an offer of or solicitation for a transaction in any financial instrument. No representation or warranty is given as to the accuracy or completeness of this information. Any material provided does not have regard to the specific investment objective and financial situation of any person who may read it. Past performance is not a reliable indicator of future performance.