
Liquidity is one of the most important concepts in forex trading, especially for traders learning Smart Money Concepts (SMC), price action trading, and institutional trading strategies. Many beginner traders focus only on indicators while professional traders focus on liquidity, stop loss clusters, and market structure.
If you have ever wondered why price suddenly spikes above highs or below lows before reversing sharply, the answer is usually liquidity.
Understanding how to identify liquidity in forex trading can help you avoid fake breakouts, stop hunts, and poor trade entries. It also helps traders understand how smart money uses liquidity to move the market.
Gold trading offers one of the best examples of liquidity trading because XAUUSD frequently creates liquidity sweeps, stop hunts, and market manipulation during London and New York trading sessions.
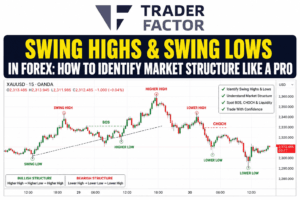
Below is a real Gold chart example showing liquidity zones, BOS, CHOCH, equal highs, and liquidity sweeps.
In this guide, you will learn:
- What liquidity means in forex trading
- How to identify liquidity zones on forex charts
- Buy side liquidity vs sell side liquidity
- How liquidity sweeps work
- How smart money hunts stop losses
- How to analyze Gold liquidity setups
- How to use liquidity with market structure

What Is Liquidity in Forex Trading?
Liquidity in forex trading refers to areas in the market where many orders are concentrated. These orders may include:
- Stop losses
- Pending buy orders
- Pending sell orders
- Breakout entries
- Institutional positions
In simple terms, liquidity is where money is sitting in the market.
Large banks and institutions cannot place massive trades randomly. They need enough opposite orders to fill positions efficiently. This is why price often moves toward areas where retail traders place stop losses.

For example:
- Traders selling Gold often place stop losses above highs
- Traders buying Gold often place stop losses below lows
These stop losses become liquidity pools.
Smart money targets these liquidity zones because they provide the order flow institutions need.
Why Liquidity Matters in Forex Trading
Liquidity trading is important because markets do not move randomly. Price usually moves from one liquidity zone to another.
Many beginner traders believe markets move because of indicators alone. In reality, institutional traders focus heavily on:
- Liquidity
- Order flow
- Market structure
- Stop hunts
- Price action
Understanding liquidity helps explain:

- Why fake breakouts happen
- Why traders get stopped out before reversals
- Why price reacts strongly at key levels
- Why equal highs and equal lows matter
- How smart money manipulates retail traders
Once traders understand liquidity, their forex chart analysis becomes much more accurate.
Types of Liquidity in Forex Trading
Buy Side Liquidity
Buy side liquidity refers to liquidity resting above highs.
This includes:
- Stop losses from sellers
- Buy stop orders
- Breakout buy entries

When price moves above resistance, swing highs, or equal highs, it often targets buy side liquidity.
Institutions may push Gold above highs temporarily to collect liquidity before reversing downward.
Sell Side Liquidity
Sell side liquidity refers to liquidity resting below lows.
This includes:
- Stop losses from buyers
- Sell stop orders
- Breakout sell entries
When price moves below support, swing lows, or equal lows, it often targets sell side liquidity.
Smart money frequently sweeps these lows before bullish reversals.
How to Identify Liquidity on Forex Charts
Learning how to identify liquidity zones is one of the most important skills in Smart Money Concepts trading.

Equal Highs
Equal highs occur when price forms multiple highs around the same level.
Retail traders often view these levels as resistance zones.
Sellers place stop losses above these highs, creating buy side liquidity.
The Gold chart below shows how price repeatedly reacted near the highs before a liquidity sweep occurred.
y=4580y=4580y=4580
This type of structure often attracts smart money manipulation.
Equal Lows
Equal lows form when price creates multiple lows at the same level.

Retail traders buying support usually place stop losses below these lows.
This creates sell side liquidity.
Institutions frequently sweep these lows before moving price upward.
Trendline Liquidity
Trendlines attract many retail traders because they appear simple and obvious.
When many traders place stop losses around trendlines, liquidity builds.
Institutions often manipulate price through trendlines to trap breakout traders.
Previous Day Highs and Lows
Previous Day Highs and Previous Day Lows are major liquidity zones.
These levels attract institutional attention because many stop losses accumulate around them.
On the Gold chart, you can see PDH and PDL levels acting as liquidity targets.

Session Highs and Lows
The London and New York trading sessions create major liquidity pools.
Most liquidity sweeps occur during:
- London Open
- New York Open
- London-New York overlap
Gold volatility increases significantly during these sessions.
Consolidation Areas
When price consolidates in a range, liquidity accumulates on both sides.
Breakout traders place pending orders above and below consolidation.

This creates liquidity pools that institutions often target before making larger directional moves.
Gold Liquidity Chart Analysis Example
The XAUUSD chart shared above provides a strong example of liquidity trading concepts in action.
Key observations include:
Equal Highs Formation
Price repeatedly formed highs near the 4580 zone, creating buy side liquidity.
Retail breakout traders expected continued bullish momentum.
Liquidity Sweep
Gold swept above the highs briefly before aggressively reversing downward.
This is a classic liquidity grab.
BOS and CHOCH
After the liquidity sweep, the market formed:
- Break of Structure (BOS)
- Change of Character (CHOCH)
These signals confirmed bearish market structure.

Sell Side Targeting
Once market structure shifted bearish, price moved toward sell side liquidity below lows.
This is how smart money often moves the market from one liquidity pool to another.
What Is a Liquidity Sweep?
A liquidity sweep occurs when price temporarily moves into a liquidity zone to trigger stop losses before reversing direction.
Liquidity sweeps are common in:
- Smart Money Concepts trading
- Institutional trading
- Gold trading
- Forex price action strategies

For example:
- Price moves above equal highs
- Breakout traders enter buys
- Sellers get stopped out
- Institutions collect liquidity
- Price reverses downward
This explains why many beginner traders feel the market targets their stop losses.
In reality, institutions seek liquidity because they need orders to execute positions.
Liquidity Sweep vs Real Breakout
One of the biggest challenges in forex chart analysis is distinguishing between a fake breakout and a genuine breakout.
Characteristics of a Liquidity Sweep
- Sharp move above highs or below lows
- Fast rejection candles
- Long wicks
- Immediate reversal
- Weak continuation

Characteristics of a Real Breakout
- Strong candle closes
- Momentum continuation
- Retests holding structure
- Sustained buying or selling pressure
Understanding the difference helps traders avoid entering traps.
How Smart Money Hunts Stop Losses
Smart money concepts focus heavily on stop hunts and liquidity grabs.
Retail traders often place stop losses in predictable areas such as:

- Above resistance
- Below support
- Above equal highs
- Below equal lows
- Around trendlines
Institutions know where these stop losses are likely located.
Before entering large trades, smart money often pushes price into these liquidity zones.
This helps institutions:
- Fill large orders
- Create momentum
- Trap retail traders
- Enter at better prices
This is why liquidity analysis is essential for SMC trading.

Combining Liquidity With Market Structure
Liquidity works best when combined with market structure analysis.
Key concepts include:
- Break of Structure (BOS)
- Change of Character (CHOCH)
- Trend direction
- Order blocks
- Premium and discount zones
A common Smart Money setup looks like this:
- Price sweeps sell side liquidity
- Market structure shifts bullish
- Price retests an order block
- Traders enter long positions
- Price targets buy side liquidity

This approach provides higher probability trading opportunities.
Best Timeframes for Identifying Liquidity
Different timeframes provide different types of liquidity information.
Higher Timeframes
The 4H and Daily charts help identify:
- Major liquidity pools
- Institutional zones
- Long term structure
Lower Timeframes
The 15M and 5M charts help traders refine entries and identify:
- Liquidity sweeps
- BOS
- CHOCH
- Entry confirmations

Many traders use top down analysis by identifying liquidity on higher timeframes and executing trades on lower timeframes.
Simple Liquidity Trading Strategy for Beginners
Here is a beginner friendly liquidity trading strategy.
Step 1: Identify Liquidity Zones
Mark:
- Equal highs
- Equal lows
- Previous day highs and lows
- Consolidation ranges

Step 2: Wait for Liquidity Sweep
Do not enter immediately.
Allow price to sweep liquidity first.
Step 3: Confirm Market Structure Shift
Look for:
- BOS
- CHOCH
- Strong rejection candles
Step 4: Enter on Retest
Wait for price to retest the zone after confirmation.
Step 5: Target Opposite Liquidity
Price often moves from one liquidity pool to another.

This creates logical take profit targets.
Common Liquidity Trading Mistakes
Chasing Breakouts
Many beginner traders buy or sell immediately after breakouts.
This often leads to getting trapped in liquidity sweeps.
Ignoring Market Structure
Liquidity works best when combined with trend direction and structure.
Trading During Low Liquidity Sessions
Low volatility periods often create weak setups and fake moves.

Placing Stop Losses in Obvious Areas
Many traders place stop losses exactly where institutions expect them.
This increases the risk of stop hunts.
How Liquidity Improves Forex Chart Analysis
Liquidity helps traders understand the true intent behind price movements.
Instead of reacting emotionally, traders begin analyzing:
- Where stop losses are located
- Where institutions may enter
- Which liquidity pools remain untapped
- Whether a breakout is likely fake or genuine

This improves:
- Trade timing
- Risk management
- Entry precision
- Overall consistency
Final Thoughts
Understanding how to identify liquidity in forex trading is essential for traders learning Smart Money Concepts, price action trading, and institutional market analysis.
Liquidity explains why price moves toward certain areas and why many retail traders get trapped during fake breakouts and stop hunts.
By learning to identify:
- Buy side liquidity
- Sell side liquidity
- Equal highs and equal lows
- Liquidity sweeps
- Market structure shifts

Traders can improve their forex chart analysis and develop a more professional trading approach.
The best traders do not simply follow indicators. They study liquidity, institutional behavior, and price action to understand where the market is likely to move next.
As you continue learning forex trading, combine liquidity concepts with:
- Market structure
- Order blocks
- Support and resistance
- Trading psychology
- Risk management
This combination can help beginner traders build a more disciplined and consistent trading strategy.
Frequently Asked Questions

What is liquidity in forex trading?
Liquidity in forex trading refers to areas where many market orders and stop losses are concentrated.
What is a liquidity sweep?
A liquidity sweep occurs when price temporarily moves into a liquidity zone to trigger stop losses before reversing direction.
What is buy side liquidity?
Buy side liquidity refers to stop losses and pending buy orders resting above highs.

What is sell side liquidity?
Sell side liquidity refers to stop losses and pending sell orders resting below lows.
Why does price target liquidity?
Institutions need liquidity to execute large positions efficiently, which is why price often moves toward areas with many orders.
How do traders identify liquidity zones?
Traders identify liquidity zones by marking equal highs, equal lows, trendlines, previous highs and lows, and consolidation ranges on charts
Author Details:
Phyllis Wangui
Senior Market Analyst, TraderFactor
Phyllis Wangui is a seasoned financial markets analyst with over a decade of experience in forex and CFD brokerage evaluation. Specializing in regulatory compliance and risk assessment, she leads the TraderFactor reviews team in delivering transparent, data-driven broker breakdowns that help retail traders navigate complex offshore and Tier-1 trading environments.

Reviewed by Alex Kanyi
Head of Compliance | TraderFactor
“This report is for general information only. Trading involves significant risk. Seek independent advice before acting on any content.”
[Subscribe to the TraderFactor Newsletter]
Last Updated: May 2026
Disclaimer:
All information has been prepared by TraderFactor or partners. The information does not contain a record of TraderFactor or partner’s prices or an offer of or solicitation for a transaction in any financial instrument. No representation or warranty is given as to the accuracy or completeness of this information. Any material provided does not have regard to the specific investment objective and financial situation of any person who may read it. Past performance is not a reliable indicator of future performance.