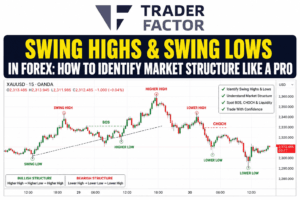

Buy Side vs Sell Side Liquidity explained through Smart Money concepts, revealing how institutions target liquidity zones to drive price movement and market direction.
Key Takeaways
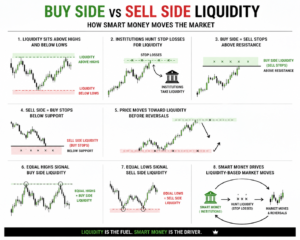
- Liquidity sits above highs and below lows
- Institutions hunt stop losses for liquidity
- Buy side equals sell stops above resistance
- Sell side equals buy stops below support
- Price moves toward liquidity before reversals
- Equal highs signal buy side liquidity
- Equal lows signal sell side liquidity
- Smart money drives liquidity-based market moves
Buy Side vs Sell Side Liquidity: How Smart Money Moves the Market
If you have been studying Smart Money Concepts (SMC), you have probably heard traders talk about buy side liquidity, sell side liquidity, liquidity sweeps, and stop hunts. These concepts are at the core of how institutional traders analyze the market.
Many beginner traders believe that markets move randomly or because of indicators. In reality, large financial institutions, banks, and hedge funds need liquidity to execute their orders. This is why price often moves toward obvious highs and lows before making its real move.
Understanding the difference between buy side liquidity and sell side liquidity can completely change the way you analyze forex charts. Instead of chasing breakouts and reacting emotionally to price movements, you begin to understand where smart money is likely targeting next.
In this guide, we will explain buy side vs sell side liquidity, how smart money uses liquidity to move the market, and how traders can identify high probability trading opportunities using liquidity concepts.
What Is Liquidity in Forex Trading?
Liquidity in forex trading refers to areas where a large number of orders are concentrated.
These orders may include:
✔ Stop losses
✔ Pending buy orders
✔ Pending sell orders
✔ Breakout entries
✔ Institutional orders
Liquidity is essentially where money is sitting in the market.
Large institutions cannot simply enter massive positions at any price. They require sufficient buying or selling interest to execute their trades efficiently. This is why price frequently moves toward areas where retail traders place their stop losses.
In Smart Money Concepts trading, liquidity is often referred to as the fuel that drives market movement.
Why Liquidity Matters in Forex Trading
Many beginner traders focus on candlestick patterns, indicators, and support and resistance levels.
Professional traders focus on something different.
They focus on where liquidity is located.
Liquidity helps explain:
- Why fake breakouts occur
- Why price often reverses after taking highs or lows
- Why traders get stopped out before the market moves in their favor
- Why certain levels attract strong market reactions
Markets rarely move in a straight line. Instead, they often move from one liquidity pool to another.
Understanding this principle can dramatically improve your forex chart analysis.
What Is Buy Side Liquidity?
Buy side liquidity refers to liquidity that exists above current market highs.
This liquidity is typically created by:
- Stop losses from traders holding sell positions
- Buy stop orders above resistance
- Breakout traders entering long positions
When price approaches a significant high, many traders expect a breakout and place buy orders above that level.
At the same time, traders holding short positions often place their stop losses above the high.
This creates a large pool of buy side liquidity.
Where Buy Side Liquidity Forms
Buy side liquidity commonly forms at:
- Equal highs
- Swing highs
- Resistance levels
- Previous Day High (PDH)
- Weekly highs
- Session highs
- Trendline resistance
These areas are highly attractive to institutional traders because they contain a large concentration of orders.
Buy Side Liquidity Example
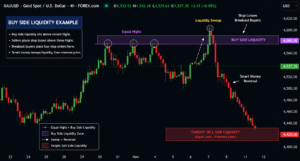
Assume Gold (XAUUSD) creates three highs around 4580.
Retail traders view this level as resistance.
Many breakout traders place buy stops above 4580 while sellers place stop losses above the same level.
This creates a significant buy side liquidity pool.
Price may temporarily break above 4580, trigger these orders, and then reverse sharply lower.
This is a classic buy side liquidity sweep.
What Is Sell Side Liquidity?
Sell side liquidity refers to liquidity that exists below current market lows.
This liquidity is usually created by:
- Stop losses from buyers
- Sell stop orders below support
- Breakout traders entering short positions
Just like buy side liquidity, these areas attract institutional traders seeking liquidity.
Where Sell Side Liquidity Forms
Sell side liquidity commonly forms at:
- Equal lows
- Swing lows
- Support levels
- Previous Day Low (PDL)
- Weekly lows
- Session lows
- Trendline support
These areas contain large concentrations of stop losses and pending sell orders.
Sell Side Liquidity Example
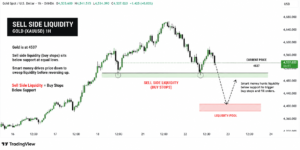
Assume Gold forms several lows around 4500.
Retail traders identify this level as support.
Many traders buy the support and place stop losses below 4500.
This creates a sell side liquidity pool.
Price may briefly drop below 4500, trigger those stops, and then reverse aggressively higher.
This is known as a sell side liquidity sweep.
Buy Side Liquidity vs Sell Side Liquidity
Understanding the difference between buy side liquidity and sell side liquidity is crucial for liquidity trading.
| Buy Side Liquidity | Sell Side Liquidity |
|---|---|
| Located above highs | Located below lows |
| Seller stop losses | Buyer stop losses |
| Buy stop orders | Sell stop orders |
| Found above resistance | Found below support |
| Often targeted before bearish moves | Often targeted before bullish moves |
| Associated with equal highs | Associated with equal lows |
Both forms of liquidity are important because smart money frequently targets them before initiating major market moves.
How Smart Money Uses Buy Side and Sell Side Liquidity
Institutions do not simply enter trades randomly.
They often use liquidity sweeps and stop hunts to create favorable entry conditions.
The process usually follows these steps:
- Identify where retail traders are positioned
- Move price toward liquidity
- Trigger stop losses and breakout orders
- Fill institutional positions
- Reverse or continue the market
This is why traders often feel the market is deliberately targeting their stops.
From an institutional perspective, those stop losses provide the liquidity needed to execute large orders.
Understanding Liquidity Sweeps
A liquidity sweep occurs when price temporarily moves into a liquidity zone before reversing.
Liquidity sweeps are among the most common smart money concepts.
Buy Side Liquidity Sweep
A buy side liquidity sweep occurs when:
- Price moves above highs
- Seller stop losses are triggered
- Breakout buyers enter
- Institutions sell into that liquidity
- Price reverses lower
Sell Side Liquidity Sweep
A sell side liquidity sweep occurs when:
- Price moves below lows
- Buyer stop losses are triggered
- Breakout sellers enter
- Institutions buy into that liquidity
- Price reverses higher
These liquidity grabs are often mistaken for genuine breakouts.
How to Identify Buy Side Liquidity on a Chart
When performing forex chart analysis, look for:
Equal Highs
Equal highs are one of the most obvious forms of buy side liquidity.
Multiple highs at the same level attract breakout traders and stop losses.
Previous Day High
The Previous Day High is a major institutional liquidity target.
Price frequently reacts around this level.
Resistance Zones
Strong resistance levels often contain buy side liquidity above them.
Session Highs
London and New York session highs are common liquidity targets.
Swing Highs
Obvious swing highs often attract liquidity.
The more obvious the level, the more likely liquidity exists there.
How to Identify Sell Side Liquidity on a Chart
Sell side liquidity can be identified using similar principles.
Equal Lows
Equal lows attract buyer stop losses and breakout sellers.
Previous Day Low
The Previous Day Low is one of the most watched liquidity levels in forex trading.
Support Levels
Support zones often contain significant sell side liquidity.
Session Lows
London and New York session lows frequently act as liquidity magnets.
Swing Lows
Obvious swing lows often attract institutional attention.
Gold (XAUUSD) Liquidity Example
Gold provides excellent examples of liquidity trading.
Suppose XAUUSD forms equal highs around 4580.
Retail traders anticipate a breakout above resistance.
Smart money may push price above 4580, trigger buy side liquidity, and then aggressively sell.
The market then shifts bearish, forms a Break of Structure (BOS), and targets sell side liquidity below recent lows.
The opposite can also occur.
Price may sweep equal lows around a major support level before reversing upward toward buy side liquidity.
This movement from one liquidity pool to another is one of the foundations of Smart Money Concepts trading.
Internal Liquidity vs External Liquidity
Internal Liquidity
Internal liquidity refers to liquidity located within a trading range.
Examples include:
- Consolidation zones
- Minor highs and lows
- Internal market structure
External Liquidity
External liquidity refers to liquidity located outside major highs and lows.
Examples include:
- Major swing highs
- Major swing lows
- Weekly highs and lows
- Previous Day High and Previous Day Low
External liquidity often attracts larger institutional interest.
Common Liquidity Trading Mistakes
Chasing Breakouts
Many traders enter immediately after a breakout.
This often results in getting trapped during liquidity sweeps.
Ignoring Market Structure
Liquidity works best when combined with market structure analysis.
Entering Too Early
Patience is critical.
Wait for confirmation after the liquidity sweep.
Poor Stop Loss Placement
Placing stops in obvious locations makes traders vulnerable to stop hunts.
Trading Against Trend
Liquidity should always be analyzed within the context of overall market direction.
Simple Buy Side and Sell Side Liquidity Trading Strategy
Step 1: Identify Liquidity Pools
Mark:
- Equal highs
- Equal lows
- Previous Day High
- Previous Day Low
- Session highs and lows
Step 2: Wait for the Sweep
Allow price to enter the liquidity zone.
Step 3: Look for Confirmation
Watch for:
- Break of Structure (BOS)
- Change of Character (CHOCH)
- Strong rejection candles
Step 4: Enter on Retest
Wait for price to retest the area after confirmation.
Step 5: Target Opposite Liquidity
Markets often move from one liquidity pool to another.
This provides logical profit targets.
Final Thoughts
Understanding buy side liquidity vs sell side liquidity is one of the most important skills a trader can develop.
Markets are driven by liquidity, not emotions.
Smart money continuously seeks areas where stop losses and pending orders are concentrated.
By learning to identify:
- Buy side liquidity
- Sell side liquidity
- Liquidity sweeps
- Equal highs
- Equal lows
- Market structure shifts
you can begin viewing the market from an institutional perspective rather than a retail perspective.
The most successful traders understand that markets often move from liquidity to liquidity. Once you start identifying these liquidity zones on your charts, price action begins to make far more sense, and your ability to anticipate market movements improves significantly.
Frequently Asked Questions
What is buy side liquidity in forex?
Buy side liquidity refers to stop losses and buy orders located above market highs.
What is sell side liquidity in forex?
Sell side liquidity refers to stop losses and sell orders located below market lows.
Why does smart money target liquidity?
Institutions require liquidity to execute large positions efficiently.
What is a liquidity sweep?
A liquidity sweep occurs when price temporarily enters a liquidity zone before reversing direction.
Is buy side liquidity bullish?
Not necessarily. Buy side liquidity is often targeted before bearish reversals.
Is sell side liquidity bearish?
Not necessarily. Sell side liquidity is often targeted before bullish reversals.
How can traders identify liquidity zones?
Traders can identify liquidity zones by marking equal highs, equal lows, swing highs, swing lows, previous day highs, previous day lows, and major support and resistance levels.
About the Author
Zahari Rangelov
Head of Business Development, TraderFactor
Zahari specializes in broker analysis, regulatory research, and trading education. He has over a decade of experience helping traders navigate the complex world of online brokers. His expertise spans technical and fundamental analysis, medium-term trading strategies, risk management, and trading psychology. A respected mentor and speaker, Zahari regularly leads webinars and seminars covering market sentiment, speculative instruments, and automated trading systems. His research-backed, practical approach has established him as a trusted authority within the global trading community.

Reviewed By:
Reviewed by Alex Kanyi, Head of Compliance at TraderFactor
“This report is for general information only. Trading involves significant risk. Seek independent advice before acting on any content.”
Last Updated: May 2026
Disclaimer:
All information has been prepared by TraderFactor or partners. The information does not contain a record of TraderFactor or partner’s prices or an offer of or solicitation for a transaction in any financial instrument. No representation or warranty is given as to the accuracy or completeness of this information. Any material provided does not have regard to the specific investment objective and financial situation of any person who may read it. Past performance is not a reliable indicator of future performance.