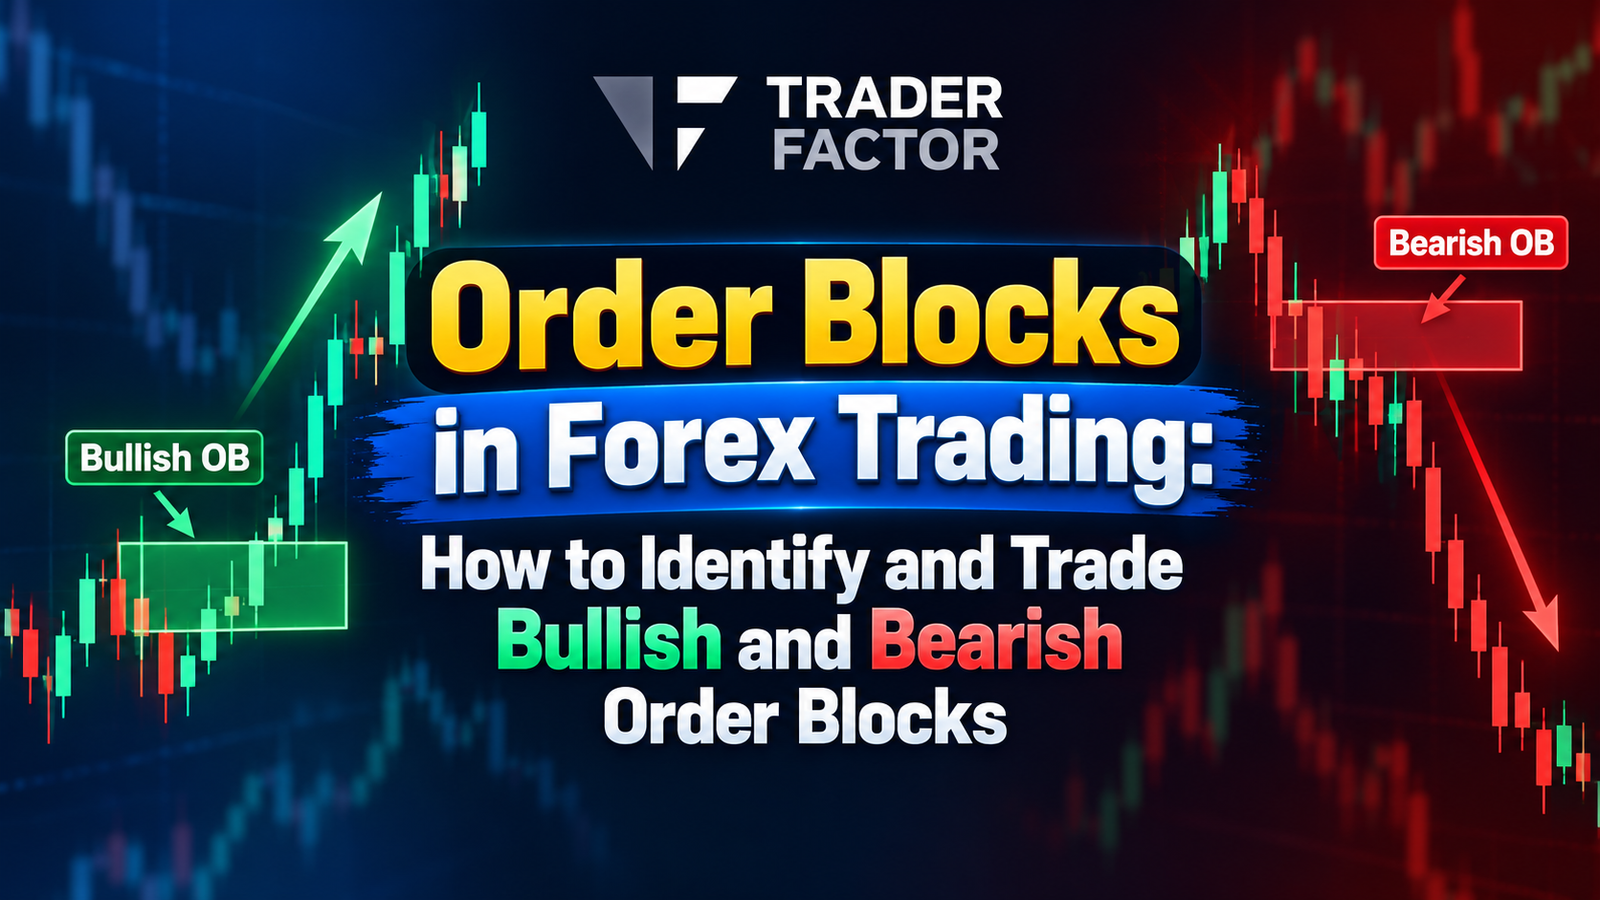

Order Blocks in Forex Trading — How to Identify and Trade Bullish and Bearish Order Blocks
Learn how order blocks form, how to distinguish strong zones from weak ones, and how liquidity, displacement, market structure, fair value gaps and mitigation can improve order-block analysis.
⚡ Quick Answer: What Is an Order Block?
In Smart Money Concepts, an order block is a price zone associated with the final opposing candle or small group of candles before a strong directional move.
A bullish order block is commonly identified around the final bearish candle before strong bullish displacement.
A bearish order block is commonly identified around the final bullish candle before strong bearish displacement.
However, the candle alone is not enough.
Higher-quality order blocks normally combine displacement, a Break of Structure or Market Structure Shift, liquidity interaction, imbalance and a meaningful location within the broader market structure.
⚠️ Important: Order Blocks Are a Price-Action Framework
Order blocks are often described as areas where institutional traders or other large market participants entered significant positions.
That is a useful way of thinking about the concept, but traders should understand an important limitation.
A normal Forex candlestick chart does not show the complete order book of every bank, hedge fund or institutional participant in the global foreign-exchange market.
An order block should therefore be treated as a price-action framework for identifying potentially important reaction zones — not as proof that a specific bank has unfilled orders sitting at that exact price.
📚 What You Will Learn
- What an order block is
- How bullish and bearish order blocks form
- What makes an order block valid
- How liquidity strengthens an order block
- Why displacement matters
- How BOS, CHOCH and MSS relate to order blocks
- How order blocks and Fair Value Gaps work together
- How to mark an order-block zone correctly
- How premium and discount improve selection
- How to use higher and lower timeframes
- Aggressive and confirmation entry models
- Stop-loss and target placement
- Order block mitigation
- Order block vs supply and demand
- Order block vs Fair Value Gap
- Order block vs breaker block
- Common order-block mistakes
- A complete TraderFactor order-block checklist
What Is an Order Block in Forex Trading?
An order block is a zone from which price leaves with unusually strong directional intent.
In SMC-style analysis, traders look back at the origin of that move and identify the final candle or small consolidation that occurred immediately before the displacement.
The idea is simple:
This is very different from marking every bearish candle in an uptrend or every bullish candle in a downtrend.
A meaningful order block should have a reason for being important.
The move away from it should show that the balance between buyers and sellers changed significantly.
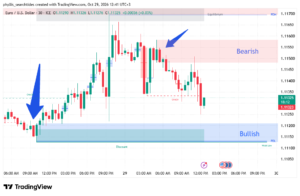
📊 Real Chart Example: Identifying Order Blocks on EUR/USD
The EUR/USD chart below provides a useful example of why traders should not identify order blocks in isolation.
The important clues are the market structure, liquidity, displacement, premium and discount zones, and the reaction when price returns to an important area.
EURUSD order block example showing market structure liquidity BOS CHOCH premium discount and order blocks
EUR/USD chart illustrating bearish structure, liquidity, discount, equilibrium and potential order-block reactions.
1. Start With the Bigger Picture: EUR/USD Is Bearish
The first thing to notice is the sequence of lower highs and lower lows on the left side of the chart.
Several Breaks of Structure — BOS appear as EUR/USD moves progressively lower.
Price falls from above the 1.1210 area toward approximately 1.1120.
This tells us that the dominant order flow has been bearish.
Therefore, bearish order blocks should initially receive more weight than bullish order blocks because they align with the broader structure.
2. Price Reaches Discount and Sell-Side Liquidity
On October 28, EUR/USD moves into the lower part of the dealing range.
This area is marked as Discount on the chart.
The Previous Day Low — PDL — is also located near the same region.
That makes the area interesting because several pieces of information overlap:
- Price is in discount.
- Sell-side liquidity exists near the lows.
- The PDL provides another liquidity reference.
- The broader market has already travelled significantly lower.
This does not automatically mean EUR/USD should be bought. It simply tells us that the location is becoming interesting for a potential reaction.
3. A Bullish Order Block Forms Inside Discount
After reaching the discount area near approximately 1.1115–1.1120, EUR/USD begins to reverse higher.
Look closely at the candles immediately before the strong bullish expansion.
The final bearish candle or small bearish price area before the aggressive rally can be studied as a potential bullish order block.
But notice why this area is more interesting than a random bearish candle:
- It forms near sell-side liquidity.
- It forms in discount.
- Price leaves the area with strong bullish displacement.
- A bullish CHOCH appears.
- Price then expands significantly higher.
This is the sequence traders want to see: location → liquidity → displacement → structure shift.
Bullish Reaction Seen on the Chart
Discount
Liquidity
Order Block
Displacement
CHOCH
4. But the Bullish Order Block Does Not Automatically Change the Main Trend
This chart demonstrates an extremely important lesson.
The bullish order block produces a strong reaction.
EUR/USD rallies from roughly the 1.1120 area toward 1.1165–1.1170.
However, the larger structure remains bearish.
The rally therefore needs to be viewed as a possible retracement until price proves otherwise.
A valid bullish order block can produce a profitable reaction without necessarily creating a complete bullish trend reversal.
5. Price Rallies Toward Equilibrium and PDH
The bullish move eventually reaches the middle-to-upper section of the range.
The chart marks approximately 1.1170 as an Equilibrium area, with the Previous Day High — PDH — nearby.
This is important.
A trader who bought from discount should understand that price is now moving toward an area where:
- Buy-side liquidity may exist.
- Previous highs are nearby.
- The market is leaving discount.
- Existing bearish order flow may reappear.
This is why liquidity targets should be considered before entering an order-block trade.
6. A Bearish Order Block Becomes More Important After the Rally
After the bullish retracement, EUR/USD fails to continue higher.
The chart shows a red resistance area around approximately 1.1148–1.1158.
Within this area, traders can examine the final bullish candle before the renewed bearish displacement.
If that candle produces the move that breaks lower-timeframe bullish structure, it can be treated as a potential bearish order block.
The setup becomes stronger because:
- The larger structure was already bearish.
- Price had retraced upward after trading in discount.
- The rally failed to establish sustained bullish structure.
- Bearish displacement returned.
- A bearish CHOCH appears near the 1.1130 area.
Unlike the earlier bullish order block, this bearish setup aligns with the dominant market structure.
Bearish Continuation Sequence
Retracement
Order Block
Displacement
CHOCH
Liquidity
7. Where Is Price Potentially Drawn Next?
Look at the bottom of the chart.
The low near the PDL is labelled Weak Low.
From an SMC perspective, a weak low can represent sell-side liquidity that remains vulnerable to being taken.
That makes the PDL and the lows near approximately 1.1110–1.1120 an important liquidity area.
This gives the bearish move a logical objective instead of choosing a profit target randomly.
🎯 What This EUR/USD Chart Teaches About Order Blocks
This example contains both bullish and bearish order-block ideas.
The bullish order block near the discount area produced a meaningful rally.
But it occurred against the larger bearish structure.
The later bearish setup formed after the retracement and aligned with the dominant bearish order flow.
This demonstrates why traders should never ask only:
“Where is the order block?”
A better set of questions is:
- What is the higher-timeframe structure?
- Where is liquidity?
- Is price in premium or discount?
- Was liquidity swept?
- Did displacement occur?
- Did structure actually change?
- Is the order block fresh?
- What liquidity is price targeting next?
An order block becomes useful when it fits into the market narrative. The rectangle alone is not the trade.
Why Does Price Return to an Order Block?
Price does not always return to an order block.
When it does, SMC traders commonly describe the return as mitigation.
The idea is that the market returns to the origin of an impulsive move before continuing in the original direction.
From a price-action perspective, there are several reasons this area may become important again:
- The zone represents the origin of strong displacement.
- A previous supply-demand imbalance may remain around the area.
- The zone may overlap with a Fair Value Gap.
- It may sit near a previous liquidity sweep.
- It may represent a technically important retracement area.
- Other traders may also be watching the same structure.
What matters is not the story alone.
What matters is how price behaves when it returns.
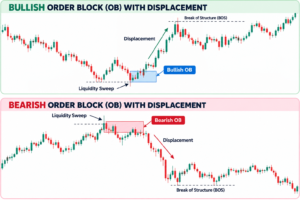
🟢 What Is a Bullish Order Block?
A bullish order block is commonly the final bearish candle or bearish price area before strong bullish displacement.
The bullish move should ideally do something meaningful.
For example, it may:
- Break a previous swing high.
- Create a bullish BOS.
- Create a bullish Market Structure Shift.
- Leave a Fair Value Gap.
- Move away with large-bodied candles.
- Follow a sweep of sell-side liquidity.
The order block becomes much more interesting when the bullish displacement changes market structure rather than merely producing a small bounce.
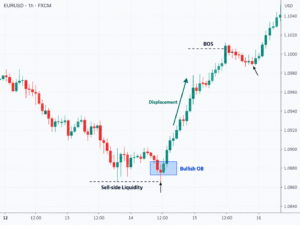
Bullish Order Block Illustration
Sweep
CANDLE
DISPLACEMENT
OF
STRUCTURE
Typical sequence: liquidity sweep → bearish candle → bullish displacement → BOS
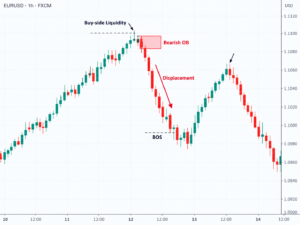
🔴 What Is a Bearish Order Block?
A bearish order block is commonly the final bullish candle or bullish price area before strong bearish displacement.
The bearish move should ideally:
- Break a previous swing low.
- Create bearish BOS.
- Create bearish MSS.
- Leave a bearish Fair Value Gap.
- Show strong downside displacement.
- Follow a sweep of buy-side liquidity.
The strongest bearish order blocks are usually linked to a clear shift in order flow rather than a random bearish candle.
Bearish Order Block Illustration
Sweep
CANDLE
DISPLACEMENT
OF
STRUCTURE
Typical sequence: buy-side liquidity sweep → bullish candle → bearish displacement → BOS
Bullish vs Bearish Order Blocks
| Feature | Bullish Order Block | Bearish Order Block |
|---|---|---|
| Typical candle | Last bearish candle | Last bullish candle |
| Expected move | Bullish displacement | Bearish displacement |
| Preferred liquidity event | Sweep of lows / sell-side liquidity | Sweep of highs / buy-side liquidity |
| Structure confirmation | Break above important high | Break below important low |
| Preferred location | Discount | Premium |
| Typical objective | Buy-side liquidity / highs | Sell-side liquidity / lows |
What Makes an Order Block Valid?
Not every opposite-colored candle should be labelled an order block.
A trader can improve selection by asking whether the zone satisfies several conditions.
1. Clear Displacement
Price should leave the zone with intent.
Displacement normally appears as large-bodied candles with relatively little overlap between consecutive candles.
Slow, overlapping movement away from a candle is usually less convincing than rapid expansion.
2. Market Structure Is Broken
The displacement should ideally break something meaningful.
A bullish order block becomes more important if its impulse breaks a previous swing high.
A bearish order block becomes more important if its impulse breaks a previous swing low.
An order block that creates structural change is generally more meaningful than one that produces only a temporary reaction.
3. Liquidity Was Taken
High-quality reversal order blocks often appear after price first takes liquidity.
For a bullish setup, price may run below:
- Previous swing lows
- Equal lows
- Asian session lows
- Previous-day lows
- Internal sell-side liquidity
For a bearish setup, price may first run above equivalent highs.
The liquidity sweep gives the move more context.
4. An Imbalance or FVG Is Created
Strong displacement often creates a Fair Value Gap.
This shows that price moved so rapidly that there was limited overlap between the surrounding candles.
An order block and FVG appearing together can provide useful confluence.
The order block marks the origin of the move while the FVG marks an imbalance created during the move.
5. The Order Block Is Fresh
A zone that has never been revisited is commonly described as an unmitigated order block.
Once price has returned several times, the zone may become less attractive.
Repeated tests can consume liquidity and reduce the significance of the original reaction area.
6. It Is in the Correct Part of the Range
SMC traders commonly divide a dealing range into premium and discount.
The midpoint is the 50% equilibrium.
- Bullish order blocks are generally more attractive in discount.
- Bearish order blocks are generally more attractive in premium.
Buying a bullish order block at extreme premium or selling a bearish order block at extreme discount can produce poor risk-to-reward even when the zone itself is technically valid.
Why Displacement Is Critical
Displacement is one of the most useful filters for order-block analysis.
Imagine two bearish candles.
Both are followed by a bullish move.
The first produces three small candles that slowly drift higher.
The second is followed by two large bullish candles that break a previous high and leave a Fair Value Gap.
The second setup has much stronger evidence that market order flow changed.
TraderFactor Rule:
Do not identify the order block first and then search for reasons to justify it. Identify the displacement and structural change first, then trace the move back to its origin.
Order Blocks, BOS, CHOCH and Market Structure Shift
Order blocks are much easier to understand when combined with market structure.
| Concept | Meaning | Role With Order Blocks |
|---|---|---|
| BOS | Break of Structure | Confirms continuation or structural expansion. |
| CHOCH | Change of Character | Early warning that previous order flow may be changing. |
| MSS | Market Structure Shift | Often used as lower-timeframe confirmation at an order block. |
For example:
Suppose EUR/USD is trading inside a daily bullish structure.
Price retraces into an H4 bullish order block.
A trader may then move to M15 and wait.
If price sweeps a lower-timeframe low, strongly displaces upward and breaks the latest M15 swing high, the resulting MSS can act as confirmation that buyers are responding to the higher-timeframe order block.
Liquidity + Order Blocks: One of the Strongest Combinations
A common mistake is trading an order block without asking where liquidity sits.
Liquidity tells you what price may be seeking before it reacts.
Bullish Sequence
Equal lows → sell-side liquidity sweep → bullish order block → displacement → bullish MSS/BOS → retracement → continuation toward buy-side liquidity
Bearish Sequence
Equal highs → buy-side liquidity sweep → bearish order block → displacement → bearish MSS/BOS → retracement → continuation toward sell-side liquidity
Order Blocks and Fair Value Gaps
An order block and a Fair Value Gap are not the same thing.
They often appear together because both are associated with strong displacement.
| Order Block | Fair Value Gap |
|---|---|
| Usually marks the origin candle or price zone before displacement. | Marks an imbalance created during rapid price expansion. |
| Used as a potential reaction or mitigation zone. | Used as an imbalance or retracement zone. |
| Can exist without an obvious FVG. | Can exist without a useful order block. |
Higher-Confluence Setup
A fresh higher-timeframe order block that overlaps an FVG and follows a liquidity sweep is generally more interesting than an isolated order block in the middle of random price action.
How Do You Mark an Order Block?
Different SMC traders use slightly different methods.
This is one reason two traders can identify the same order block but draw slightly different zones.
Method 1: Full Candle Range
Mark the entire high-to-low range of the order-block candle.
This is the most conservative approach because it gives the zone more room.
Method 2: Candle Body
Some traders mark only the opening and closing prices of the candle.
This creates a narrower zone but increases the possibility that price reacts from the wick without reaching the body.
Method 3: Refined Order Block
A higher-timeframe order block can be refined on a lower timeframe.
For example, an H4 bearish candle may contain several M15 candles.
The actual lower-timeframe displacement may originate from only one small section of the H4 candle.
That smaller zone can provide a tighter entry and stop.
Be Careful With Over-Refinement
Reducing every order block to a tiny lower-timeframe level may improve theoretical risk-to-reward, but it also increases the chance that price reacts before reaching your exact entry.
What Is the 50% Level of an Order Block?
Some ICT-style traders monitor the midpoint of an order block.
This is sometimes called the mean threshold.
If a bullish order block extends from 1.0800 to 1.0840, its midpoint is approximately 1.0820.
A trader may wait for price to retrace toward that midpoint instead of entering immediately at the first edge of the block.
The same principle can be applied to bearish order blocks.
The 50% level should be treated as a refinement technique, not as a guarantee that price must trade there.
Premium and Discount: Where Is the Order Block Located?
Suppose price rallies from 1.1000 to 1.1200.
The midpoint is 1.1100.
Prices below the midpoint sit in discount relative to that dealing range.
Prices above it sit in premium.
If your higher-timeframe bias is bullish, a bullish order block in discount can provide better location than one near the top of the range.
Multi-Timeframe Order Block Analysis
One of the most effective ways to use order blocks is to separate bias, setup and entry across different timeframes.
| Purpose | Possible Timeframes | What to Look For |
|---|---|---|
| Higher-timeframe bias | Weekly / Daily / H4 | Major structure, liquidity and PD arrays. |
| Setup timeframe | H4 / H1 / M15 | Order block, sweep, displacement, BOS/MSS. |
| Entry timeframe | M15 / M5 / M1 | Lower-timeframe confirmation and refined risk. |
The exact combination depends on your trading style.
A swing trader may use Daily → H4 → H1.
A day trader may use H4 → M15 → M5.
A short-term intraday trader may use H1 → M5 → M1.
The principle is more important than the exact timeframes: use the higher timeframe for context and the lower timeframe for precision.
How to Trade a Bullish Order Block
Step 1 — Establish Bullish Bias
Confirm that the higher timeframe supports bullish order flow or that price has reached a major higher-timeframe demand or discount area.
Step 2 — Identify Sell-Side Liquidity
Look for lows that price may target before reversing.
This may include equal lows, session lows or a prior swing low.
Step 3 — Wait for the Sweep
Allow price to trade below the liquidity level instead of buying prematurely.
Step 4 — Look for Bullish Displacement
A strong move away from the low should appear.
Step 5 — Confirm Structure
The move should break an important lower-timeframe swing high or create bullish MSS/BOS.
Step 6 — Mark the Bullish Order Block
Locate the final bearish candle or bearish price area before the displacement.
Step 7 — Wait for Mitigation
Allow price to retrace toward the zone.
Step 8 — Enter With Your Chosen Model
Use either a direct order-block entry or lower-timeframe confirmation.
How to Trade a Bearish Order Block
Step 1 — Establish Bearish Bias
Use higher-timeframe structure and location to determine whether bearish setups make sense.
Step 2 — Find Buy-Side Liquidity
Look for equal highs, previous-day highs, session highs or other obvious liquidity.
Step 3 — Wait for the Liquidity Sweep
Price may trade above those highs before reversing.
Step 4 — Look for Bearish Displacement
A strong downside expansion should follow.
Step 5 — Confirm Structure
Look for a bearish MSS or break below an important swing low.
Step 6 — Mark the Bearish Order Block
Locate the final bullish candle before the strong selloff.
Step 7 — Wait for Price to Return
Do not chase the displacement after it has already travelled far from the zone.
Step 8 — Execute Your Entry Model
Enter directly or wait for lower-timeframe bearish confirmation.
Three Ways to Enter an Order Block
1. Aggressive Touch Entry
The trader places a limit order inside the order block before price returns.
Advantages:
- Earlier entry
- Potentially tighter stop
- Potentially higher risk-to-reward
Disadvantages:
- No confirmation that the zone will hold
- More false reactions
- More vulnerable during volatile news
This model requires strong confidence in higher-timeframe context.
2. 50% Order Block Entry
The trader uses the midpoint or mean threshold of the block as the desired entry.
This can improve entry price but creates the risk that price reacts from the edge of the block without reaching the midpoint.
It should be considered an optional refinement rather than a universal rule.
3. Confirmation Entry
The trader waits for price to reach the order block and then drops to a lower timeframe.
For a bullish order block, confirmation may include:
- Sell-side liquidity sweep
- Bullish displacement
- Bullish MSS
- Lower-timeframe FVG
- Lower-timeframe bullish order block
The opposite applies to bearish setups.
This approach usually gives up some entry price in exchange for additional evidence that the order block is actually producing a reaction.
Bullish Confirmation Entry Example
Order Block
of Low
Displacement
MSS
Retracement
Where Should the Stop Loss Go?
A stop loss should be connected to the idea that invalidates the setup.
Bullish Order Block
A common structural stop sits below the bullish order block or below the liquidity low that created the setup.
Bearish Order Block
A common structural stop sits above the bearish order block or above the liquidity high.
Avoid Arbitrary Stops
Using a fixed 10-pip or 20-pip stop on every currency pair ignores volatility, timeframe and market structure. A stop should normally be based on the technical invalidation level and then translated into appropriate position size.
Where Should You Take Profit?
Order-block traders can use liquidity as a logical target.
Possible bullish targets include:
- Previous swing highs
- Equal highs
- Previous-day high
- Session high
- External buy-side liquidity
- Higher-timeframe resistance
Possible bearish targets include the opposite levels.
Traders can also scale out of positions.
For example:
TP1: nearest internal liquidity
TP2: previous swing high or low
TP3: external liquidity or higher-timeframe objective
What Is Order Block Mitigation?
Mitigation describes price returning to a previously created order block after the initial displacement.
Suppose price creates a bullish order block at 1.2500–1.2520 and rallies strongly to 1.2700.
Several hours later, price retraces into 1.2500–1.2520.
That return can be described as mitigation of the bullish order block.
Traders then monitor whether price:
- Rejects the zone
- Consolidates inside it
- Creates lower-timeframe confirmation
- Trades completely through it
A reaction supports the original order-block thesis. A decisive failure can invalidate it or transform it into another type of price-action reference.
When Does an Order Block Fail?
An order block is not automatically valid forever.
Failure may occur when:
- Price closes decisively through the zone.
- The structural low or high behind the setup is broken.
- The higher-timeframe bias changes.
- A major opposing displacement appears.
- The zone has already been mitigated several times.
- The expected liquidity target changes.
A failed order block can sometimes become relevant again as a breaker block.
Order Block vs Breaker Block
| Order Block | Breaker Block |
|---|---|
| Original price zone before strong displacement. | Usually develops after an order block fails and price trades through it. |
| Expected to support continuation or reversal in its original direction. | The failed zone can later act in the opposite role. |
| Bullish OB usually acts as support. | Failed bullish OB may later act as resistance. |
Order Blocks vs Supply and Demand Zones
Order blocks and traditional supply-and-demand zones overlap conceptually, but the frameworks are not identical.
A supply-and-demand trader may identify any area where price left aggressively.
An SMC trader often asks additional questions:
- Was liquidity taken first?
- Did displacement occur?
- Was structure broken?
- Was an FVG created?
- Is the zone in premium or discount?
- What liquidity is price likely drawing toward?
The additional context is often more important than the label applied to the zone.
Illustrative Bullish Order Block Example
Assume EUR/USD is bullish on H4.
Price has rallied from 1.0800 to 1.1000.
It then retraces.
Equal lows have formed around 1.0900.
Price trades below the equal lows to 1.0885, taking sell-side liquidity.
A bearish M15 candle forms between 1.0890 and 1.0910.
Immediately afterward, price produces strong bullish displacement and breaks the previous M15 swing high at 1.0945.
The bearish candle at 1.0890–1.0910 can now be studied as a potential bullish order block.
Price later retraces to 1.0900.
On M5, traders observe another small sell-side sweep followed by bullish MSS.
A bullish entry could then be considered with risk below the structural low and targets toward previous highs.
These prices are illustrative only. The important lesson is the sequence, not the numbers.
Illustrative Bearish Order Block Example
Assume GBP/USD is bearish on H4.
Price retraces upward and forms equal highs around 1.3100.
The market trades above the highs to 1.3120, taking buy-side liquidity.
The final bullish M15 candle trades from approximately 1.3090 to 1.3115.
A strong bearish displacement follows.
Price breaks below an important M15 swing low at 1.3040 and leaves a bearish FVG.
The final bullish candle becomes a potential bearish order block.
When price later retraces toward the block, a trader could monitor M5 for bearish confirmation.
Again, the prices are illustrative. Focus on liquidity → displacement → structure → retracement.
Should You Trade Order Blocks During High-Impact News?
Order blocks can appear around major economic announcements, but execution risk increases substantially.
Events such as:
- Federal Reserve decisions
- US CPI
- Nonfarm Payrolls
- ECB decisions
- Bank of England decisions
- GDP
- PCE inflation
can generate rapid price spikes.
During these events:
- Spread can widen.
- Slippage can increase.
- Price can trade through an order block before reversing.
- Both sides of liquidity can be taken quickly.
Important:
A technically attractive order block does not remove event risk. Check the economic calendar before
entering a trade.
When Should You Avoid an Order Block?
Consider avoiding or reducing confidence in a setup when:
- The market is extremely choppy.
- No clear displacement occurred.
- No meaningful structure was broken.
- The zone sits in the middle of a random range.
- The block has already been tested several times.
- The setup trades directly against strong higher-timeframe order flow.
- The expected target offers poor risk-to-reward.
- A major economic announcement is seconds away.
- The order block exists only because you want to find a trade.
10 Common Order Block Trading Mistakes
- Marking every opposite candle.
A candle is not automatically an order block. - Ignoring market structure.
Order blocks make more sense when connected to BOS or MSS. - Ignoring liquidity.
Price may sweep the obvious high or low before reacting. - Entering after displacement has already travelled too far.
Chasing price usually damages risk-to-reward. - Trading every retest blindly.
Lower-timeframe confirmation can filter weaker reactions. - Using the same stop size on every market.
Stops should relate to structure and volatility. - Ignoring premium and discount.
Location matters. - Over-refining the zone.
A tiny entry may look attractive but can easily be missed. - Ignoring major news.
High-impact events can invalidate normal technical behaviour. - Assuming order blocks always work.
No price-action concept has a 100% success rate.
TraderFactor Order Block Quality Checklist
Before trading an order block, score the setup.
| Question | Yes | Why It Matters |
|---|---|---|
| Is higher-timeframe bias clear? | ☐ | Avoids trading random direction. |
| Was liquidity swept? | ☐ | Adds context to the reversal. |
| Was there strong displacement? | ☐ | Shows directional intent. |
| Did price break structure? | ☐ | Confirms the move changed order flow. |
| Was an FVG created? | ☐ | Supports the displacement thesis. |
| Is the order block fresh? | ☐ | First mitigation may be cleaner. |
| Is location favorable? | ☐ | Premium/discount improves context. |
| Is there a clear liquidity target? | ☐ | Provides logical trade objective. |
| Is risk-to-reward acceptable? | ☐ | A good setup can still be a poor trade. |
| Is major news risk understood? | ☐ | Prevents surprise event exposure. |
What Does a High-Quality Order Block Look Like?
A Strong Bullish Setup Might Look Like This:
Higher-timeframe bullish bias
↓
Price enters discount
↓
Sell-side liquidity is swept
↓
Bullish displacement appears
↓
Previous swing high breaks
↓
Bullish FVG forms
↓
Final bearish candle is identified as bullish OB
↓
Price retraces into OB
↓
Lower-timeframe bullish MSS confirms reaction
↓
Target Buy-Side Liquidity
Risk Management Is More Important Than the Order Block
Even a technically excellent order block can fail.
No trader knows with certainty whether price will respect a zone.
This is why risk management must come before the entry.
Before entering, know:
- Your exact invalidation point
- Your monetary risk
- Your position size
- Your first target
- Your maximum acceptable loss
- Whether high-impact news is approaching
Never increase risk simply because an order block “looks perfect.”
Strong confluence can improve a setup, but it cannot remove uncertainty from the market.
Frequently Asked Questions About Order Blocks
Is an order block simply the last candle before a move?
Not necessarily. The last opposing candle becomes more meaningful when the move away shows displacement, breaks structure and fits the wider liquidity and higher-timeframe context.
What is a bullish order block?
It is commonly the last bearish candle or bearish price area before strong bullish displacement that produces meaningful structural change.
What is a bearish order block?
It is commonly the last bullish candle or bullish price area before strong bearish displacement.
Does price always return to an order block?
No. Some strong market moves never retrace deeply enough to revisit the original block.
Which timeframe is best for order blocks?
There is no single best timeframe. Higher timeframes generally provide broader context, while lower timeframes can refine entries. The best combination depends on whether you are swing trading, day trading or scalping.
Can order blocks be used on Gold, indices and crypto?
Yes. The price-action framework can be applied to Forex, Gold, stock indices, cryptocurrencies and other liquid markets, although volatility and execution conditions differ between instruments.
Should I enter immediately when price touches an order block?
You can, but that is the aggressive approach. Traders seeking additional confirmation may wait for a lower-timeframe liquidity sweep, displacement and MSS before entering.
Can an order block fail?
Yes. Order blocks are potential reaction zones, not guaranteed turning points.
🎯 Final Takeaway
Order blocks become much easier to trade when you stop treating them as isolated candles.
The candle itself is only one part of the setup.
A stronger order-block model combines:
- Higher-timeframe direction
- Liquidity
- Displacement
- Market structure
- Fair Value Gaps
- Premium and discount
- Freshness
- Lower-timeframe confirmation
- A clear invalidation level
- A logical liquidity target
A bullish order block is not valuable simply because it is the last bearish candle before a rally.
A bearish order block is not valuable simply because it is the last bullish candle before a decline.
The real question is whether the order block sits at the origin of a meaningful change in market order flow.
📚 Continue Learning Smart Money Concepts
Order blocks are only one part of Smart Money Concepts.
To understand them properly, traders should also study liquidity, market structure, displacement, Fair Value Gaps and premium/discount pricing.
📊 Practice Identifying Order Blocks on Live Charts
Open live Forex, Gold, crypto and index charts and practice identifying liquidity, displacement and potential order blocks across multiple timeframes.
💼 Compare Forex Brokers With TraderFactor
Compare broker regulation, platforms, trading conditions, account types and key features before choosing a provider.
About the Author

Zahari Rangelov
Head of Business Development, TraderFactor
Zahari specializes in broker analysis, regulatory research, technical and fundamental market analysis, trading education, risk management and trading psychology.
Reviewed By:
Alex Kanyi, Head of Compliance at TraderFactor
Risk Disclaimer:
This article is for general educational and informational purposes only and does not constitute financial advice. Order blocks, Smart Money Concepts and other technical-analysis methods do not guarantee profitable trades. Forex and CFD trading involve significant risk, and traders should use appropriate position sizing, risk management and independent analysis before making trading decisions.