
The Relative Strength Index (RSI) indicator is one of the most reliable tools you can use in technical analysis. It helps you evaluate the momentum of price movements and identify overbought or oversold conditions. If you’re trading forex, stocks, gold, or even cryptocurrencies, understanding this indicator is crucial for making better trading decisions.
This guide will walk you through everything you need to know about the RSI indicator. You’ll learn its definition, formula, and practical applications. We’ll also go over its divergence, how you can combine it with other indicators, and actionable strategies. By the end, you’ll feel confident using RSI in your own trades.
RSI Indicator: Meaning
The RSI indicator is a momentum oscillator that ranges between 0 and 100, helping you determine whether an asset is overbought or oversold. When the RSI value rises above 70, the market is likely overbought, which might signal a reversal or pause in the upward trend. Similarly, an RSI value below 30 indicates oversold conditions and a potential buying opportunity.
RSI is your ally in understanding who’s in control of the market, buyers or sellers. You can access this indicator easily through platforms like TradingView or MT4. Whether you’re day trading or investing long-term, the insights it provides can guide your actions in volatile markets.
RSI Indicator Formula
To understand how the RSI indicator works, you need to know its formula. The RSI is calculated as:
RSI = 100 - (100 / (1 + RS))
Here, RS is the relative strength, which is the average of gains divided by the average of losses over a selected period. Most trading platforms set the default period to 14, but you can adjust this based on what works best for you.
Using a shorter timeframe, like 9, will make the RSI react faster to price changes. This is useful if you’re a scalper or day trader. For longer-term trends, you can extend the period to 21 to smooth out fluctuations. By tweaking the RSI settings, you can tailor it to match your style and goals.
How to Interpret RSI for Overbought and Oversold
Understanding how to read the RSI can make your trades more precise. When the RSI goes above 70, it usually indicates that the asset is overbought. This might point to a reversal or a slowdown in the uptrend. On the other hand, when the RSI dips below 30, it signifies oversold conditions, which could lead to a price increase.
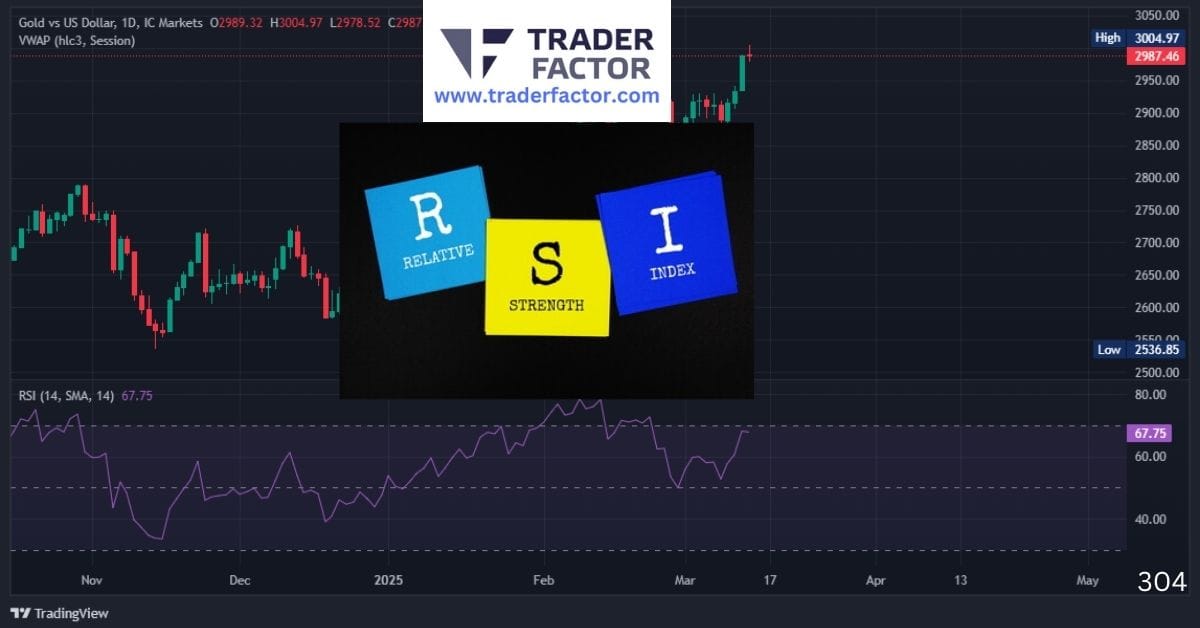
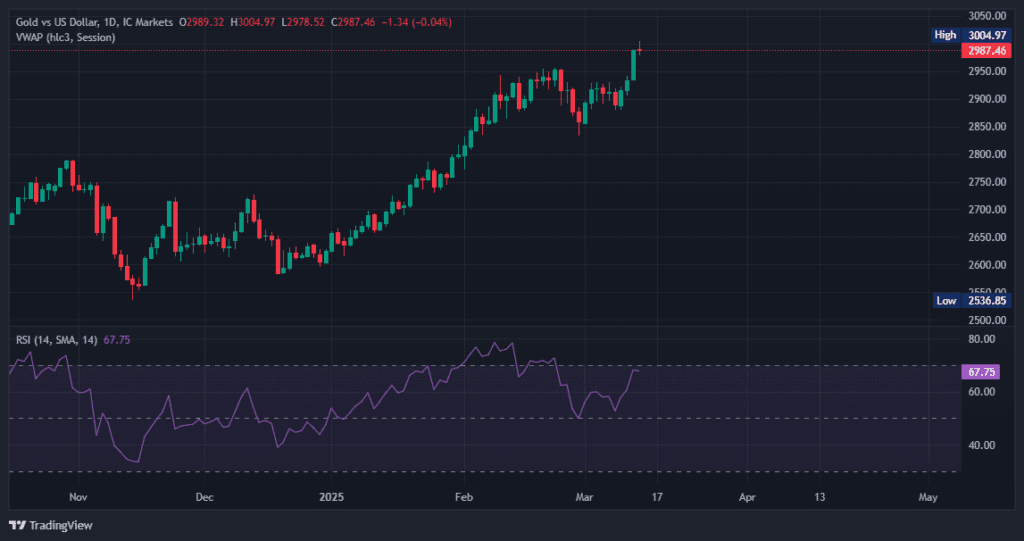
However, you need to consider the bigger context. During strong trends, RSI can remain in the overbought or oversold zone for extended periods. For example, in a strong gold rally, you might see the gold RSI today live staying above 70 without any immediate reversal. Pairing RSI with other indicators, like trendlines or Bollinger Bands, gives you more reliable signals.
How to Use RSI in Different Timeframes
Your trading timeframe plays a vital role in how you use RSI. If you’re a short-term trader, smaller timeframes like 5-minute, 15-minute, or 1-hour charts are best. These allow you to quickly spot overbought or oversold conditions. A 5-minute RSI indicator crypto can warn you about short-term price spikes, helping you time your trades better.
For swing trading, you should focus on 4-hour or daily charts. These timeframes give you a broader view of medium-term trends. If you spot RSI divergence, such as the price rising while RSI falls, it could signal a trend reversal that’s perfect for a swing trade setup.
If you’re a long-term trader, weekly or monthly timeframes will better suit your needs. With these, you can identify overbought or oversold conditions that might lead to major corrections. For example, if RSI for XAUUSD shows a reading above 70 on a weekly chart, it might signal the need for caution when trading gold.
Adjusting the timeframe to your strategy improves the accuracy of the RSI signals you depend on.
RSI Indicator Buy and Sell Signals
The RSI indicator offers straightforward buy-and-sell signals. When the RSI crosses above 30 from an oversold level, it generates a buy signal. This tells you that buying pressure is increasing, creating an opportunity for upward movement. Conversely, when RSI falls below 70 from an overbought condition, it signals that selling pressure might soon dominate, making it a potential time to sell.
These signals are even more effective when you confirm them with other indicators or tools. For example, if your RSI indicator chart shows a sell signal near resistance, that strengthens your decision. Similarly, a buy signal aligning with strong support adds weight to your trade. Don’t rely solely on RSI; always confirm before taking action.
RSI Divergence Indicator
Understanding divergence is crucial if you want to get the most out of the RSI indicator. Divergence occurs when the price moves in one direction while the RSI moves in the opposite direction. This often points to a weakening trend and a possible reversal.
If you notice a bullish divergence, where the price makes lower lows but RSI makes higher lows, it suggests that sellers are losing momentum. This could be a good time to consider buying. On the other hand, bearish divergence happens when the price makes higher highs, but RSI makes lower highs. This tells you that the bullish momentum may be running out of steam, signaling a potential sell opportunity.
Look for divergence on your RSI chart during major price movements, especially in assets like gold or forex currency pairs. Pairing it with the RSI volume indicator or candlestick patterns increases reliability.
How to Combine RSI with Other Indicators
To get the best out of RSI, pair it with other tools. Combining RSI with moving averages is a fantastic strategy. Use moving averages to identify the overall trend and RSI to time your entry or exit. For example, if the RSI is showing overbought levels while the price approaches the 200-day moving average, it strengthens a possible sell signal.
Another useful pairing is the RSI and Bollinger Bands. If RSI falls into oversold territory while the price touches the lower Bollinger Band, it might be an ideal buying scenario. Similarly, combining MACD and RSI allows you to capture shifts in momentum while confirming trends. By using these combinations, you can significantly reduce false signals and increase your trade success rate.
Practical Example with XAUUSD
Take gold as an example to see how RSI works in action. Suppose the gold RSI today live shows a reading above 75 on a daily chart. This suggests overbought conditions, especially if gold’s price is nearing a key resistance level. You might want to prepare for a price correction or reversal.
On the flip side, if RSI drops below 30 and gold prices hit a significant support zone, it could present a buying opportunity. Platforms like TradingView allow you to analyze RSI for gold in real-time, helping you fine-tune your entries and exits.
How to Customize RSI Indicator Settings
You can customize RSI indicator settings by adjusting the period length and the overbought/oversold levels. A 14-period RSI is the default, but you can shorten it to 9 for quicker signals or extend it to 21 for a smoother trend analysis. Adjust the overbought and oversold levels from the standard 70/30 to 80/20 for volatile markets to reduce false signals. Personalizing these settings helps you align the RSI with your trading strategy.
How to Use the RSI Indicator on TradingView
On TradingView, you can add the RSI indicator by selecting “Indicators” at the top, then searching for “Relative Strength Index.” TradingView allows you to modify RSI settings directly, such as the lookback period and overbought/oversold levels. Additionally, you can layer it with other tools like Bollinger Bands or moving averages for a combined analysis. TradingView’s real-time data and customization options make it a great platform for effectively using the RSI indicator.
Common RSI Strategies
You can explore different RSI strategies based on your trading goals. One effective strategy is to watch for RSI divergence and use it alongside volume to confirm the strength of a potential reversal.
If you’re trading forex, consider adjusting your RSI settings to shorter timeframes to match the volatility of currency pairs. For example, trading EUR/USD on a 15-minute RSI could provide quicker insights into developing trends.

For more depth, you can look into resources like RSI strategy PDFs or RSI strategy charts that break down these methods step by step. By practicing these strategies, you can adapt RSI to suit multiple markets, including crypto and precious metals like gold.
What is the Best RSI Indicator Strategy for Day Trading
When you’re day trading, finding the right RSI settings is crucial to spotting quick opportunities in fast-moving markets. The RSI tool allows you to gauge overbought or oversold conditions, and fine-tuning its settings to match your trading style can significantly improve your chances of success. Here’s how you can optimize the RSI for various timeframes and platforms.
For scalping in ultra-short timeframes, the best RSI settings for 1-minute chart trading involve reducing the default period to 5 or 7. This adjustment makes the RSI highly sensitive to small price changes, helping you react faster to market movements. Suppose you’re trading a 5-minute chart and want to identify quick swings. The best RSI settings for 5-minute chart is a 7-period RSI with overbought/oversold levels set to 80/20 to handle increased market volatility. If you’re visualizing this on a platform like TradingView, the best RSI settings for 5-minute chart TradingView use similar adjustments but can be layered with moving averages for trend confirmation.

For slightly longer trades, the best RSI settings for 30-minute chart offer a more stable view of intraday movements. A 14-period RSI works well for day traders looking to capture medium-term momentum without being overly affected by noise. Similarly, when you’re eyeing the best RSI settings for 4 hour chart, sticking to the default period provides a reliable gauge of larger transitions, which is useful for more deliberate entries and exits.
Refining these settings also depends on critical factors like market conditions, asset volatility, and personal trading goals. When you adjust your RSI strategy for any timeframe, always test it on past data within the specific platform you’re using, whether it’s TradingView or another tool, to ensure consistency in results.
Best RSI Settings for Swing Trading
Swing trading typically focuses on capturing larger price moves over several days, and tuning your RSI accordingly helps you better identify these trends. The RSI setting for intraday swing trading often leans toward longer periods, such as 14 or 21, which smooth out smaller fluctuations and highlight significant pivots in price action.

An effective swing trading strategy uses overbought and oversold levels differently. Instead of the standard 70/30 levels, you might adjust them to 60/40 or 80/20, depending on the market’s volatility. These adjusted levels reduce false signals and allow you to focus on trades that align with broader market conditions. For instance, monitoring RSI signals with a 14-period setting in a low-volatility stock provides strong confirmation for sustained moves, while a 9-period RSI in high-volatility forex trading may yield better flexibility for quicker reactions.
Swing traders often combine RSI with other indicators like moving averages or support/resistance levels to improve accuracy. By adapting the RSI strategy to your specific swing trading goals, you position yourself for better timing and precision in placing trades.
FAQs

What is a 30 70 RSI strategy?
This approach lets you identify buying opportunities when RSI is below 30 and selling opportunities when RSI is above 70.
What is a good RSI indicator?
The default 14-period RSI indicator works well in most markets and trading platforms like MT4 and TradingView.
What is a good RSI number to buy?
A value below 30 generally suggests oversold conditions, signaling a buying opportunity.
How to avoid RSI false signals?
You can combine RSI with tools like MACD and Bollinger Bands to confirm the signals before taking action.

What is the RSI indicator for XAUUSD?
The RSI indicator for XAUUSD helps you monitor gold’s momentum and spot overbought or oversold levels.
How do you add the RSI indicator to MT4?
To add the RSI indicator to the MT4 platform, you need to open your MT4 trading terminal and go to the “Insert” tab at the top. From there, select “Indicators,” then “Oscillators,” and click on “Relative Strength Index.” A window will pop up where you can customize the settings before adding it to your chart.
Summary
The RSI indicator is a powerful tool for improving your trades. By understanding overbought and oversold signals, spotting divergence, and pairing RSI with other indicators, you can gain a well-rounded view of the market. Whether you’re trading gold, forex, crypto, or any other instrument, applying RSI strategies will help you make informed, confident decisions. Start practicing and explore the full potential of RSI in your trades today.
Disclaimer:
All information has been prepared by TraderFactor or partners. The information does not contain a record of TraderFactor or partner’s prices or an offer of or solicitation for a transaction in any financial instrument. No representation or warranty is given as to the accuracy or completeness of this information. Any material provided does not have regard to the specific investment objective and financial situation of any person who may read it. Past performance is not a reliable indicator of future performance.