This week has seen significant movements in several major currencies, driven by a range of factors from economic data releases to geopolitical developments.
Here’s a roundup of the top currency movers and what they could mean for traders.
AUD/USD
AUD/USD rebounds toward 0.6850 amid Australian Capex big beat, USD pullback. After an unexpected strong beat on the Australian Capex report, AUD/USD is springing back up towards 0.6850 as USD dips slightly lower!
The AUD/USD is continuing its resurgence and rising toward 0.6850 on Thursday morning in Asia!
While the US Dollar initially surged after Wednesday’s hawkish Fed Minutes, a drop back down has helped propel this Aussie recovery – especially due to some upbeat Australian Capex data.
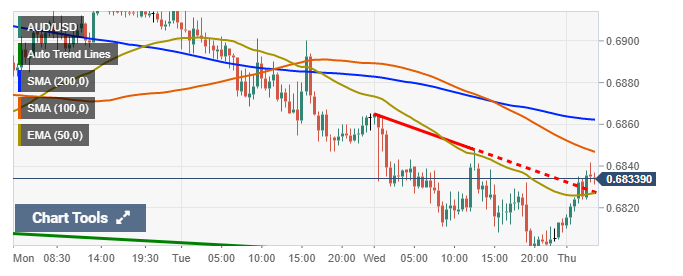
AUD/USD is having a bit of an off day for the second time in a row, trading just barely above its lowest point this month.
The 200-day SMA shows that it’s been on somewhat of a downward spiral lately and recent drops under the 20-SMA put further pressure on prices to keep going south.
As if things weren’t bad enough already, technical indicators had nothing good to say either as they remain firmly rooted in bearish territory at multi-month lows –
Looks like we’re all set up for more downside ahead!
It’s looking pretty gloomy for the AUD/USD at the moment! The 4-hour chart is showing a bearish image with prices well below their moving averages and technical indicators remaining in negative territory.
This reflects that there just isn’t any buyer enthusiasm around right now, making it more important than ever to keep an eye out for future developments – will things turn back up or go even further south?
EUR/USD
The Euro is finding itself in the middle of a glimmering upswing, bouncing back after its recent slump. Investors appear emboldened by this positive news and with no pressing headlines to contend with, EUR/USD appears content at 1.0620 for now.
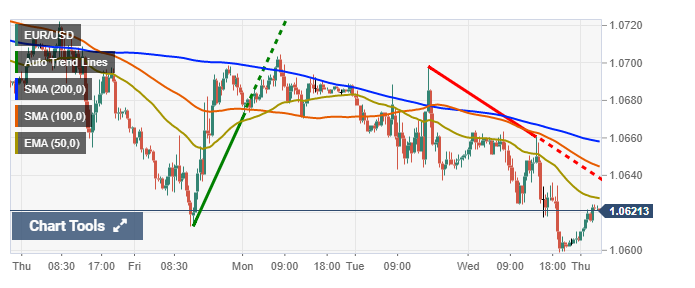
EUR/USD is in a bit of trouble right now as it struggles to stay afloat under bearish pressure. Its 20 Simple Moving Average (SMA) and technical indicators are pointing downward.
Additionally, the 61.8% retracement level at 1.0745 acts like an unyielding resistance wall halting any possible recovery attempts for the moment.
However, if prices sink even lower there may be hope yet with the 100 SMA ready to provide support around 1.0425 – let’s see where things go from here!
It looks like the 4-hour chart is telling us that it’s not going to be an easy ride up for prices. With a bearish 20 SMA and 100 SMA both pointing downwards, things might get interesting in the near future!
Technical indicators are also signaling downward momentum which could mean some difficult times ahead – so keep your eyes peeled if you’re trading this asset.
Widespread risk aversion kept the EUR/USD pair on edge Wednesday, with a weekly decline taking it closer to its monthly low.
Speculative investors face another week of volatility as they monitor the escalating tensions between Russia and Ukraine while central banks continue their hawkish stance.
Deutsche Bank has upped its expectations for the European Central Bank’s terminal rate, but ECB governing council member Francois Villeroy de Galhau believes this prediction might be a bit too high.
He emphasizes that restrictive borrowing costs have already been set by the central bank and markets shouldn’t assume they will go higher at each meeting.
Bullard, the St. Louis Federal Reserve President, believes that if there are more aggressive interest rate hikes now then it will give the FOMC a fighting chance to beat inflation in 2021 without hurting economic growth!
After much anticipation, the Federal Open Market Committee (FOMC) finally released information from their latest meeting – and it’s a real eye-opener!
While some members favored raising interest rates by 50 basis points now to reach inflation targets in 2023, others warned of potential recession risks.
The participants unanimously agreed more rate hikes are needed and balance sheet reductions should be carried out for optimal results.
As Germany released the January Harmonized Index of Consumer Prices (HICP) figures and saw an annual inflation rate at 9.2%.
They also published their February IFO survey which fell short with a lower-than-expected index of 91.1, revised down from its previous reading in January to 90.1!
This Thursday will be busy as economic reports are due out for Europe’s HICP estimate rising by 8.6% YoY, coupled with U.S.’s Q4 GDP update and weekly unemployment stats – exciting times ahead!
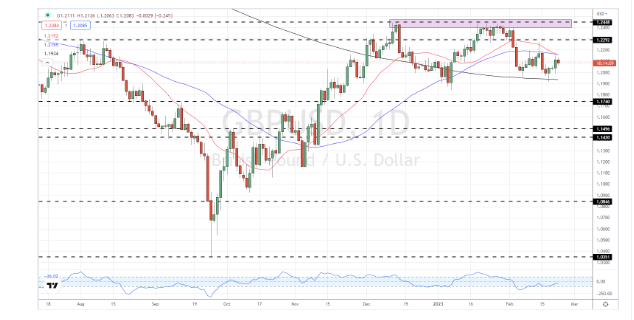
GBP/USD
This week’s strong economic indicators have given the British Pound a boost, allowing it to remain in contention against its US Dollar counterpart.
The latest UK Purchasing Managers’ Indexes (PMIs) surpassed expectations and exhibited an impressive surge of activity in February – especially within the services sector!
On top of that, government net borrowing was even more robust than anticipated with better-than-expected tax receipts leading this indicator into surplus territory for January. It looks like things are looking up across both sides of the Atlantic!
After months of economic uncertainty, the UK may finally be looking at a brighter future. Inflation is taking a downward turn and although current levels are still higher than desirable – 10.1% compared to the BoE’s target of 2%, this change in trend has opened up more possibilities for action from the Bank of England.
It looks like there could even be some good news on rates with increases expected soon followed by potentially further cuts down the line if growth persists and inflation progresses as anticipated!
Wow! The mighty US Dollar is running rampant, pushing the cable higher with a slew of aggressive rate hikes.
Not far from making multi-week highs, it seems yield rallies spurred on by a hawkish Fed will be fueling its powerful engine for some time to come. Brace yourselves – this train’s gonna keep rolling until further notice!
GBP/USD seems to be stuck in the middle with no end in sight. The recent double-top around 1.2450 looks unlikely to budge, while solid resistance from levels of 1.2270s and up should keep it steady – at least until our saviour 200-dma swoops into save us if any selloff occurs!
Gold
Gold is taking a breather after its recent drastic plunge as prices remain largely unchanged in the Asian session, hovering close to $1,825.00.
With incoming economic data suggesting higher rates on their way to put a lid on inflationary pressure, gold could bear witness more descent ahead – potentially falling down towards the 1$820-mark!
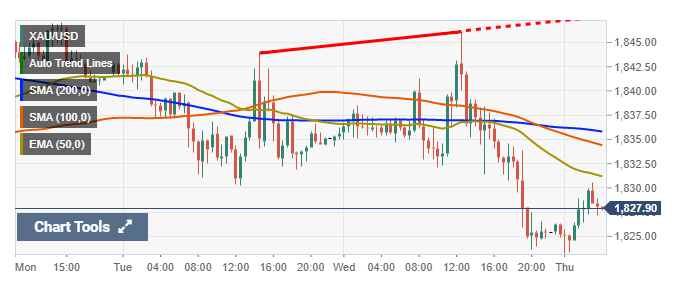
Gold prices are teetering on the edge – hovering near a critical support level of $1,807. The weekly chart indicates we could be witnessing the beginning of an ominous bearish trend that may take us away from recent bullish highs. Keep your eyes peeled for any changes!
Gold investors were eagerly awaiting the Federal Open Market Committee Minutes of 2023 and, upon their release, found that a few participants favoured rate hikes.
This caused a slight drop in Gold prices around $1,825 – though they did earlier reach highs near 41 846!
The US Dollar has been bid with this news while the Treasury Yields remain steady-ish. All eyes are now on further insights into whether or not we could see 50 basis points increase soon.
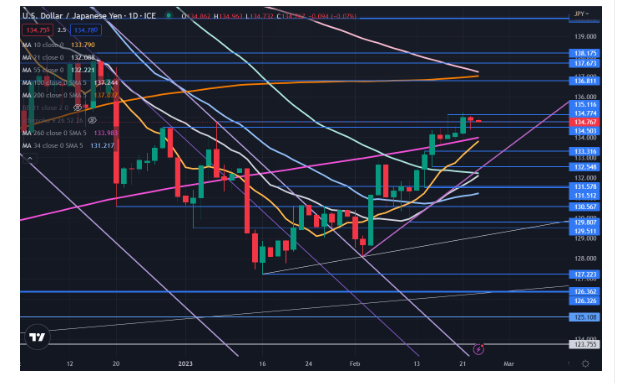
USD/JPY
Since mid-January, the Japanese Yen has been steadily declining against the US Dollar. However, a recent move back into what is known as the Ichimoku Cloud could be hinting at an upcoming potential turnaround in trend direction from bearish to bullish!
While it’s important not to get too caught up in past performance when predicting future results, this movement certainly warrants paying attention and keeping close tabs on prices going forward.
Who knows – we may soon see that Japan’s currency starts taking off once again!
It looks like the market could be bullish – the 9-day SMA has already soared above its 26 day counterpart.
Although this paints a rosy picture, there’s still one key obstacle that needs to be overcome – we need to see if the lagging line will have what it takes to enter into cloud territory!
Prices are at a crossroads – will they surpass their prior peak or retreat?
If momentum takes hold, the former may be possible due to potential resistance levels around 137.67 and 143.53 while declining values could find support near 129.81, 128.09 and even 126-126.36 from last year! The choice is yours – where do you think it’s headed?
USD/ZAR
The US Dollar has been the driving force behind a strong performance of USD/ZAR, which is on its way to six weeks of consecutive gains.
This comes as South Africa faces worsening economic conditions due to electricity outages- while Eskom received an impressive $13.9 billion bailout package, demand for safe haven greenback remains high bolstered by a resilient American labor market and economy overall.
The Rand’s volatile price action continues to be largely impacted both technically and fundamentally – making it worth watching!
After a stunning jump the USD/ZAR has continued to soar, reaching heights not seen since October ’22. However, analysts warn that this could be short lived as any new developments in growth outlook and rate increases will affect its progress.
A small candle on the daily chart suggests some hesitancy from investors – we’ll all have to wait with baited breath and see what happens next.
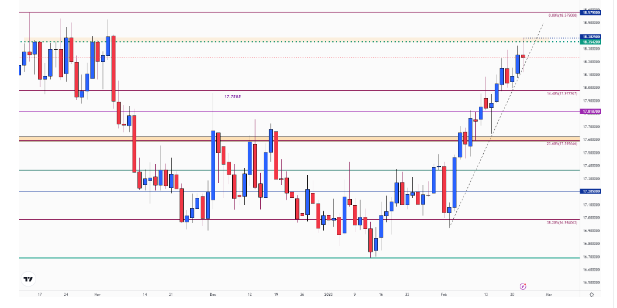
It could be a great time to invest in the Rand and Dollar pair right now, with prices currently at 18.200!
If things continue go up—like if the Dollar strengthens its hold or South Africa doesn’t find itself facing further power outages–it looks like we’re heading towards an October high of 18.400 that’ll open more potential upside opportunities for investors…
But! It all boils down to whether they can stay above today’s crucial level of support: 18.00.
Factors That Can Affect The Exchange Rate In 2023
Stocks Updates
US equity futures have been on a roller coaster ride of late, with downturns driven by the Federal Reserve’s increasing likelihood for aggressive rate hikes.
The recent economic data has revealed higher inflation and resilient employment figures that are likely to spur more action from FOMC this evening.
As investors anticipate further news in interest rates, all eyes remain on Fed chair Jerome Powell as he strives towards achieving their dual mandate – price stability coupled with an unemployment level below 4%.
Despite the political environment, our economy is proving resilient! This good news gives the central bank a chance to lift market rates – something that could cause non-yielding assets and even USD values to rise.
As we wait with anticipation for what comes next, US stock futures have fortunately remained buoyant!
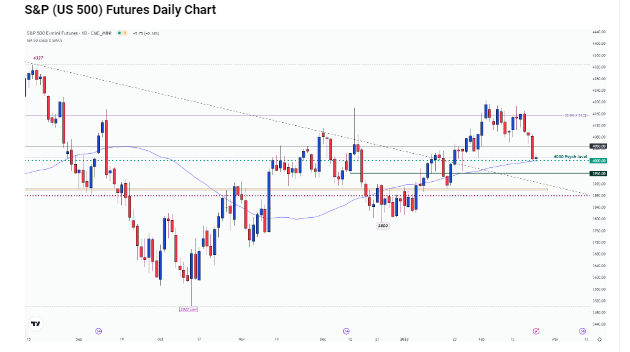
S&P 500
Following three disappointing days in the markets, SPX futures bounced back to 4,000 – a psychological support point.
With prices teetering under past resistance and edging up just 0.17% today, we may be seeing steady progress towards their mid-year target of 4155! Providing further relief is that the 50 day Moving Average held its ground at 3998; hopefully keeping us on track for even more positive market movement ahead!
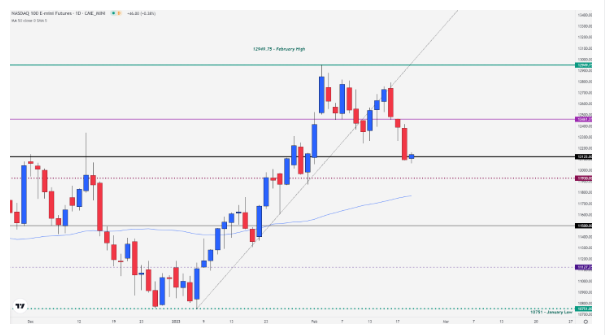
Nasdaq 100
Nasdaq futures have been on a roller coaster this week, but they may be turning back up! After hitting resistance at 12,122. tech stocks are currently under the microscope – if prices break through this level though we could see them take off and reach their previous high of 12.

European Markets
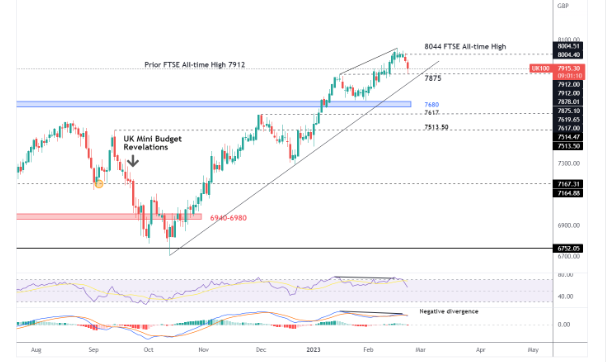
After a triumphant end to 2022, the FTSE 100 kept marching upwards at the beginning of 2023 with record-breaking highs each day. Despite this impressive performance however, obstacles remain – especially in light of lackluster GDP growth predicted by Bank of England.
Positive PMI from both nations saw a simultaneous rise for pound sterling and US dollar against cable last week but strength for GBP could indicate more drops ahead since it has consistently had an inverse relationship with UK stocks over time.
The FTSE and DAX have been making highs, but the RSI and MACD indicators are showing lower readings. This “negative divergence” may mean that we’re in for a downturn soon – although it is too early to be certain yet!
Price action currently tests 7875 as immediate support, with trendline support following at 7680 – if this level breaks then traders will need to reassess their bullish outlook on the markets.
Charts: From Trading View
Find the Best Forex Broker in the UK

Disclaimer:
All information has been prepared by TraderFactor or partners. The information does not contain a record of TraderFactor or partner’s prices or an offer of or solicitation for a transaction in any financial instrument. No representation or warranty is given as to the accuracy or completeness of this information. Any material provided does not have regard to the specific investment objective and financial situation of any person who may read it. Past performance is not a reliable indicator of future performance.