

Cryptocurrency’s winning streak came to a pause as Bitcoin and others took a dip in price after a surge that exceeded the market’s expectation. Bitcoin BTCUSD +0.05% took a hit as the latest surge in prices stumbled, pushing digital assets below key levels.
Although there are potential positive events on the horizon, the next major move may take time. Bitcoin itself saw a 1.5% drop below $29,950- an important benchmark it just surpassed after experiencing a bear market in June 2022.
In recent weeks, Bitcoin prices have surged, rising by over 80% from as high as $31,000, but have yet to find stable footing at these new heights.
Meanwhile, the American buck showed some serious hustle in the last 48 hours, recording its most impressive performance since the onset of spring.
Despite this, the DXY hasn’t quite made it to the other side of a crucial trendline after embracing bullish behavior. Additionally, while USD/JPY has made strides towards a breakthrough, IGCS isn’t singing its praises with a worrisome bearish forecast.
A Technical Analysis Perspective Of The Dollar
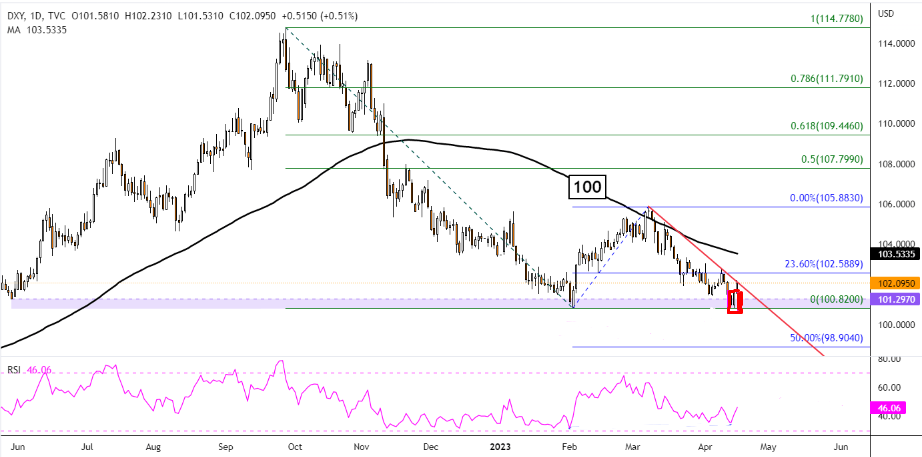
The US dollar is on the rise, with the DXY Dollar Index gaining 0.51% on Monday and 0.57% on Friday. The past two trading days have seen the most significant increase in over a month.
Analysts had predicted this, as the dollar recently hit critical support levels and positive RSI divergence suggested a possible shift upwards.
And now, with the currency unable to clear that zone, it’s bounced back in a big way. Is this the start of a major win streak for the dollar? Only time will tell.
The future remains uncertain, though there have been some recent positive gains for the US Dollar. However, a trendline from March could potentially hinder further growth unless there is a significant rise that breaks through it.
This has put the spotlight on the 100-day Simple Moving Average (SMA), which was a key resistance in early March and could once again maintain a downside bias if prices continue to climb. The question remains whether these bullish moments will last, and only time will tell if we have a bright future ahead.
Keep an Eye on the 100-Day SMA on the Daily Chart of USD/JPY
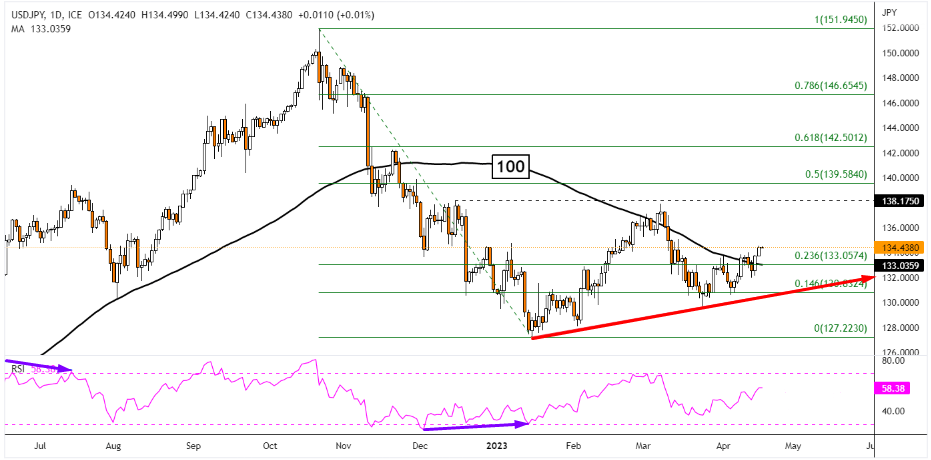
In the realm of currency trading, the US Dollar has made strides against the Japanese Yen, taking it above its 100-day SMA. This breakout has unveiled a potential target at just shy of 138.17, which hasn’t been seen since March.
What’s more, prices have closed at their highest in over a month, indicating further upward momentum.
A steady trendline formed at the start of the year is also acting as a guidepost, ensuring that the exchange rate continues to head in the right direction.
But, just in case things take a turn for the worse, this trendline could provide a safety net to prevent any substantial downturns.
The mood of traders towards USD/JPY indicates a negative outlook, leaning towards a bearish market.
Get a unique look at the market sentiment around USD/JPY with IG Client Sentiment (IGCS). The latest data shows that 38% of retail traders are currently net-long the exchange rate. IGCS is often seen as a contrarian indicator, which means that this bullish figure could in fact be a signal for bearish investors.
Nonetheless, recent data shows a 7.79% gain in upside exposure from yesterday, and an 11.02% increase compared to last week. This suggests that prices could be about to take a turn for the worse, giving traders something to keep a close eye on.
Other Market Updates
As the U.S. dollar continues its comeback tour, gold prices slip back and find themselves exploring the technical support realm of $2,000. On top of that, ever-rising U.S. Treasury yields aren’t helping augment the sinking feeling of the precious metal market.
And over in the world of oil, prices are feeling the pressure as they struggle to break free from the $82.60/$83.40 chokehold.
Read these next……
Compare the Best Laptops for Forex Trading in 2023
Forex for Beginners: What You Need to Know To Get Started
Best Trading Sessions At Forex Markets
Factors That Affect The Exchange Rate In 2023
Disclaimer:
All information has been prepared by TraderFactor or partners. The information does not contain a record of TraderFactor or partner’s prices or an offer of or solicitation for a transaction in any financial instrument. No representation or warranty is given as to the accuracy or completeness of this information. Any material provided does not have regard to the specific investment objective and financial situation of any person who may read it. Past performance is not a reliable indicator of future performance.