Spring has apparently sprung in the US economy, as evidenced by last Friday’s upbeat data. Business activity across the land is picking up, as confirmed by S&P Global.
Even the manufacturing sector, which has been a tad sluggish, showed promise, with figures exceeding expectations and surpassing February’s result.
Investors were feeling festive too, as the S&P 500, the Nasdaq 100, and the Dow Jones all wrapped up last week with impressive gains. All signs point to a positive outlook for the near future.
Catch up with your weekly markets updates here:
The Week Ahead
Get ready for a jam-packed week of economic data releases from across the globe! The US is no exception with four major events to look out for.
| On Tuesday, March 28, we’ll see the eagerly anticipated CB Consumer Confidence data hit the markets at 14h00 GMT. |
| On Thursday, March 30, keep an eye out for the Final GDP Growth Rate Q0Q data due at 12h30 GMT. |
| On Friday, March 31, we’ll be watching the Core PCE Price Index from the Feds – their preferred gauge of inflation – which is also due at 12h30 GMT. |
| Finally, we close out the week with the Michigan Consumer Sentiment (final) at 14h00 GMT on Friday, March 31. |
Stay ahead of the game with the ultimate guide to the most influential economic events and releases with the Traderfactor Calendar. From big moves to small shifts, never miss a beat and stay on top of the financial world.
The Yen Price Outlook
The yen is ready to pounce, with USD/JPY and AUD/JPY both looking towards a potential decline. But don’t stop there! Keep your eyes peeled for key levels to watch in these currency crosses, as EUR/JPY is also showing signs of a possible drop.
The Japanese yen is anticipated to soar to its January high against the US dollar. This is due to concerns over the stability of the European financial sector and speculation that the US Fed has reached its peak in rates.
The market is predicting an 80% possibility that the US rates have already peaked, with a Fed rate cut expected in July. The central bank recently adopted a more cautious outlook on rates to account for the banking sector’s potential stress.
USD-JPY Weekly Chart
The USD/JPY is taking a bit of a nosedive towards the January low of 127.20, as shown on technical charts.
The pair had initially encountered some resistance around the 137.00-138.20 region, which included the 200-day moving average and the December high of 138.20. This was hinted at in recent updates, and now we’re seeing the effects. Keep an eye on this one!
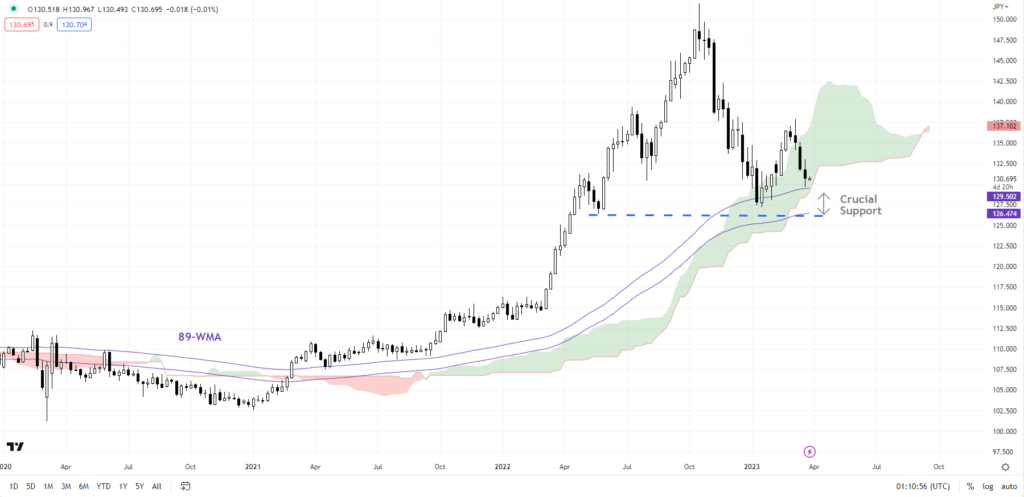
The USD/JPY uptrend that’s been going strong for two years could face a potential threat if the January low of 127.20 is broken, which aligns with the lower edge of the Ichimoku cloud and the May 2022 low of 126.35 on weekly charts.
Though not an immediate possibility, a below-the-belt breach could negatively impact the trend, making it a situation to keep watch on.
AUD-JPY Weekly Chart

The AUD/JPY currency pair is on the brink of a potentially dangerous plummet, as it inches closer and closer to the critical support level established by a horizontal trendline dating back to May 2022.
If this trendline is breached, the pair could plummet toward the 200-week moving average, a significant mark currently sitting at 81.60.
The recent downward trend has already triggered a double-top pattern, with a projected price objective of roughly 87.50 – just barely above the December low of 87.00.
With everything hanging in the balance, all eyes are on whether the AUD/JPY can hold on or if it will come crashing down.
EUR/JPY Weekly Chart

After showing strength, EUR/JPY’s momentum has weakened following a dip below a crucial support level at the end of February. This move also marked the successful completion of a triple top pattern forecasted in early March. Short term risks point to a further drop, possibly reaching the low seen in January.
Markets Outlook
American stocks wrapped up the week with a flourish, with every sector logging gains, headed up by the mighty Nasdaq 100.
Boosted by ample financial resources, attractive prospects for lower lending rates and strong technical indicators, investors were optimistic about future profits. However, troubles still loom, especially in the credit market and banking industry which are causing concern as we enter another week.
This apprehension could dampen any potential gains in the US stock market.
Indices Updates
This past week has been a rollercoaster ride for US stock markets, with wild swings and plenty of drama. Banking concerns and recession fears took a toll on value stocks, while larger cap stocks saw gains thanks to falling rate expectations.
The financial sector suffered globally, including in the US, with many stocks feeling the pressure. At the same time, the Federal Reserve made significant economic projections, including a shift in the dot plot to suggest only one more rate hike in May.
It’s been a turbulent time for investors, with plenty of uncertainty and drama to navigate.
As the market holds its breath, Fed Chair Powell made it clear that rate cuts in 2023 are not on the table – at least not yet.
Despite this, there’s no predicting what might happen in the future, and the Fed won’t hesitate to take action if the market starts to tank.
So buckle up, investors, and get ready for a wild ride!
The stock market experienced a roller coaster ride this week, with the S&P 500, Nasdaq 100 and Dow Jones all experiencing ups and downs. Things looked particularly gloomy on Wednesday, but Thursday and Friday saw a welcome rebound.
However, there was a bit of a scare on Friday, as Deutsche Bank encountered some challenges that caused insurance costs to skyrocket, resulting in a 14% drop in their shares.
As a result, some investors are feeling apprehensive about possible systemic credit events, which are now seen as the biggest risk for the first time in 9 months. Despite all of this drama, US indices managed to end the week in the green, showing resilience in the face of uncertainty.
Wall Street Outlook
Despite recent market fluctuations, stock indices are proving resilient thanks to a select group of large cap stocks. Interestingly, two of these stocks – Apple and Microsoft – now make up over 13% of the S&P 500 for the first time in decades.
Defensive and growth stocks have performed well during the banking crisis while cyclical sectors have struggled. This trend is expected to continue in the short term.
As the market eagerly anticipates a potential rate cut from the Federal Reserve in 2023, the Nasdaq 100 FAANG stocks are proving themselves to be the undeniable champions. These tech giants are crushing the S&P 500 in terms of performance, with their impressive showing partially attributable to a recent influx of cash and a favourable interest rate environment.
However, one might think twice before hopping aboard this high-flying bandwagon, as concerns remain over fundamental factors that could leave some stocks, currently valued at 22 times their earnings, vulnerable in the long run.
Moreover, the S&P 500 may receive further support in the near future as the SPDR S&P 500 ETF SPY saw a massive $7.3 billion inflow last week. This marks the largest inflow since November 2020 and the 6th largest in the last 10 years.
Have you ever wondered why FAANG stocks seem to defy logic and keep rising?
It’s no secret that these tech giants thrive on liquidity and an appetite for innovation, and with the recent surge in AI development and rate cuts on the horizon, the Nasdaq 100 could be in for a wild ride.
But that’s not all – amid the chaos of layoffs and bailouts, some companies are doubling down on profitability and investors are taking notice. Who knows what the future holds for FAANG stocks, but one thing’s for sure: it’s never boring in the world of tech investing.
The upcoming market movements are expected to be driven by sentiment, with a lack of major economic events on the horizon. However, the banking sector will remain front and center, as concerns over fallout for US regional banks persist.
All eyes will be on US Treasury Secretary Janet Yellen, whose recent commentary on insuring deposits has caused quite a stir.
While Yellen initially caused markets to dip with her remarks, she assured US lawmakers on Thursday that regulators will take further steps to protect the banking system if necessary. As we wait for Yellen’s next move, many analysts believe her recent statements have had a greater impact on stock declines than Fed Chair Powell or the FOMC meeting.
As we head into the new week, all eyes are on the banking sector as further troubles could cause major shifts in the market. But if things remain calm, we could see some exciting gains for US Indices.
Despite Traderfactor’s analysts’ neutral outlook, the uncertainty surrounding the banking sector is still casting a shadow over the technicals.
Bitcoin Price Updates
Bitcoin hasn’t lost its spark, with a current trading value of $27,888 and a 24-hour trading volume of $13.7 billion. It’s currently at a 1.50% increase in value over the past 24 hours, and has an impressive $539 billion live market capitalization.
However, things may get a bit rocky as the BTC/USD pair exhibits a choppy trend, with possible resistance at the $28,900 level. Despite this, the technical outlook hasn’t changed much, as Bitcoin continues to hold steady around the $27,900 mark. Keep watching; the bright but unpredictable of this crypto.

As the BTC/USD pair strives to break through the ceiling of $28,950, the crypto world is holding its breath in anticipation. If successful, the value of Bitcoin could take a significant leap upward, potentially soaring to unprecedented heights of $29,200 or even reaching a staggering $30,700.
However, should a downward spiral occur, it’s predicted that Bitcoin’s price won’t crash and burn, but will find firm footing at around $26,600 and $25,200. Only time will tell which way the winds of change will blow!
Disclaimer:
All information has been prepared by TraderFactor or partners. The information does not contain a record of TraderFactor or partner’s prices or an offer of or solicitation for a transaction in any financial instrument. No representation or warranty is given as to the accuracy or completeness of this information. Any material provided does not have regard to the specific investment objective and financial situation of any person who may read it. Past performance is not a reliable indicator of future performance.