
Are you a trader who wants to take your currency analysis to the next level? Looking for new strategies and techniques that will give you an edge in the forex market? Then mastering line trading could be just what you need. Line trading is becoming increasingly popular amongst day traders, allowing them to identify potential entry and exit points swiftly while eliminating unnecessary guesswork.
In this blog post, we’ll explore how line trading works at its core, detailing its key features as well as providing actionable tips so that many traders can benefit from using it. So if you’re serious about taking your forex market performance to new heights, read on!
Overview: Price Charts

What does a price chart represent?
A price chart represents the historical performance of a specific asset, such as a currency pair in Forex trading. It shows the fluctuation of the lowest price over a given period, from minutes to years, providing valuable insights into market trends and potential future price movements.
Understanding Trend Lines
Trend and draw trend lines are crucial tools in technical analysis, helping traders identify market trends. An upward trend line connects at least two lows, showing an increasing market, while a downward trend line connects at least two highs, indicating a declining market.
What are forex trading strategies?
Forex trading strategies are systematic plans that guide a trader’s decisions on when to buy or sell a currency pair. They can be based on various factors, such as technical analysis, fundamental analysis, or a combination of both. Common strategies include day trading, swing trading, scalping, and short position-only trading.

Understanding Forex Line Trading
Forex line trading involves using line charts to visualize price movements and identify potential trading opportunities. Line charts plot closing prices over a specified period, simplifying market data and highlighting overall trends.
Types of Price Charts
There are three main types of price charts used in forex trading – straight-line charts, a bar chart, charts, and candlestick charts. Each presents price information differently, catering to different trading styles and strategies.
Uptrend Lines
Uptrend lines are drawn below the price by connecting at least two lows. They signify a market in which prices are generally increasing. A break below an uptrend line can signal a potential trend reversal.
Benefits of Forex Line Trading
Forex line trading simplifies market analysis by focusing on the opening price and closing prices only. This helps traders to identify overarching trends and make more informed trading decisions.
Line Chart
A line chart is the simplest form of charting, consisting of a single line connecting closing prices. It provides a clear visual of a security’s price movement over time, helping traders identify general and historical price movements and trends.

Trend trading strategy
A trend trading strategy involves identifying the market’s direction (up, down, or sideways) and placing trades that align with this trend. It’s based on the assumption that markets tend to move in trends over time.
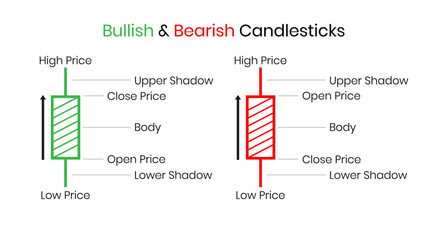
Candlesticks Charts
“Candlestick chart” charts provide more detailed information than line charts, showing the opening, closing, high, and low prices for each period. Candlestick patterns are popular due to their visual appeal and the detailed price patterns they reveal.
How to create a forex trading strategy
Creating a forex trading strategy involves defining your entry and exit points, setting your risk tolerance level, selecting your preferred trading tools and indicators, and backtesting your strategy on historical data before applying it in live trading.
Using Log Scale for Long-Term Analysis
A log scale is useful for long-term analysis as it represents percentage changes in price rather than absolute changes. This helps to compare large price movements over extended periods accurately.
Sideways Trend Lines
Sideways trend lines, or horizontal trend lines, indicate a range-bound market where the price fluctuates between two levels, the support and resistance, without a clear direction.

Carry trade forex strategy
A carry trade forex strategy involves borrowing a currency with a low interest rate to buy a currency with a higher interest rate. Traders profit from the difference in interest rates.
Trading Strategies with Trend Lines
Trend lines can form the basis of various trading strategies. For example, traders might buy when the price bounces off an uptrend line or sell when it breaks below an uptrend line.
Key Tips for Successful Trend Line Trading
Successful trend line trading involves accurately drawing trend lines, understanding what they signify to technical traders, and incorporating them into a broader trading strategy. It’s also crucial to set stop losses and take profits wisely to manage risk.

Trend Line Breakouts
Trend line breakouts occur when the price breaches a trend line, potentially signalling a trend reversal. Traders often see this as a trading opportunity and enter a trade in the direction of the new trend or breakout.
Identifying Highs and Lows in Forex
Identifying highs and lows is crucial in forex trading as it helps to spot trends and potential reversals. A high is a point where the price has reached a peak before falling, while a low is a very low point, the point where the price has fallen before bouncing back up.

Importance of Forex Line Trading
Forex line trading is an essential component of technical analysis that can assist you in making informed trading decisions.
Here’s why it’s crucial for your trading journey:
Simplicity and Clarity
Forex line charts are straightforward to understand, even for beginners. They display the closing price for each time period, producing a continuous line. This simplicity allows you to focus on overall price movement without getting distracted by the noise of intraday fluctuations.
For example, if you’re looking at a daily line chart of EUR/USD, each point on the line represents the closing price for a specific day. By connecting these points, you get a clear picture of the currency pair’s price movement over time.
Visual Trend Identification
Line charts enable you to visually identify market trends. An upward-sloping line indicates a bullish (upward) trend in financial markets, while a downward-sloping line signifies a bearish (downward) trend.
Let’s say you notice the line chart for GBP/JPY has been gradually sloping upwards over several months. This upward movement suggests a bullish trend, which might influence your decision to buy the pair in anticipation of further price increases.

Basic Technical Analysis
Line charts provide a foundation for basic technical analysis. You can anticipate potential price movements and plan your trades by drawing trend lines or identifying support and resistance levels on your weekly chart below.
For instance, if you identify a consistent support level on a line chart for USD/CAD, you may decide to place a buy order when the price approaches this level, expecting it to bounce back up.
Effective for Long-Term Analysis
Forex line trading system is particularly effective for long-term market analysis. It allows you to easily visualize long-term trends and patterns, assisting you in making strategic trading decisions.
For example, using a line chart, you might notice a repeating pattern in the AUD/NZD exchange rate over the past year. This observation could help you predict future price movements and develop a long-term trading strategy.
Quick Decision-Making
Line charts can aid in quick decision-making by providing a clear and simple view of market trends. This clarity allows you to react promptly to market changes, which is crucial in the fast-paced world of forex trading.
Accessibility for All Traders
Forex line trading is accessible to all traders, regardless of their experience level. It provides a straightforward way for novice traders to begin analyzing the market while also offering valuable insights and investment advice for more experienced traders.

Foundation for Strategy Development
Understanding line charts is a fundamental skill for strategy development in forex trading. It provides the basis for further technical analysis techniques and helps you understand market dynamics before diving into more complex strategies.
Combination with Indicators
Line charts can be combined with various technical indicators, such as moving averages or Relative Strength Index (RSI), to enhance your market analysis. These combinations can confirm trends and generate more accurate trading signals.
Psychological Advantage
Using line charts can give you a psychological advantage by helping you stay focused on the bigger picture rather than getting caught up in short-term price fluctuations. This perspective can help reduce emotional trading decisions and increase your trading discipline.
Educational Value
Forex line trading has significant educational value. It’s an excellent starting point for learning about the forex market and understanding how prices move over time. As you gain experience, you can build upon this knowledge and explore more advanced trading strategies.
Foundational Trading Skill
Understanding line charts is a foundational trading skill. It’s one of the first things you’ll learn as a forex trader, and it will continue to be a valuable tool throughout your trading career. Whether you’re a beginner or a seasoned trader, forex charts and line trading are worth mastering.

Basics of Forex Line Charts
Forex line charts are a fundamental tool in your trading arsenal. They provide a clear and concise way to visualize price movements over time. Let’s delve into the basics:
Line Chart Analysis in Forex Trading

Price Points in Forex Market
Each point on a Forex line chart represents the closing price of a currency pair for a specific period. For example, if you’re looking at a daily forex chart for EUR/USD, each point on the line would represent the closing price for that day. This allows you to see how the price has moved over time.
Time Scale
The time scale on a line chart runs horizontally along the vertical axis at the bottom of the chart. Depending on your trading strategy, it can be adjusted to show different periods, from minutes to years. For instance, a day trader might use a 15-minute time scale, while a long-term trader could use a weekly or monthly time scale.
Vertical Scale
The vertical scale on a line chart represents the price of the currency pair. It’s usually displayed on the right side of the chart. The range of the vertical scale can be adjusted to zoom in or out on the price data. For example, if you’re tracking a major market’s price movement, you might want to widen the range to see the full extent of the change.
Connecting Data Points
In a line chart, the data points (closing prices) are connected by a continuous line. This line helps you visually track the price movement over time. So, if you’re following the USD/JPY pair and the line steadily rises, it indicates that the yen is weakening against the dollar over the selected period.

Trend Identification
Line charts are excellent tools for identifying trends. A rising line indicates an uptrend (bullish), a falling line indicates a downtrend (bearish), and a flat line shows a sideways trend (range-bound). Identifying these trends can help you decide when to enter or exit a trade.
Support and Resistance Levels
Line charts can also identify support and resistance levels. These are levels at which the price has historically struggled to fall below (support) or rise above (resistance). For example, if GBP/USD has repeatedly failed to rise above 1.3000, this level could be considered a resistance level.
Pattern Recognition
Forex line charts can help you recognize common price patterns, such as head and shoulders, double tops or bottoms, and triangles. Recognizing these various chart patterns can provide clues about future price movements. For instance, a head and shoulders pattern might indicate a potential trend reversal.
Price Reversals and Continuations
Line charts can indicate price trend reversals (when the price changes direction) and continuations (when the price or valid trend line continues in the same direction). For example, if AUD/NZD has been trending upward and the line starts to fall, this could indicate a price reversal.
Time Frame Selection
Choosing the right time frame for your line chart is crucial. The time frame should align with your trading strategy. If you’re a scalper, you might use a 1-minute or 5-minute line chart analysis in forex trading, while swing traders might use a 4-hour or daily chart.
Combining with Other Analysis Tools
Line charts can be combined with other technical analysis tools, like moving averages or oscillators, to enhance your market analysis. For instance, applying a moving average to your line chart can help smooth out price fluctuations and show the underlying trend more clearly.
Limitations
While line charts are useful, they do have limitations. They only show closing prices, omitting information about price highs, lows, and opening prices. They can also oversimplify price data, potentially masking important details. It’s, therefore, beneficial to use simple line charts and charts alongside other chart types and technical analysis tools.

Key Components of Line Trading Strategy
A successful line trading strategy involves more than just recognizing trends. It requires a comprehensive understanding of various factors and the ability to apply them effectively. Let’s delve into these key components:
Support and Resistance Levels
Identifying support and resistance levels is crucial in line trading. These are price levels at which the currency pair has consistently struggled to fall below (support) or rise above (resistance). For example, if the EUR/USD currency pair moves but has repeatedly bounced back upon reaching 1.1200, that could be considered a support level.
Timeframes Selection
Choosing the right timeframe for your line trading strategy is essential. If you prefer quick trades within a day, you might focus on shorter timeframes like the 15-minute or 1-hour charts. Daily or weekly charts may be more suitable if you’re more into long-term trading.
Entry and Exit Rules Forex Traders Need to Know
Establish clear rules for when to enter and exit trades. For example, you might decide to enter a trade when the price bounces off a support level and exit when it approaches a resistance level. Having predefined rules can help eliminate impulsive decisions and enhance your trading discipline.
Risk Management
Effective risk management is vital in line trading. This could involve setting stop-loss orders to limit potential losses if the market moves against you. For instance, when going long on a currency pair, you might set a stop-loss order a few pips below a support level.
Trade Confirmation Indicators
Trade confirmation indicators, like moving averages or Relative Strength Index (RSI), can provide additional assurance before entering a trade. For example, you might wait for the RSI to indicate oversold conditions before buying a currency pair near a support level.
Price Patterns
Recognize common price patterns, such as triangles, head and shoulders, or double tops/bottoms. These patterns can provide clues about future price movements. For instance, a completed head and shoulders pattern might signal a further price action or potential trend reversal.
Multiple Time Frames Analysis
Analyzing multiple time frames can give you a more comprehensive market view. Most traders could use a longer timeframe to identify the overall trend and a shorter one to pinpoint entry and exit points.
News and Economic Events
Stay informed about news and economic events that could impact currency prices. Major events, like central bank announcements or economic indicators releases, can cause significant price movements. Incorporating this information into your line trading strategy can help you anticipate market reactions.
Backtesting and Optimization
Backtest your line trading strategy on historical data to evaluate its effectiveness. This can help you identify any weaknesses and make necessary adjustments. For example, if your strategy performs poorly during volatile market conditions, you might need to refine your entry and exit rules.
Trading Journal
Maintain a trading journal to record your trades and reflect on your performance. Include details like the date, currency pair, entry and exit prices, profit/loss, and any observations about the market or your decision-making process. Reviewing this journal regularly can provide valuable insights and help improve your line trading strategy.
Continuous Learning
Forex trading is a constant learning process. Stay updated with new trading techniques, tools, and market trends. Regularly review your line trading strategy and be open to making adjustments as you gain more experience and knowledge. Remember, even the most experienced traders continually learn and adapt to succeed in the ever-changing forex market.

Risk Management in Line Trading

Effective risk management is the cornerstone of successful line trading. It’s not just about making profitable trades but also protecting your capital when things don’t go as planned. Here’s how to manage risk in line trading:
Position Sizing
Position sizing involves determining how much of your capital you’ll risk on each trade. A common rule is not to risk more than 1-2% of your trading account on a single trade. For example, if you have a $10,000 account, you shouldn’t risk more than $100-$200 on any trade.
Stop-Loss Orders
Stop-loss orders automatically close your trades at a certain price to limit losses. For example, if you’re long on GBP/USD at 1.3000, you might set a stop-loss order at 1.2950. If the price drops to 1.2950, your trade will automatically close, limiting your loss.
Take-Profit Targets
Take-profit targets are levels at which your trade will automatically close to lock in profits. For example, if you’re short on EUR/USD at 1.2000 and expect the price to fall to 1.1900, you could set a take-profit order at 1.1900.
Risk-Reward Ratio
The risk-reward ratio compares a trade’s potential loss (risk) to its potential profit (reward). A commonly used risk-reward ratio is 1:3, meaning for every dollar risked, three dollars are expected in return. This ensures that even if you have more losing trades than winning ones, you can still be profitable with a long position overall.

Diversification
Diversification involves spreading your trades across different currency pairs to reduce risk. If one trade goes wrong, the losses can be offset by gains in other trades. Remember, don’t put all your eggs in one basket.
Correlation Analysis
Analyzing currency correlation can help manage risk. Some currency pairs are positively correlated (they move in the same direction), and others are negatively correlated (they move in opposite directions). Understanding these correlations can help you avoid overexposure to a single currency.
Avoid Overtrading
Overtrading, or making too many trades at once, can increase risk and lead to significant losses. Be patient and only enter trades when your strategy signals an opportunity. Quality of trades always trumps quantity.
Risk Assessment
Before entering any trade, assess the potential risks. Consider economic news events, market volatility, and technical analysis indicators. This will help you make informed decisions and manage risk effectively.
Adapt to Market Conditions
Market conditions can change rapidly. Always be ready to adapt your line trading strategy to reflect these changes. For example, in volatile markets, you might want to set wider stop-losses to avoid being stopped out by short-term price fluctuations.
Leverage Control
Leverage allows you to control a large amount of currency with a small amount of capital. While this can amplify profits, it can also amplify losses. It’s crucial to use leverage wisely and not take on more risk than you can afford to lose.
Trade Size Gradation
Consider increasing or decreasing your trade size based on the success of your recent trades. If you’ve had a string of losses, it might be wise to decrease your trade size until your performance improves. Conversely, gradually increasing your trade size can maximize profits if you’re consistently profitable.
Monitor and Review
Monitor your trades and review your performance regularly. Look for patterns or recurring issues that may be affecting your results. This continuous evaluation can help you refine your line trading strategy and improve your risk management.
Emotional Discipline
Trading decisions should be based on logic, not emotion. Fear and greed can lead to risky behaviour like moving stop-losses or chasing losses. Stay disciplined, stick to your trading plan, and don’t let emotions dictate your decisions.
Choosing the Right Brokerage

Selecting the right brokerage is a crucial step in your trading journey. Here’s what you should consider to make an informed choice:
Regulation and Licensing
Ensure your chosen brokerage is regulated by a reputable authority, such as the Financial Conduct Authority (FCA) in the UK or the Commodity Futures Trading Commission (CFTC) in the US. This will offer you a level of protection and ensure the brokerage adheres to fair trading practices.
Trading Platform
The trading platform should be user-friendly and equipped with all the tools for analysis and trade execution. Check if it offers features like charting tools, real-time data, trade alerts, and more. Platforms like MetaTrader 4 and MetaTrader 5 are popular choices among traders.

Available Currency Pairs
Look for a brokerage that offers a wide range of currency pairs, including major, minor, and exotic pairs. This allows you to trade according to your strategy and market interest.
Spreads and Fees
Compare spreads (the difference between buy and sell prices) and other fees across brokerages. Lower spreads mean lower trading costs. Be aware of any hidden fees like inactivity fees or withdrawal fees.
Leverage Options
Leverage can magnify your profits but also your risk appetite and losses. Check the leverage options the brokerage offers and ensure they align with your risk tolerance and trading strategy.
Deposit and Withdrawal Options
A good brokerage should provide various deposit and withdrawal options, such as bank transfers, credit/debit cards, or e-wallets. The process should be straightforward and swift, with minimal fees.
Educational Resources
If you’re a beginner, look for a brokerage that provides educational resources like webinars, tutorials, articles, and e-books to help you learn about forex trading.
Demo Account
A demo account allows you to practice trading with virtual money. This is a great way to familiarize yourself with the trading platform and test your trading strategy without risking real money.
Execution Quality
Check how quickly and accurately the brokerage executes trades. Fast and precise execution can make a significant difference in fast-moving forex markets.
Mobile Trading
If you prefer trading on the go, ensure the brokerage offers a robust mobile trading app compatible with your device.
Regulatory Compliance
The brokerage should comply with regulatory requirements, such as maintaining adequate capital, segregating client funds from operational funds, and providing regular audit reports.
Account Types
Consider the account types offered by the brokerage. These might include standard accounts, mini or micro accounts, and VIP accounts. Choose one that suits your trading style and capital.
Community and Reviews
Check out reviews and feedback from other traders. Online trading communities and forums can provide valuable insights into the brokerage’s reputation and customer service quality.
Additional Services
Some brokerages offer additional services like social trading, where you can copy trades from experienced traders, or automated trading, where trades are executed automatically based on predefined criteria. Consider if these services align with your trading objectives.
Remember, the right brokerage for you will depend on your individual needs and trading goals. Take time, research, and choose a brokerage that best supports your trading journey.
Who Are the Best Forex Brokers?

Here are some trusted multiregulated forex brokers suitable for all styles of trading :
OneRoyal: Known for its social trading platform, OneRoyal offers many educational resources and a convenient demo account for practice.
IronFx: This broker provides a simple platform and a risk management tool, helping you better control your trading risks.
Admirals: Admirals stands out with exceptional customer support and a wide range of educational resources.
ActivTrades: Offers a user-friendly platform, extensive educational resources, and versatile demo accounts.
EightCap: EightCap wraps it up with an intuitive platform, top-notch educational materials, and an effective customer support team.
What are Bollinger Bands

A Bollinger Band is a technical analysis tool developed by John Bollinger in the 1980s. It measures market volatility and provides relative definitions of a market’s high and low prices.
The Bollinger Band consists of three key levels.
- The middle line is a simple moving average (often set to 20 periods).
- An upper band is typically two standard deviations above the middle line.
- A lower band typically has two standard deviations below the middle line.
In a less volatile market, the bands contract, moving closer to the average price. In a more volatile market, the bands expand, moving away from the average price.
Traders can use Bollinger Bands in several ways:
- Such distribution identifies overbought or oversold conditions: If the price reaches the upper band, the market may be overbought (and due for a price correction), and if it reaches the lower band, it may be oversold (and due for a price increase).
- To spot potential price reversals, the price continually touching one band could indicate a trend. If the price moves towards the other band, it could signal a potential price reversal.
- To gauge market volatility: Wide bands indicate high volatility, while narrow bands indicate low volatility.
Remember, while Bollinger Bands can be a helpful tool, they should be part of a broader trading strategy that incorporates other indicators and aspects of technical analysis for specific investment objectives.
Read These Next
Creating an Effective Forex Trading Plan
The Winning Mindset for Weekend Forex Trading
Essential Education for Taxes on Forex Trading
What is a Margin Level in Forex?
Forex Breakout Strategy: A Guide for Profitable Trading
Forex Consolidation Breakout Strategies for Traders
Master Forex Flag Pattern Strategy for Profit
Disclaimer:
All information has been prepared by TraderFactor or partners. The information does not contain a record of TraderFactor or partner’s prices or an offer of or solicitation for a transaction in any financial instrument. No representation or warranty is given as to the accuracy or completeness of this information. Any material provided does not have regard to the specific investment objective and financial situation of any person who may read it. Past performance is not a reliable indicator of future performance.