
Forex chart patterns are invaluable tools for traders in the foreign exchange market. These patterns provide insights into the market’s behavior, allowing traders to make informed decisions and improve their chances of success. One such pattern is the EURUSD chart pattern, which involves analyzing the relationship between the Euro (EUR) and the US Dollar (USD). By understanding this pattern, traders can gain valuable insights into the future direction of these currencies and potentially profit from their trades.
Example: Let’s say you are a forex trader who is interested in trading the EURUSD currency pair. You notice a recurring chart pattern known as the double top formation on the EURUSD chart. This pattern occurs when the price reaches a peak, retraces, and then forms another peak at a similar level. It indicates a potential reversal in the market, with the price likely to drop after reaching the second peak.
Based on your understanding of this pattern, you decide to place a short trade, anticipating a decline in the EURUSD exchange rate. You set your stop-loss order just above the second peak to limit potential losses if the price continues to rise. As predicted, the price eventually drops, and you exit the trade at a profit.

By recognizing and understanding forex chart patterns like the double top formation in the EURUSD pair, you can effectively identify potential trading opportunities and enhance your chances of success in the forex market.

Types of Forex Chart Patterns
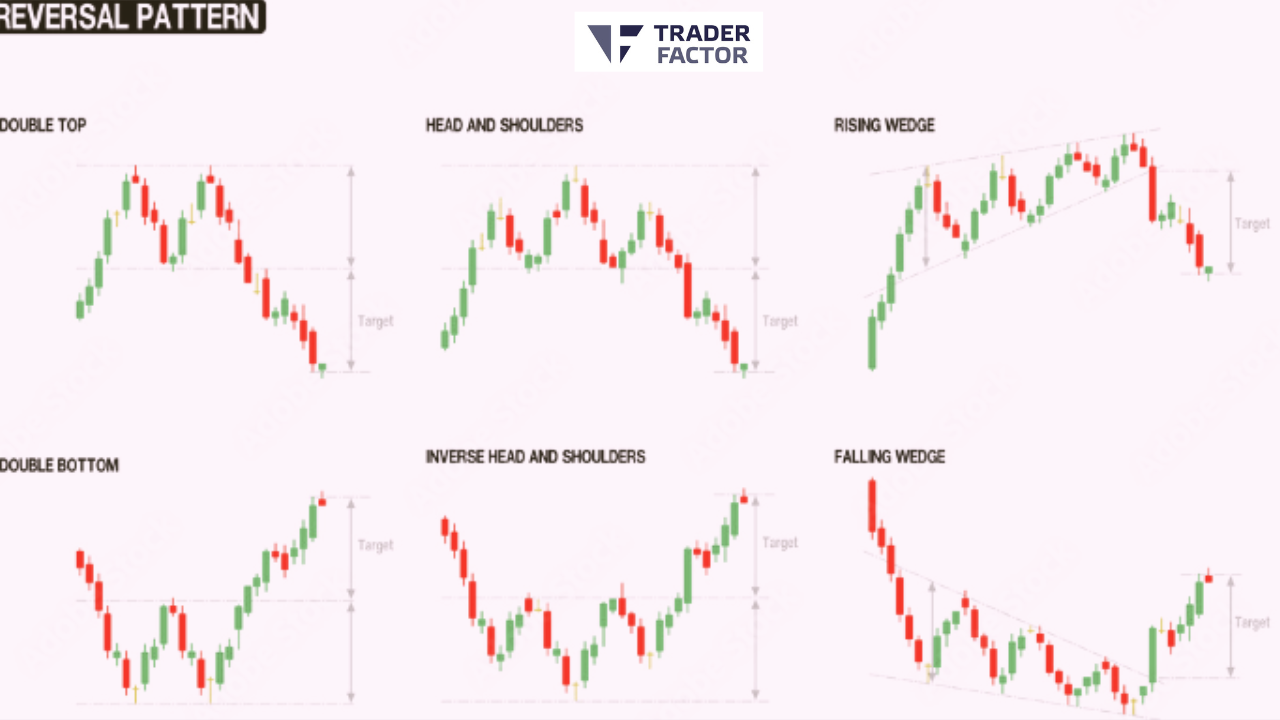
1. Head and Shoulders Pattern
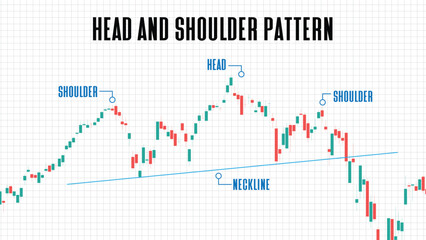
The head and shoulders pattern is a reversal pattern that signals a potential downward trend or change. It consists of three peaks, with the middle one (the head) being higher than the other two (the shoulders). Traders look for a break below the neckline, which confirms the pattern.
Example 1
EUR/USD has been in an uptrend for several months. It forms a head and shoulders pattern, with the head around 1.2000 and the shoulders around 1.1800. A break below the neckline at 1.1600 confirms the pattern, indicating a potential trend reversal to the downside.
Example 2
GBP/JPY forms a head and shoulders pattern after a prolonged uptrend. The left shoulder is formed near 156.00, the head around 160.00, and the right shoulder around 158.00. A break below the neckline at 154.00 suggests a potential downtrend.

2. Double Top Pattern
The double top pattern occurs when an asset reaches a peak, declines, and then rallies to form a second peak at a similar level. It indicates a potential reversal in the market, with the security’s price more likely to drop after reaching the second peak.
Example:
USD/CAD reaches a peak at 1.2800, declines, and then rallies to form a second peak around the same level. A break below the support level at 1.2500 could confirm the double top pattern, indicating a potential reversal and a decline in the price.
3. Double Bottom Pattern
The double bottoms pattern is the exact opposite side of the double top pattern. It consists of two successive lows followed by a rally. This pattern suggests a potential trend reversal, with the price likely to rise after reaching the second bottom.
Example:
AUD/USD forms a double bottom pattern as it reaches a low at 0.7000 and then rallies. After a subsequent decline, it forms another low around 0.7000. A break above the resistance level at 0.7200 could confirm the double bottom pattern, suggesting an upward trend.

4. Triangle Pattern
The triangle pattern is a consolidation pattern that typically forms when stock price reaches lower highs and higher lows, creating a triangle shape on the chart. the triangle formation of price patterns often suggests that market participants are uncertain about the next direction and often leads to a breakout in either direction.
Example
USD/JPY forms a triangle pattern as it creates lower highs around 110.00 and higher lows around 108.00. Traders are uncertain about the next direction. A breakout above 110.50 or below 107.50 could signal the start of a new trend.
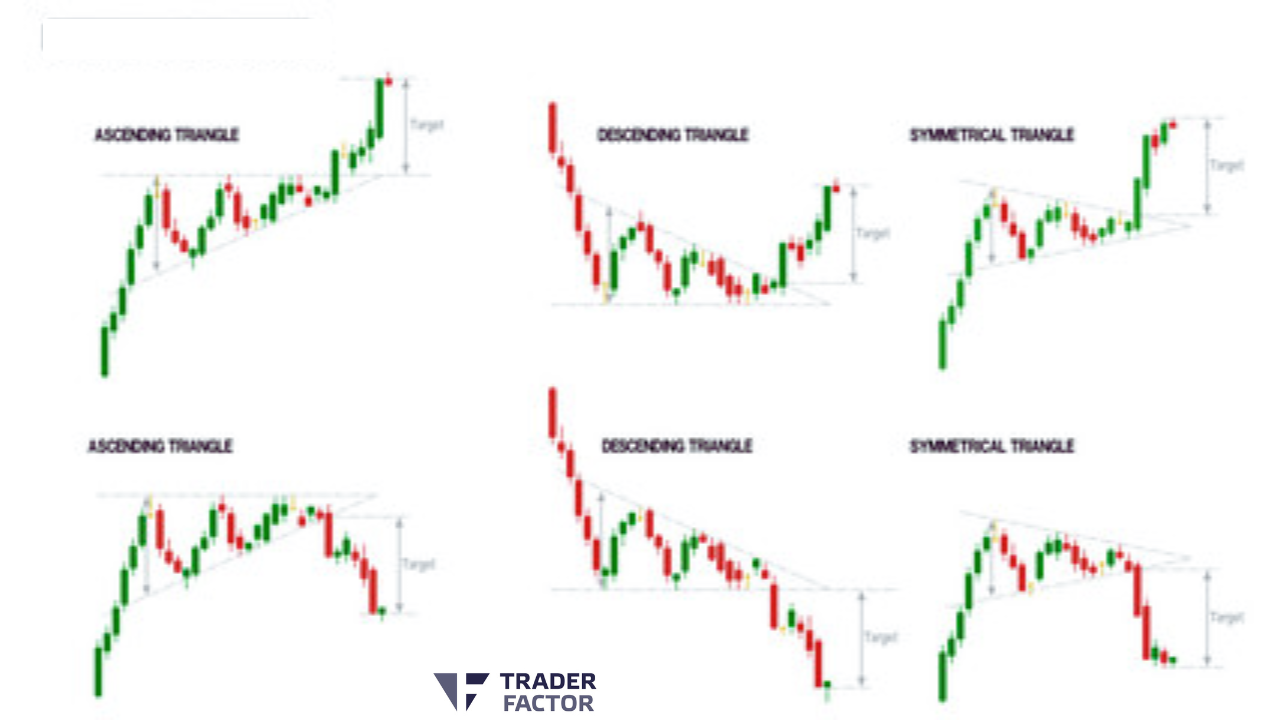
Ascending triangle patterns and descending triangle patterns are two common chart patterns used in technical analysis to identify potential breakouts or trend reversals. Here’s an explanation of each pattern:
Ascending Triangle Pattern
The ascending triangle is a bullish continuation pattern that forms during an uptrend. It is characterized by a horizontal resistance line and an upward-sloping support line. Traders consider this pattern significant because it suggests that buying pressure is gradually overpowering selling pressure, leading to a potential breakout to the upside.
The resistance line is formed by multiple highs, indicating a level where sellers have historically been active. The next support and resistance line connects a series of higher lows, demonstrating increasing buying pressure. When the price eventually breaks above the resistance level with increased volume, it may signal a potential entry point for long positions.

Example
In the EUR/USD currency pair, an ascending triangle pattern forms as the price consolidates with a horizontal resistance line at 1.2000 and an upward-sloping support line. Once the price breaks above the resistance level, it suggests a potential bullish continuation.
Descending Triangle Pattern
The descending triangle is a bearish formation pattern that forms during a downtrend. It is characterized by a horizontal support line and a downward-sloping resistance line. Traders consider this pattern significant because it suggests that selling pressure is gradually overpowering buying pressure, leading to a potential breakdown to the downside.
The support line is formed by multiple lows, indicating a level where buyers have historically been active. The resistance line connects a series of lower highs, demonstrating increasing selling pressure.
When the price eventually breaks below the support level with increased volume, it may signal a potential entry point for short positions.

Example
In the USD/JPY currency pair, a descending triangle pattern forms as the price consolidates with a horizontal support line at 110.00 and a downward-sloping resistance line. Once the price breaks below the support level, it suggests a potential bearish continuation.
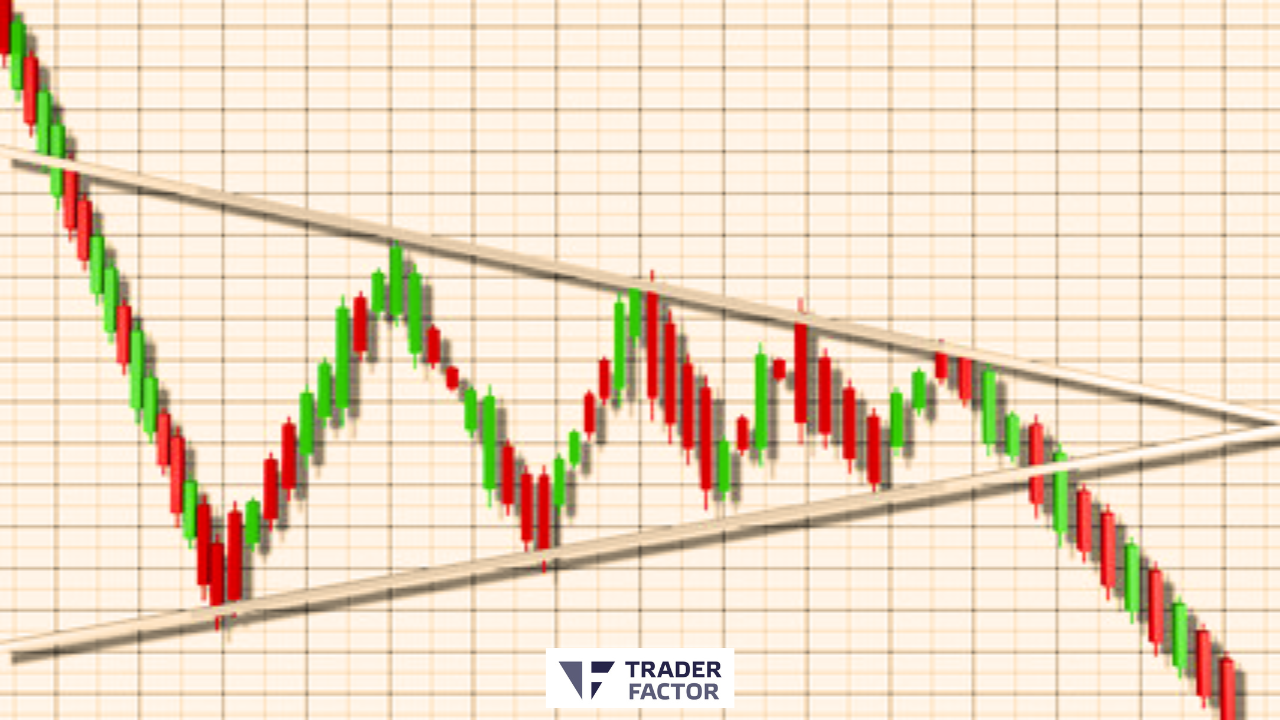
Symmetrical Triangle Pattern
The symmetrical triangle pattern is a common chart pattern used in technical analysis to identify potential breakouts or trend and continuation patterns. The symmetrical triangles are formed by two converging trendlines, with one existing trend line connecting a series of lower highs and the other trend lines connecting a series of higher lows.
The converging trendlines create a symmetrical triangle patterns top-like shape, hence the name “symmetrical triangle.” This pattern represents a period of consolidation or indecision in the market, where the price range gradually narrows as buyers and sellers struggle for control.
As the price approaches the apex of the triangle, it typically indicates a decrease in volatility and a potential breakout opportunity. Traders pay attention to the direction of the breakout from the triangle. A breakout from descending triangle to the upside suggests a potential bullish continuation, while a breakout to the downside suggests a potential bearish continuation.
Example: In a stock chart, a symmetrical triangle pattern forms as the price consolidates with a lower trendline connecting higher lows and an upper trendline connecting lower highs. Once the price breaks out of the triangle pattern with significant volume, it provides a potential trading opportunity.

5. Wedge Pattern
The wedge pattern is similar to the triangle pattern and the same pattern completes triangle patterns also represents a consolidation phase. It is characterized by converging trendlines that move in the same direction, either upward or downward. A breakout from the wedge pattern can signal the start of a new converging trend lines.
Example
GBP/USD forms a rising wedge pattern as it creates higher highs and higher lows within converging trendlines. A break below the lower trendline could indicate a potential downtrend, while a break above the upper trendline may suggest an upward breakout.
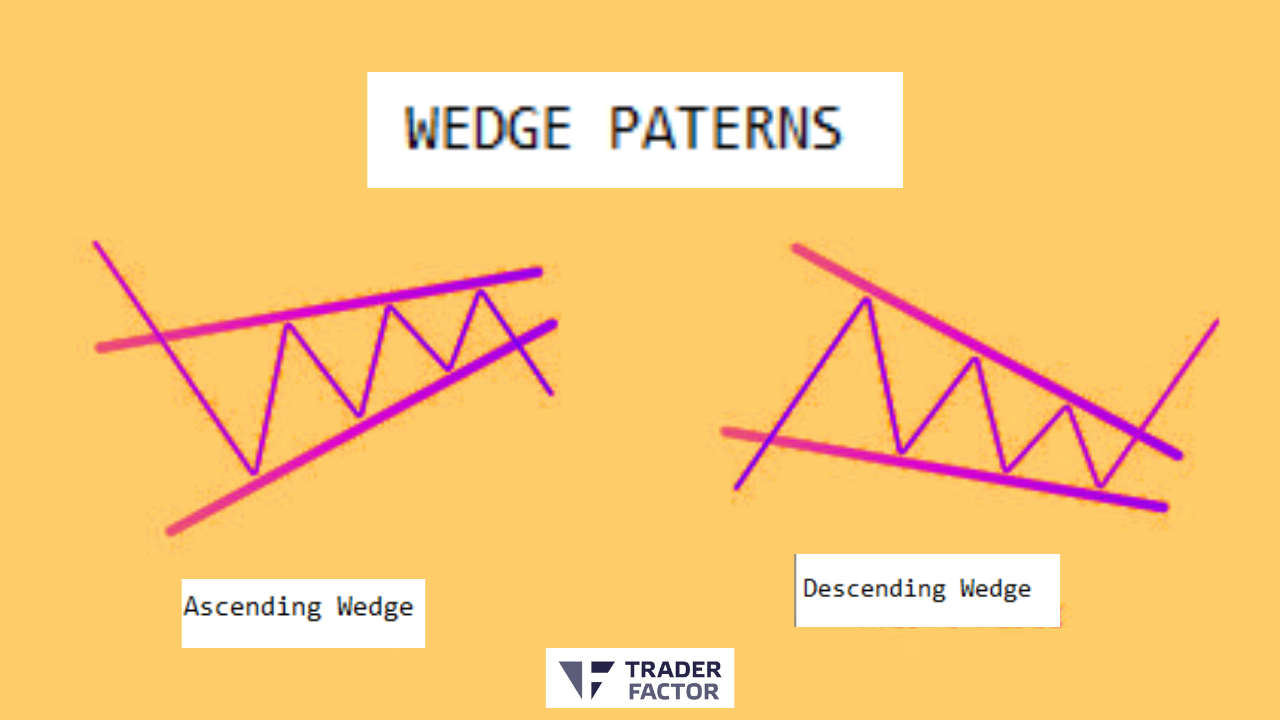
Sure! Ascending and descending wedge patterns are two common chart patterns used in technical analysis to identify potential trend reversals or breakouts.
Ascending Wedge
The ascending wedge is a bearish reversal pattern that forms during an uptrend. It is characterized by a series of higher highs and higher lows, with converging trendlines. The upper trendline connects the highs, indicating the resistance level where sellers have been active. The lower trendline connects the higher lows, demonstrating increasing buying pressure.
As the price continues to make higher highs but with diminishing upward momentum, the range between the trendlines narrows, creating a wedge-like shape. Traders interpret chart formation of this bearish pattern as a potential trend reversal to the downside. A break below the lower trendline with increased volume may signal a confirmation of the bearish reversal, providing a potential entry point for short positions.

Example
In a stock chart, an ascending wedge pattern forms as the price consolidates with an upper trendline connecting higher highs and a lower trendline connecting higher lows. Once the price breaks below the upper horizontal line and the lower trendline, it suggests a potential bearish reversal.
Descending Wedge
The descending wedge or a falling wedge is a bullish reversal pattern that forms during a downtrend. It is characterized by a series of lower highs and lower lows, with converging trendlines. The upper trendline connects the lower highs, indicating the resistance level where sellers have been active. The lower trendline connects the lower lows, demonstrating decreasing selling pressure.
As the price continues to make lower lows but with diminishing downward momentum, the range between the trendlines narrows, creating a wedge-like shape.
Traders interpret a continuation patterns this pattern as a potential trend reversal to the upside. A break above the upper trendline with increased volume may signal a confirmation of the bullish reversal, providing a potential entry point for long positions.
Example
In a cryptocurrency chart, a descending wedge pattern forms as the price consolidates with an upper trendline connecting lower highs and a lower trendline connecting lower lows. Once the price breaks above the resistance lines the upper trendline and lower line, it suggests a potential bullish reversal.
6. Flag Pattern

The flag pattern is a continuation pattern that occurs after a strong price movement. It is characterized by a rectangular pattern that slopes against the prevailing down trend line. The flag pattern suggests that the previous up trend line is likely to continue after a brief consolidation.

Example:
USD/CHF experiences a sharp rally, followed by a period of consolidation where the price forms a flag pattern. The flagpole represents the initial rally, while the flag itself is a rectangular pattern. A breakout above the upper boundary of the flag could signal a continuation of the previous uptrend.
7. Pennant Pattern
The pennant pattern is another continuation pattern that forms after a strong price movement. It is characterized by a small symmetrical triangle shape. Like the flag pattern, the pennant continuation pattern also suggests a continuation of the previous trend after a period of consolidation.

Example:
NZD/USD forms a pennant pattern after a strong upward move. The price consolidates within a symmetrical triangle shape. Traders anticipate a continuation of the previous bullish trend if there is a breakout above the upper boundary of the pennant.
8. Candlestick Patterns
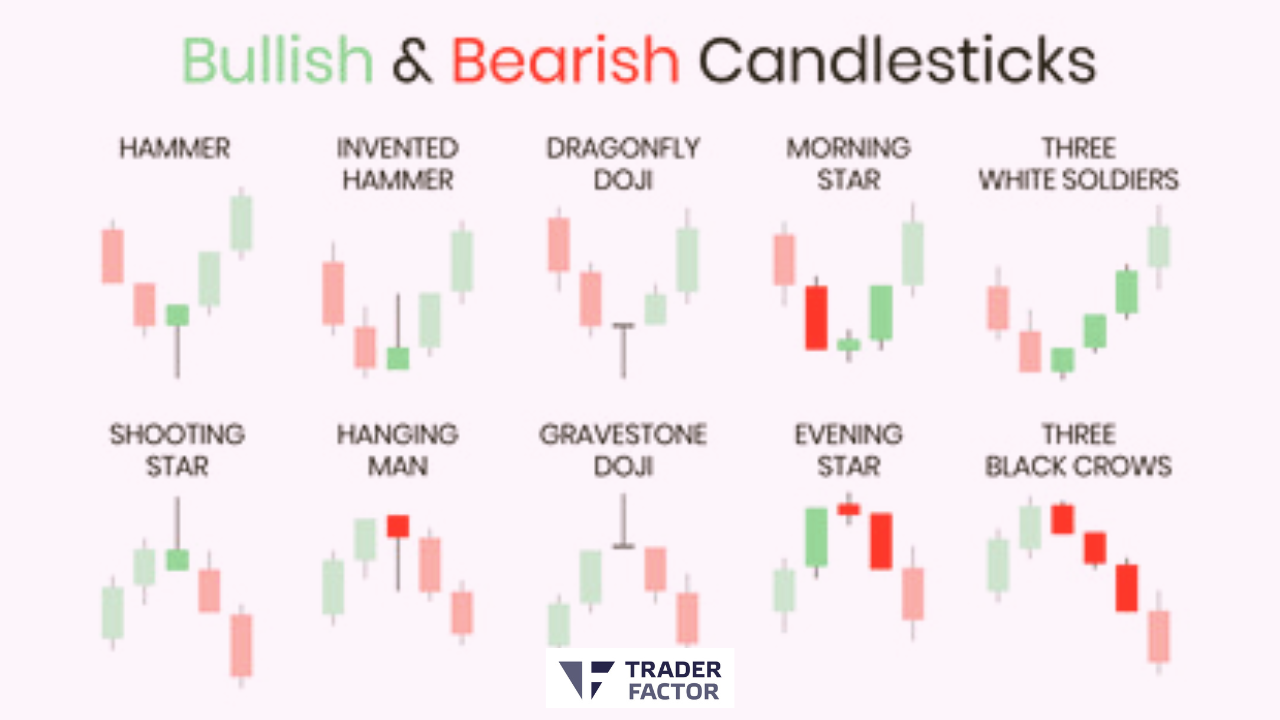
Candlestick patterns are formed by the arrangement of individual candlesticks on a chart. Examples of reversal patterns include doji, hammer, engulfing, shooting star, and spinning top patterns. These patterns provide insights into market sentiment prevailing trend, and can signal potential reversals or continuations.
Hammer
The hammer is a bullish reversal pattern that forms after a downtrend. It has a small body near the top of the candle and a long lower shadow (wick) that is at least twice the length of the body. The presence of a long lower shadow indicates that buyers stepped in to push the price higher after an initial decline.
Inverted Hammer
The inverted hammer is also a bullish reversal pattern but forms at the bottom of a downtrend. It has a small body near the bottom of the candle and a long upper shadow. The presence of a long upper shadow indicates that buyers attempted to push the price higher after an initial decline.
Morning Star
The morning star is a bullish reversal pattern that consists of three candles. It forms during a downtrend. The first candle is a bearish one, followed by a small-bodied candle with a gap down. The third candle is a bullish one that closes above the midpoint of the first candle.

Three White Soldiers
The three white soldiers pattern is a bullish reversal pattern. It consists of three consecutive bullish candles with higher highs and higher lows. Each candle opens within the previous candle’s body and closes near its high.
Shooting Star
The shooting star is a bearish reversal pattern that forms at the top of an uptrend. It has a small body near the bottom of the candle and a long upper shadow. The presence of a long upper shadow indicates that sellers tried to push the price lower after an initial rally.
Hanging Man
The hanging man is a bearish reversal pattern that forms at the top of an uptrend. It has a small body near the top of the candle and a long lower shadow. The presence of a long lower shadow indicates that sellers tried to push the price lower after an initial rally.
Gravestone Doji
The gravestone doji is a bearish reversal pattern that forms at the top of an uptrend. It has a small body near the bottom, and its opening and closing prices are at or very close to the low of the session. This pattern indicates that sellers were able to push the price down significantly from its high.
Evening Star
The evening star is a bearish reversal pattern that consists of three candles. It forms during an uptrend. The first candle is a bullish candle, followed by a small-bodied candle with a gap up. The third candle is a bearish one that closes below the midpoint of the first candle.
Three Black Crows
The three black crows pattern is a bearish reversal pattern. It consists of three consecutive bearish candles with lower highs and a bearish signal with lower lows. Each candle opens within the previous candle’s body and closes near its low.
How to Use Chart Patterns for Trading

Evaluating the Risk/Reward Ratio of the Forming Signal
When using chart patterns for trading, it’s crucial to evaluate the risk/reward ratio associated with the forming signal. This involves assessing the potential profit target relative to the potential loss if the trade does not work out as expected.
Illustration
Let’s consider a descending triangle pattern forming on a stock chart. The resistance line acts as a strong level where sellers have historically been active, while the support line connects a series of lower lows. To evaluate the risk/reward ratio, a trader would measure the distance between the entry point (breakdown below support) and the profit target (typically projected by measuring the height of the pattern).
If the potential profit target exceeds the potential loss by a favorable ratio, such as 2:1 or higher, it may be considered a viable trade setup.

Opening Positions Based on Price Action
Price action analysis plays a significant role in utilizing chart patterns for a trading strategy. It involves observing how the price behaves around key levels and using past price action patterns used to make informed trading decisions.
Illustration
Let’s consider an ascending wedge pattern forming on a currency pair. As the price narrows within the converging trendlines, a trader would closely monitor price action for potential breakout or breakdown signals. They may look for confirmation through candlestick patterns, volume analysis, or other technical indicators.
If the price breaks above the upper trendline with strong momentum, it may signal a potential entry point for long positions based on the bullish bias of the pattern.
Setting Price Targets for Conditional Orders
Setting price targets is an integral part of any trading strategy along with chart patterns. By establishing predetermined levels at which to exit a trade, traders can manage their risk and ensure they capture a reasonable portion of the anticipated price move.

Illustration
Suppose a trader identifies an ascending triangle pattern on a cryptocurrency chart. After a breakout above the resistance level, they may set a price target based on the measured move technique. By measuring the height of the triangle pattern and projecting it upward from the breakout point, they can determine a potential price target to aim for. This allows them to place conditional orders to automatically exit the trade at the desired price level.
Adapting to Changing Market Conditions
Lastly, it’s crucial to adapt to changing market conditions when using chart patterns for trading. Markets are dynamic, and patterns may not always play out as expected. Flexibility and the ability to adjust trading strategies are essential.
Illustration
For instance, let’s consider a trader who identifies a symmetrical triangle pattern forming on an index chart. However, if the price remains within the pattern for an extended period with no clear breakout or breakdown of bullish chart pattern, the trader may need to reassess their position. They might consider widening the stop-loss level or exiting the trade if the pattern loses its validity.
Disadvantages of Trading with Chart Patterns

Chart Patterns Can Deliver False Signals
One of the disadvantages of trading with chart patterns is that they can deliver false signals. This means that the pattern may appear to be forming and provide a signal for a particular trade setup, but it does not result in the expected outcome. False signals can occur due to various factors such as market volatility, market manipulation, or unexpected events that disrupt the pattern’s validity.
For example, a trader identifies a double top pattern on a stock chart, which typically indicates a potential trend reversal to the downside. They enter a short position based on this pattern. However, instead of the expected price decline, the stock breaks above the previous highs and continues its upward trend. In this case, many traders say the double top pattern delivered a false signal, leading to a losing trade.
Chart Patterns Can Inspire Subjectivity
Another disadvantage of trading with chart patterns is that they can inspire subjectivity. Different traders may interpret the same pattern differently, leading to varying trading decisions. This subjectivity can introduce confusion and inconsistency in trading strategies.
For instance, consider a symmetrical triangle pattern forming on a forex chart. Traders may have different opinions on where to draw the trendlines or what constitutes a valid breakout. This subjectivity can create discrepancies in trade entries and exits, making it challenging to establish clear rules and guidelines for trading with chart patterns.
Chart Patterns Can Sometimes Take a Long Time to Form
Patience is required when trading with chart patterns, as they can sometimes take a long time to form. Waiting for a bullish or bearish chart pattern to fully develop before taking a trading position can test a trader’s patience and discipline.
For example, a trader identifies a head and shoulders pattern on a cryptocurrency price chart. However, the right shoulder takes several weeks to form, causing frustration and potentially missed trading opportunities during that time. This delay in pattern formation can impact a trader’s ability to take timely actions and capitalize on potential price movements.
Most Chart Patterns Are Only Effective for the Short Term
Most chart patterns are primarily effective for short-term trading rather than long-term investing. They are often used by day traders or swing traders who aim to capture shorter-term price movements.
For instance, a trader identifies a bullish flag pattern on a commodity futures chart. The flag pattern typically represents a temporary pause in an already existing trend or uptrend before the price continues its existing trend of upward movement. This pattern is more suited for short-term trading strategies that capitalize on quick price swings rather than long-term investment positions.
Tips for Trading Chart Patterns Effectively

To trade chart patterns effectively, there are several tips you can follow. By implementing these strategies, you can enhance your trading approach and potentially improve your success rate. Here are some tips to consider:
Switch to Line Charts
When analyzing chart patterns, it can be helpful to switch to line charts. Line charts provide a simplified view of price movements by connecting closing prices over a specific period. This helps to smooth out the noise and focus on the overall trend.
For example, if you’re identifying a head and shoulders pattern on a candlestick chart, switching to a line chart can make it easier to visualize the pattern’s structure and identify key support and resistance levels.
Confirm Chart Pattern Signals with Candlestick Patterns
Candlestick patterns can provide valuable confirmation signals for chart patterns. By analyzing the individual candlesticks within a pattern, you can gain insights into market sentiment and potential reversals.
For instance, if you observe a bearish engulfing candlestick pattern forming at the resistance level of a descending triangle pattern, it could indicate a stronger likelihood of a downward breakout from current trend. This confirmation using candlestick patterns can increase the confidence in your chart pattern analysis.
Combine Chart Patterns with Technical Indicators
To strengthen your analysis, consider combining chart patterns with technical indicators. Technical indicators can provide additional insights into market trends, momentum, and potential price reversals.
For example, if you identify a bullish flag pattern on a stock chart, you can complement your analysis by using indicators like the Relative Strength Index (RSI) or Moving Average Convergence Divergence (MACD). These indicators can help confirm the strength of the pattern and provide entry and exit signals.
Trading Chart Patterns Using Conditional Orders
To execute trades based on chart patterns more effectively, consider using conditional orders. Conditional orders allow you to set specific criteria for entry and exit points, automating your trading process.
For instance, if you identify a breakout above the resistance level of a symmetrical triangle pattern, you can place a conditional order to buy the asset once it reaches a certain price. This ensures that you don’t miss out on potential trading opportunities while actively monitoring the market.
Chart Pattern Recognition Tools

Chart pattern recognition tools are software or platforms that automatically identify and highlight chart patterns on price charts. These tools can help traders save time and improve their analysis by quickly identifying potential trade setups.
Here are some popular chart pattern recognition tools:
TradingView
TradingView is a widely used online platform that provides advanced charting capabilities, technical analysis tools, and chart pattern recognition features. It offers a user-friendly interface where traders can easily identify various chart patterns like triangles, rectangles, head and shoulders, and more. TradingView also allows users to customize their charting preferences and collaborate with other traders in the community.
Autochartist
Autochartist is a chart pattern recognition tool that scans multiple markets and timeframes to identify chart patterns automatically. It utilizes advanced algorithms and pattern recognition technology to detect patterns such as triangles, wedges, channels, and Fibonacci patterns. Autochartist provides real-time alerts and notifications, helping traders stay updated with potential trade opportunities.
Patternsmart
Patternsmart is a dedicated chart pattern recognition software that focuses on identifying various chart patterns in real-time. It offers a wide range of recognized patterns, including harmonic patterns, Elliott Wave patterns, candlestick patterns, and more. Patternsmart provides customizable scanning options and alerts, allowing traders to tailor their pattern searches based on their preferred trading strategies.
MetaTrader 4 and MetaTrader 5
MetaTrader 4 (MT4) and MetaTrader 5 (MT5) are popular trading platforms widely used by forex and CFD traders. These platforms come with built-in charting tools that include chart pattern recognition capabilities. Traders can manually or automatically scan the charts for patterns and receive real-time alerts when a pattern is detected. MT4 and MT5 also offer a wide range of technical indicators and analytical tools to enhance the trading experience.
ProRealTime
ProRealTime is a comprehensive charting and technical analysis platform that offers advanced features, including chart pattern recognition. Traders can easily scan multiple markets and timeframes for various chart patterns and receive real-time alerts. ProRealTime also provides a wide range of drawing tools, technical indicators, and backtesting capabilities to support in-depth analysis.
MarketSmith
MarketSmith is a charting and stock research platform designed specifically for investors and traders. It offers chart pattern recognition features that automatically detect various patterns, including cup and handle, double tops and bottoms, flags, and more. MarketSmith provides detailed fundamental and technical analysis tools to help traders make informed investment decisions.
ForexScanner
ForexScanner is a specialized chart pattern recognition tool designed for forex traders and technical analysts. It scans multiple currency pairs and timeframes to identify various chart patterns, such as triangles, wedges, and head and shoulders patterns. ForexScanner offers customizable scanning options and provides visual and audio alerts when a pattern is detected.
Read These Next
Creating an Effective Forex Trading Plan
The Winning Mindset for Weekend Forex Trading
Essential Education for Taxes on Forex Trading
What is a Margin Level in Forex?
Forex Breakout Strategy: A Guide for Profitable Trading
Forex Consolidation Breakout Strategies for Traders
Master Forex Flag Pattern Strategy for Profit
Disclaimer:
All information has been prepared by TraderFactor or partners. The information does not contain a record of TraderFactor or partner’s prices or an offer of or solicitation for a transaction in any financial instrument. No representation or warranty is given as to the accuracy or completeness of this information. Any material provided does not have regard to the specific investment objective and financial situation of any person who may read it. Past performance is not a reliable indicator of future performance.