
Trading the forex markets can be a confusing process. If you’re looking for a way to trade them that helps you focus on the right information, FX Blue Labs has the tools you need. It’s designed for traders, by traders, to help with your execution and analysis.
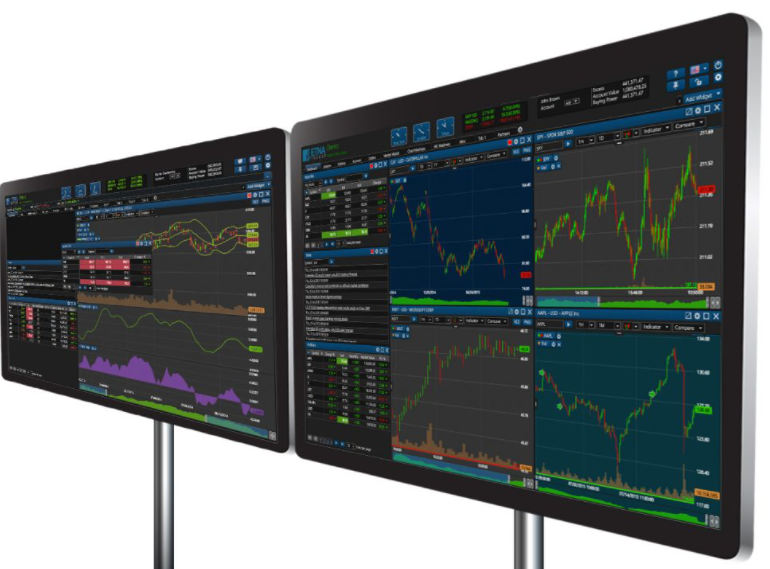
Trade the markets with powerful and easy-to-use widgets.
Customize your trades with cutting-edge widgets, trading apps, and charts.
FX Blue Labs is a leading provider of apps for the FX and CFD markets.
These apps give traders institutional quality tools over and above those provided in the underlying trading platform.
The tools help people trade with top efficiency and confidently make more informed trading decisions, covering every style and need.
Trading Forex With FX Blue Labs Products In Three Steps.
Forex Trading Apps with FX Blue Labs
FX Blue Labs has built a catalogue of multi-platform, multi-lingual, market-informed apps that help brokers promote and distinguish themselves. Additionally, at the same time, it helps traders optimize the way they trade to be more successful. These apps give traders institutional quality tools over and above those provided in the underlying trading platform.
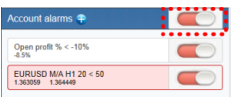
1. Alarm Manager
Essentially, the Alarm Manager is a set of building blocks that you can use to create a completely personalized and automated trading companion. For example, you can use it to take automatic action when an event occurs or when you want to be notified when something is happening on your account and in the markets.
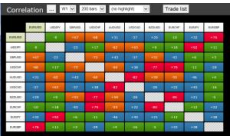
2. Correlation Matrix
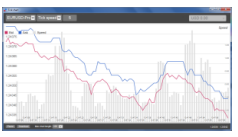
The Correlation Matrix shows the correlation between symbols over a configurable timeframe and some bars, for example, the last 100 H1 bars. It is usually measured on a scale from -100 to +100, where +100 means that the price movements in symbols A and B have been identical (“positive correlation”) and -100 means that the price movements in symbols A and B have been exactly opposite.
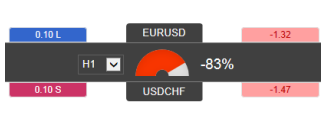
3. Correlation Trader
The Correlation Trader shows the correlation between symbols over a configurable timeframe, e.g. recent H1 bars. The Correlation Trader helps you to identify symbols with strong or weak correlations and to trade emerging differences in the correlation.
4. Excel RTD
The Excel RTD app lets you put real-time data into Excel using only Excel’s RTD function – there’s no need to use macros, programming, or XLL add-ins. Additionally, you can send simple trading commands from VBA code in Excel. The app is supplied with an example spreadsheet that lets you enter up to 5 account numbers and then automatically displays a dashboard of equity and balance, symbol prices, and a consolidated list of open positions.
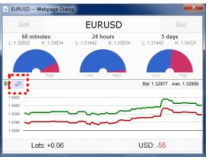
5. Market Manager
Using the Market Manager, you get a bird’s eye view of the fundamental elements to be on top of markets. In addition to the watch list that facilitates price and position monitoring, you can access headline information on several fronts. Open tickets and full editing capabilities also get unlocked, alongside a summary of recent price activity on a symbol.
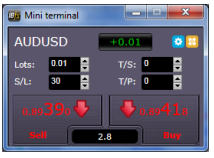
6. Mini Terminal
With the Mini Terminal, you get the large buttons everyone likes to push – this time, for buy and sell actions. The MT4/5 interface will get an additional status indicator that shows your current net position, and you also gain control over lot size, stop-loss, take-profit, and trailing stop.
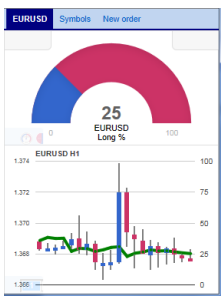
7. Sentiment Trader
As straightforward as it sounds/your biggest sentiment – with direct percentages on current and historical positions in a symbol placed by other traders. These are the long and short sentiments you get.
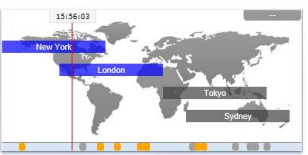
8. Session Map
Time orientation is the keyword here. Your time concerning institutional dealers’ core active hours of trading. Those are the sessions in Sydney, Tokyo, London, and New York.
9. Stealth Orders
Shrouded in mystery, you bypass pending orders and buy or sell at the current market price. The same goes for stop-loss, take-profit, and others – your entry and exit levels are hidden from the market.
10. Tick Chart Trader
Have you ever got a tick? With the Tick Chart Trader, you go over various tick chart styles and learn how to quick-trade with a keyboard or mouse—no historical tick data. Tick chart compilation begins from the moment the app is running.
11. Trade Terminal
Open a chart for any symbol in MT4/5, add the Trade Terminal expert advisor, double-click it from the Navigator list or drag it onto the chart, and voilà – you’ve got yourself a Trade Terminal set up.
Is Forex Trading Profitable?
Read A 2023 Beginners Guide To Buying And Selling Currencies
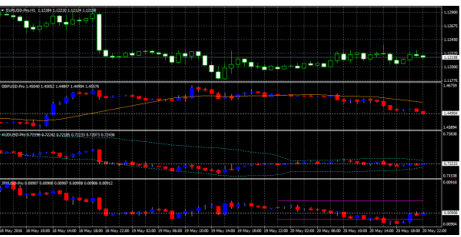
Indicator Package
A package of useful, commonly-requested chart indicators is available for MT4 and MT5.
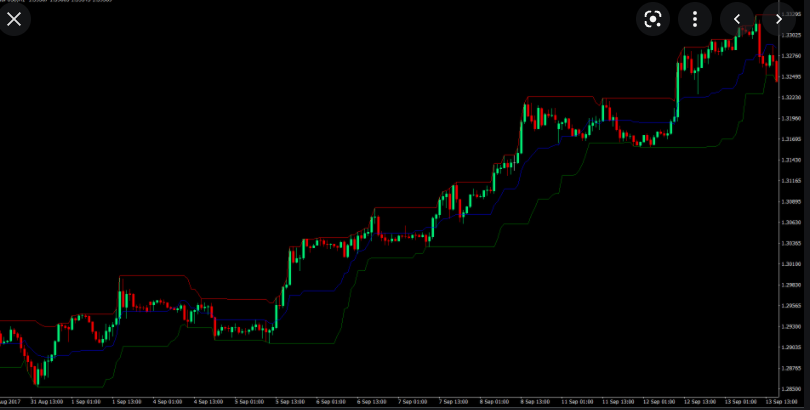
1. Donchian Indicator
Monitor the Donchian channels with standard calculation, such as the average of the last N highs/lows, and configure their range by a percentage or a multiple of ATR or SD. Observe values from a higher timeframe than the current chair and get alerted when the price breaches any of the Donchian values’ two extremes.
2. Chart-in-Chart Indicator
Your chart section compares price action on the main and against the subsidiary chart symbol. There is no limit to the copies of the indicator that you can insert within a chart, as the goal is to have it display all the extra symbols you need.
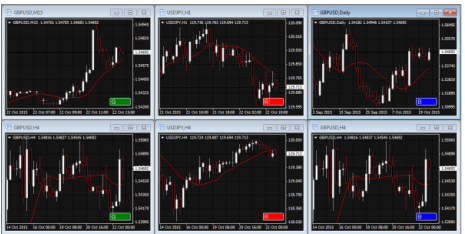
3. Chart Group Indicator
Faster and more efficient view switching compared to the MT4/5 experience. This indicator groups Charts in a way that they are linked, and any changes made to the symbol on one chart are automatically made to all connected charts. Not only that but timeframe synchronization also becomes possible across all charts. Set up as many groups of charts as you wish, and use the colour palette to distinguish between them.
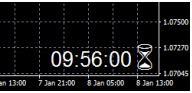
4. Candle Countdown Indicator
It’s the Candle Countdown – the remaining time in the current bar is displayed by this indicator. Before going into Input settings and changing it to display another timeframe, it will show the timeframe of the chart on which it is running. If you want more bar timeframes, create multiple copies of the indicator, and each one can alert you when it is about to end.
5. Bar Changer Indicator
Fully customize your bar data by creating a modified offline version of any chart on MT4. With the Bar Changer, you can adjust the time of each bar, invert or adjust the price to thousands, and select specific periods to exclude parts of each day.
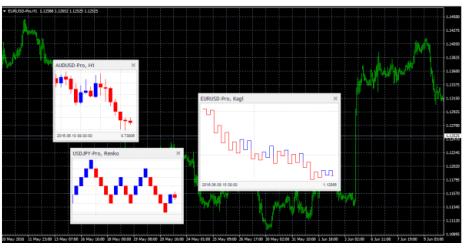
6. Mini Chart Indicator
No more switching between MT4 charts – see price action on multiple instruments and/or timeframes by clicking and dragging to adjust the size of a sub-window chart inside the main one.
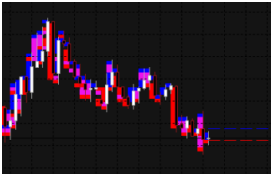
7. Renko Bar Indicator
Draw blocks on normal MT4 time-based charts for visibility over gaps in time frames and create offline charts with only Renko blocks, be they continuous or separated. The indicator can also create an offline MT4 chart containing only the Renko blocks – a more traditional Renko chart that is not time-based like a normal MT4 chart.
8. High-Low Indicator
Pick the number of bars and the timeframe to let the High-Low indicator show you the highs and lows on a chart. With multiple copies, you gain visibility over different levels and can even choose to look at open/close prices. If you prefer to check specific daily time ranges and receive alerts when a price breaches a historic lol or high, this indicator will allow you to do it.
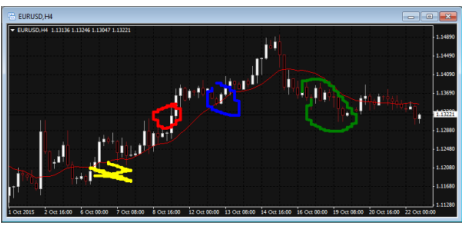
9. Freehand Drawing Indicator
Mark and highlight events on MT4 charts for ongoing live webinars or distribute screenshots that would facilitate the process for your clients. You can draw freely with your mouse, customize colours with your keyboard, and always go a step back if things go south.
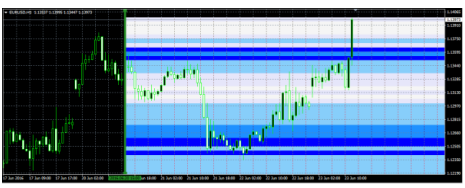
10. Gravity Indicator
When utilising the Gravity Indicator, market activity gravitates around you for effortless monitoring of support and resistance areas based on previous price action. Stronger and weaker activities are colour-coded to show everything clearly. You choose what to focus on – draw from the current time onwards with all price activity to date or set a specific start time only to view the price movements you are looking for.
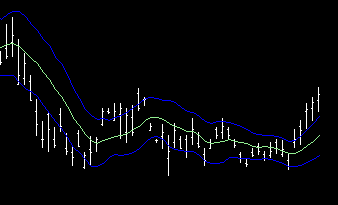
11. Keltner Indicator
Displays Keltner channels, similar to Bollinger’s bands – the difference being in size, with channels being based on ATR instead of the standard deviation. If a price crosses a lower or upper channel, you can be alerted immediately.
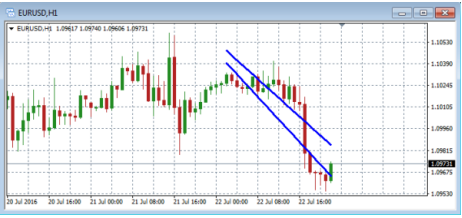
12. Linear Regression Indicator
Plain and simple – you choose the number of N bars, and the Linear Regression indicators show you a best-fit line through their close prices, highs, or lows. All three can be shown simultaneously with multiple copies; forming a channel and selecting different timelines gives you a broader choice of regression.
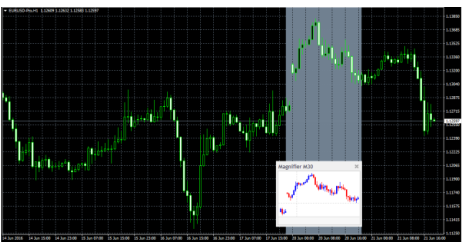
13. Magnifier Indicator
Select the bars you wish to see in detail from a lower timeframe and zoom in on them in a customizable sub-window. Drag the Magnifier and go around the chart, zooming in on any relevant historical periods.
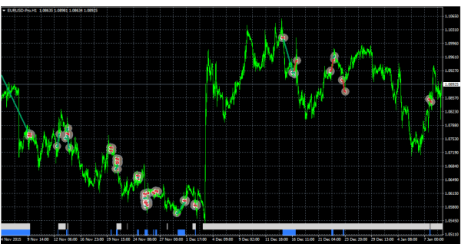
14. Order History Indicator
History of trades – of your trades. This is what the Order History displays. Entry and exit prices and times, bands showing you are in and out points on the market.
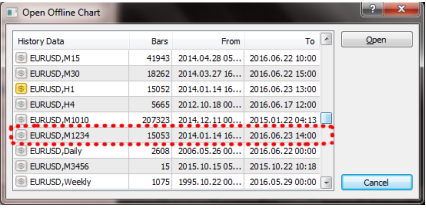
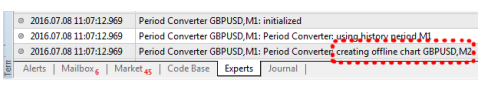
15. Period Converter Indicator
Connect unsupported and native timeframes in an offline MT4 chart, similar to the platform’s in-built PeriodConverter, but with continual updates rather than a one-off data conversion.
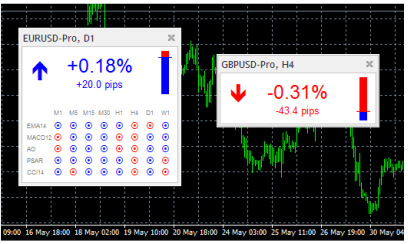
16. Symbol Info Indicator
A symbol status overview in a draggable sub-window inside your MT4 chart shows price changes, distance from recent highs and lows, and extra indicators showing up and down signals of various timeframes. No limit to the number of copies – the more you want to see, the more you get in your combo of settings.
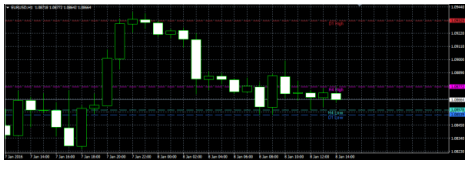
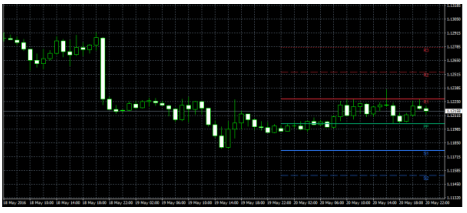
17. Pivot Indicator
The classic pivot calculation is based on historical price, with a twist – 3 support and resistance levels on either side of a central pivot price. Any timeframe goes, and alerts can follow you for rapid reaction to the current price crossing a support or resistance level.
For more information about forex trading or anything related to the foreign exchange market, check out our other articles.

- Beginners Guides and Tips For Forex Trading
- Read A Beginners Guide To Forex Trading
- Mistakes Most Beginner Forex Traders Make and How To Avoid Them
- A 2023 Beginners Guide To Buying And Selling Currencies
- Can You Make Money Trading Forex In 2022 and 2023: Here Are The Facts
Disclaimer:
All information has been prepared by TraderFactor or partners. The information does not contain a record of TraderFactor or partner’s prices or an offer of or solicitation for a transaction in any financial instrument. No representation or warranty is given as to the accuracy or completeness of this information. Any material provided does not have regard to the specific investment objective and financial situation of any person who may read it. Past performance is not a reliable indicator of future performance.