The 10 best technical indicators for forex trading are essential tools for analyzing price movements and market trends. They help traders make informed decisions by interpreting historical price data and predicting possible future outcomes. Whether you’re a beginner learning the basics or a professional seeking advanced insights, these indicators provide valuable assistance in building effective trading strategies.
Table of Contents
ToggleTop Technical Indicators for Forex Trading
| Indicator | Description |
|---|---|
| Moving Average (MA) | Helps smooth out price data by creating a constantly updated average price. |
| Exponential Moving Average (EMA) | Similar to MA but gives more weight to the most recent prices, making it more responsive to new information. |
| Relative Strength Index (RSI) | Measures the speed and change of price movements to identify overbought or oversold conditions. |
| Moving Average Convergence Divergence (MACD) | Shows the relationship between two moving averages of a security’s price. |
| Bollinger Bands | Consists of a middle band (SMA) and two outer bands that are standard deviations away from the middle band, indicating volatility. |
| Stochastic Oscillator | Compares a particular closing price of a security to a range of its prices over a certain period to predict price turning points. |
| Fibonacci Retracement | Uses horizontal lines to indicate areas of support or resistance at the key Fibonacci levels before the price continues in the original direction. |
| Average True Range (ATR) | Measures market volatility by decomposing the entire range of an asset price for that period. |
| Ichimoku Cloud | Provides more data points, offering a more comprehensive view of potential price action. |
| Parabolic SAR (Stop and Reverse) | Highlights the direction in which a market is moving and provides potential entry and exit points. |
10 Best Technical Indicators for Forex Trading
Technical indicators are vital tools in forex trading, providing insights into market trends and price movements. By analyzing historical data, these indicators help traders make informed decisions, enhancing their strategies and potential profitability.
1. Moving Average (MA)
The Moving average forex is one of the simplest yet most effective tools for identifying trends in forex trading. By calculating the average of a currency pair’s price over a specific period, the moving average smooths out fluctuations for a clearer view of the overall trend. It is one of the options frequently found on the Forex indicators list. Simple moving averages (SMA) and exponential moving averages (EMA) are variations traders rely on depending on their goals. For beginners, this tool is easy to interpret and can be found readily on platforms like MT4 or in Forex indicators free download packages.

Types of Moving Averages
There are two main types of moving averages you’ll encounter. The first is the Simple Moving Average (SMA), which gives equal importance to all the data points in your time frame. For instance, if you’re using a 10-day SMA, it will average the closing prices of the last 10 days. This type is straightforward and works well when you want a clearer picture of long-term trends.
The second is the Exponential Moving Average (EMA), which focuses more on recent price data. Because it responds more quickly to price changes, you’ll find it especially helpful in markets known for their volatility. Choosing between these two depends on your trading needs—whether you want a cautious, steady guide like the SMA or the more reactive, adaptive EMA.
Identifying Trends with Moving Averages
When applying moving averages in trading, you use them mainly to identify trends. A simple glance at your chart shows if the price stays consistently above the moving average, indicating an uptrend, or below it, signaling a downtrend. For capturing longer-term trends, consider looking at a 200-day SMA, as it offers insight into broader market movements. On the other hand, a shorter time frame, such as a 20-day EMA, is better suited if you’re focusing on quicker, more frequent trades.
Using Moving Averages as Support and Resistance
Moving averages often act as dynamic support or resistance levels, providing guidance for your trades. During an uptrend, you may notice that the price tends to bounce off the moving average instead of falling below it. Alternatively, in a downtrend, the moving average frequently resists upward movement. Observing these patterns can help you anticipate how the price may react when approaching the moving average, giving you key insights to make informed trading decisions.
Determining Entry and Exit Points
You can use moving averages to identify when to enter or exit a trade. One straightforward method is to monitor how prices behave around the moving average. If the price rises above it, you might see it as a signal to buy, as the market could be shifting upwards. Conversely, if the price drops below the moving average, it often signals a potential downturn, indicating it might be time to sell.
A more advanced approach is the crossover strategy. This method uses two moving averages of different time frames. For example, if a 10-day EMA crosses above a 50-day SMA, it can signal a buy opportunity. When the shorter moving average crosses back below the longer one, it might indicate the time to sell. This approach adds depth to your strategy and helps filter out noise in price movements.
Choosing the Right Time Frame
Selecting the right time frame is crucial for using moving averages effectively. If you’re a day trader, shorter time frames like a 9-day or 20-day EMA may better suit your needs since they adapt more quickly to price changes. If you tend to hold trades for weeks or months, longer time frames, such as the 100-day or 200-day SMA, will likely provide more meaningful insights. To improve accuracy, you can also combine moving averages with other indicators, like the Relative Strength Index (RSI) or the MACD. Additionally, backtesting your strategy on historical data allows you to evaluate its performance before using it in live trading.
Benefits and Limitations of Moving Averages
Moving averages have several benefits. They’re simple to use, making them accessible whether you’re a beginner or an experienced trader. Their versatility allows you to incorporate them into both short- and long-term trading strategies. Perhaps most importantly, they help you cut through market noise, providing clarity and direction.
However, they aren’t without limitations. Because moving averages rely on historical data, they lag behind current price movements, which can delay your response in fast-changing markets. Additionally, sudden price swings or consolidations can result in misleading signals, particularly in volatile conditions.
2. Exponential Moving Average (EMA)
A more dynamic version of the moving average, the exponential moving average assigns greater importance to recent price movements. This makes it an excellent choice for traders who need to react quickly to market changes. Popular among professional forex indicators, EMA is particularly useful for shorter time frames and is a key part of many trading systems. Resources like Forex indicators PDFs often provide step-by-step guides on incorporating EMA into strategies for enhanced precision. Whether you’re trading currencies or commodities, this indicator helps provide sharper focus on evolving trends.
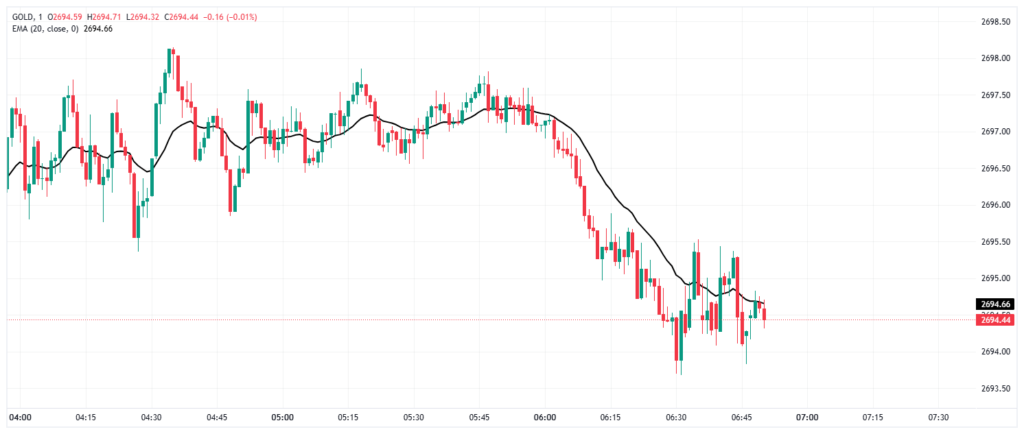
Why Traders Favor the 9 EMA Indicator
One of the most popular applications of the EMA is the 9-period EMA, commonly used on platforms like TradingView. The 9 EMA is particularly suited for shorter time frames, making it invaluable for day traders and scalpers who operate on 1-minute, 5-minute, or hourly charts. Here’s why it’s such a key player in trading strategies:
Quick Reaction Time
The greater weight on recent price trends means the 9 EMA indicator tradingview reacts swiftly to changes, helping traders spot reversals or emerging trends faster. This responsiveness is critical in volatile markets where timing is everything.
Trend Identification
The 9 EMA often acts as a guide for trend direction. Prices remaining above the EMA might signify a bullish trend, while consistent movement below it could indicate bearish momentum.
Support and Resistance Levels
The 9 EMA often serves as a dynamic support or resistance line. During uptrends, prices may pull back to the 9 EMA before resuming upward, signaling potential entry points. Similarly, in downward trends, the EMA can act as a cap, providing clues for potential short trades.
Integration with Other Indicators
It’s common to pair the 9 EMA with longer EMAs like the 21 EMA to create crossovers. A “fast” EMA crossing above a “slow” EMA can signal buying opportunities, while a downward cross might mark a potential sell signal.
3. Relative Strength Index (RSI)
The relative strength index is widely regarded as one of the best confirmation indicators in forex trading. It analyzes momentum by scaling price movements from 0 to 100, highlighting overbought levels above 70 and oversold conditions below 30. This allows traders to time their entries and exits effectively. RSI is frequently listed in Forex indicators PDFs and is regarded as a must-have for both experienced traders and beginners. Its simplicity and reliability also make it a common option for those using platforms like TradingView or downloading Forex indicators free of cost.

How RSI is Calculated
RSI is calculated using a formula that compares average gains and losses over a specified period, typically 14 periods. The formula for RSI is as follows:
RSI = 100 – [100 ÷ (1 + RS)]
Here, RS stands for the Relative Strength, which equals the average gain of up periods divided by the average loss of down periods. RSI values range from 0 to 100, and these values play a key role in determining market conditions.
Interpreting Typical RSI Values
When the RSI value is above 70, it generally indicates that the asset is overbought. This suggests that prices have risen too quickly and may be due for a correction or reversal. On the other hand, an RSI below 30 signals that the asset is oversold, meaning it could be undervalued and may rebound upwards.
RSI values between the 30 and 70 range signify a neutral or stable market condition. Traders often use this range to identify assets consolidating before making a significant move. Some advanced strategies may adjust the overbought and oversold levels to 80 and 20, respectively, for more specific signals, especially in trending markets.
Using RSI in Trading
Identifying Overbought and Oversold Conditions
One of the primary uses of RSI is determining when an asset might be overbought or oversold. For example, if RSI crosses above 70, it could be an early warning that the bullish momentum is weakening, and the price may soon reverse downwards. Similarly, an RSI dropping below 30 could hint at a potential upward reversal as bearish pressure eases.
Spotting Divergences
RSI can also signal potential trend reversals through divergences. A bullish divergence occurs when the price makes a new low, but the RSI doesn’t. This suggests a possible shift to an upward trend. Conversely, a bearish divergence arises when the price reaches a new high, but the RSI doesn’t, signaling a potential downward reversal.
RSI as a Confirmation Tool
Traders frequently use RSI alongside other trading strategies to confirm market trends. For instance, if a breakout occurs and RSI is also rising, it provides additional confidence in the breakout’s viability. However, if RSI shows overbought or oversold conditions conflicting with the main trend, it may prompt traders to evaluate the strength of existing trends before making a move.
Tips for Combining RSI with Other Indicators

RSI is more effective when paired with other technical tools. Combining RSI with moving averages, Bollinger Bands, or MACD (Moving Average Convergence Divergence) improves trading accuracy. For example, if RSI indicates oversold conditions while the price is also nearing a key support level identified by moving averages, it strengthens the case for an upward move.
Momentum traders often use RSI in tandem with candlestick patterns, such as doji or hammer, to further validate their entry and exit points. Pairing RSI with trend lines can also enhance its utility, as changes in RSI values may align with key support or resistance breaks.
Benefits of Using RSI in Trading
RSI offers several advantages, including its straightforward calculation and ease of interpretation. It helps traders quickly spot overbought or oversold conditions, enabling them to make timely decisions. RSI can also highlight potential reversals through divergences, making it a versatile tool in both trending and consolidating markets.
With adjustable settings, RSI suits different trading styles. Scalpers can reduce the period length for faster signals, while position traders might prefer longer periods for greater accuracy. Its compatibility with other technical indicators also makes RSI a key part of diversified trading strategies.

Limitations of RSI
Despite its usefulness, RSI is not without its drawbacks. Since it’s a momentum oscillator, RSI sometimes generates false signals in highly volatile markets. During strong trends, RSI can remain in the overbought or oversold zone for extended periods, leading traders to exit positions prematurely.
Additionally, RSI’s effectiveness diminishes in narrow, range-bound markets where price movements don’t exhibit strong momentum. It’s also a lagging indicator, reliant on past price data, making it essential to confirm RSI signals with other analysis tools to reduce the risk of errors.
4. Bollinger Bands
This technical indicator measures market volatility, making it a valuable tool for various trading conditions. Bollinger bands consist of a simple moving average with two standard deviation lines above and below the average. When the bands contract, volatility decreases; when they expand, volatility increases. Bollinger bands are widely included in resources like Forex indicators PDFs for their broad usability. They are particularly effective in identifying breakouts and reversals, which makes them a popular choice in strategies focused on gold and dollar analysis.

How Bollinger Bands Are Constructed
Bollinger Bands are based on a simple moving average (SMA) and consist of three key components:
The Middle Band
The middle line is a simple moving average, typically over a 20-period time frame. It reflects the average price over this period, serving as a baseline to gauge the market’s mean value.
The Upper Band
The upper band is calculated by taking the middle band and adding two standard deviations. A standard deviation measures how much price deviates from its average, so this band shows the upper limit of normal price movements.
The Lower Band
The lower band is derived by subtracting two standard deviations from the middle band. It represents the lower limit of typical price movements based on past data.
Because the bands are based on standard deviation, they expand and contract in response to market volatility. When volatility increases, the bands widen, and when it decreases, the bands narrow.
How Traders Use Bollinger Bands

Identifying Market Volatility
The width of the bands provides a clear measure of volatility. When the bands are wide, it signals high volatility, while narrow bands indicate low volatility. Periods of low volatility, when the bands tighten significantly are often followed by sharp price movements, making them a key signal for potential breakouts.
Spotting Potential Breakouts
When the price moves outside the upper or lower band, it can indicate a potential breakout either upward or downward. However, these events should be interpreted carefully. A break above the upper band might signal overbought conditions, while a break below the lower band could indicate oversold conditions. Traders often wait for confirmation in the form of a subsequent move back inside the bands or additional technical signals before committing to a position.

Detecting Trend Reversals
Bollinger Bands can also highlight potential reversals. For example, if the price consistently hugs the upper band during an uptrend but then breaks below the middle band, it could suggest that momentum is weakening and a downward reversal might occur. Similarly, in a downtrend, a move above the middle band could signal a potential bullish reversal.
The Squeeze Strategy
One of the most well-known applications of Bollinger Bands is the “squeeze” strategy. When the bands contract tightly around the price, it often indicates a period of consolidation. Traders interpret this as a precursor to a significant price movement in either direction. By combining the squeeze with other indicators, you can pinpoint the likely direction of the breakout more reliably.
Combining Bollinger Bands with Other Indicators

To enhance accuracy, traders often pair Bollinger Bands with complementary indicators. Here are a few examples:
Relative Strength Index (RSI)
Combining Bollinger Bands with RSI can help confirm whether the price is truly overbought or oversold. For instance, if the price touches the lower band and RSI is also below 30, it strengthens the case for a potential rebound.
Moving Averages
Traders use moving averages to determine the overall trend. For example, during a strong uptrend, price movements near the lower Bollinger Band might present buying opportunities.
MACD (Moving Average Convergence Divergence)
Using MACD indicator in conjunction with Bollinger Bands can confirm momentum changes. For instance, if the price breaks the upper band and MACD crossovers align, it provides a more robust signal to buy.

Candlestick Patterns
Bollinger Bands become even more insightful when paired with candlestick formations, like engulfing patterns or hammer candles, which can offer additional confirmation of reversal or continuation signals.
Benefits of Using Bollinger Bands
Bollinger Bands offer traders several advantages. They are highly versatile, helping identify volatility, trend strength, and potential reversals. The visual representation of price movements makes them intuitive and easy to understand, even for beginner traders. Additionally, Bollinger Bands work well across different time frames and markets, making them adaptable to various trading styles and asset classes.
Another key benefit is their ability to highlight periods of low volatility that often precede price breakouts. This feature allows traders to prepare for significant market movements and develop strategies to capitalize on them effectively.
Limitations of Bollinger Bands
Despite their many benefits, Bollinger Bands are not without drawbacks. One limitation is their reliance on historical data, which makes them a lagging indicator. This means that they may not always predict price movements with sufficient timeliness.

During strong trends, the price can “ride” the outer band for an extended period, leading to false assumptions of reversals. Additionally, interpreting Bollinger Bands requires experience, as price touching the bands does not inherently mean a trade signal—it must be combined with other factors for validation.
Finally, Bollinger Bands do not provide insight into the length or duration of a trend, which is why they are often used alongside other trend or momentum indicators.
5. Moving Average Convergence Divergence (MACD)
The MACD is considered one of the top 10 forex indicators and a reliable momentum-following tool. This moving average indicator calculates the difference between two exponential moving averages and plots it as a histogram. When the MACD line crosses above the signal line, it’s often interpreted as a buy opportunity, and vice versa for sell signals. With numerous customization options, it is often considered the best indicator for forex trading in TradingView. MACD is also an integral feature in many Forex indicators MT5 tools and forex trading strategies for both beginners and advanced users.
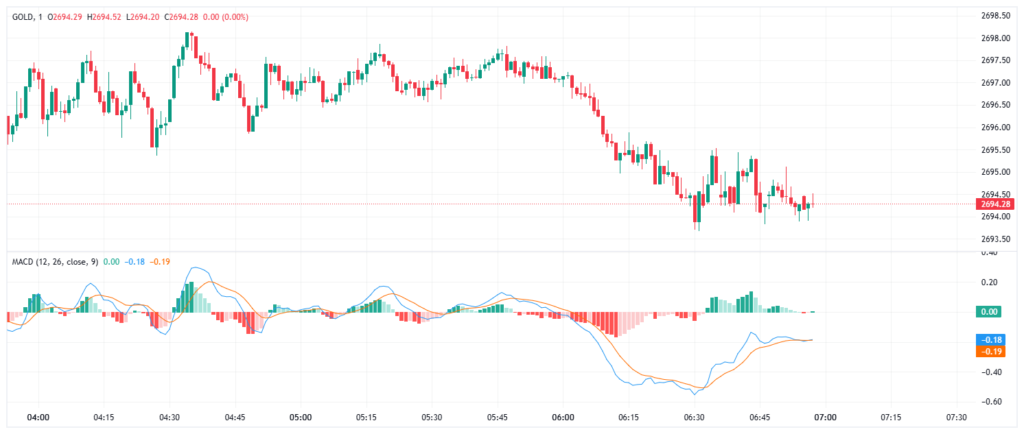
The Moving Average Convergence Divergence (MACD) is one of the most popular and versatile indicators used in technical analysis. Created by Gerald Appel, this trend-following momentum indicator helps traders identify trends, measure momentum, and spot potential buy and sell signals. The MACD is known for being straightforward to interpret yet powerful when applied correctly, making it suitable for both beginner and experienced traders.
How MACD is Calculated
The MACD forex trading indicator is composed of three main elements, each contributing to its ability to provide actionable insights into market movements:
The MACD Line
The MACD line is calculated by subtracting the 26-period Exponential Moving Average (EMA) from the 12-period EMA. This calculation highlights the relationship between shorter-term and longer-term price movements, showing the momentum and direction of a trend.
The Signal Line
The signal line is a 9-period EMA of the MACD line. This line smooths out fluctuations in the MACD line and acts as a trigger for potential buy or sell signals when crossovers occur.
The Histogram
The histogram represents the difference between the MACD line and the signal line. Positive histogram bars indicate bullish momentum, while negative bars suggest bearish momentum. The histogram provides a clear, visual representation of changes in momentum, making it easier to spot shifts in trend direction.
Together, these components provide a comprehensive view of trends and momentum in price movements. By tracking the convergence and divergence between EMAs, MACD enables traders to make informed decisions.
How to Use MACD
Identifying Trends
MACD technical analysis indicator is particularly effective at determining whether the market is in a bullish or bearish trend. When the MACD line crosses above the signal line, it is perceived as a bullish signal, indicating that momentum is strengthening and prices may rise. Conversely, when the MACD line falls below the signal line, it is interpreted as a bearish signal, suggesting weakening momentum and a potential price drop.
Additionally, the position of the MACD line relative to the zero line is crucial. If the MACD line is above the zero line, the market is generally considered bullish. When it moves below the zero line, it signals bearish conditions.
Spotting Momentum Shifts
The histogram is an essential tool for spotting changes in market momentum. Increasing histogram bars indicate that momentum is building in the direction of the trend, while shrinking bars signal that momentum is fading. By keeping an eye on the histogram, you can gain early insights into potential trend reversals before they occur.

Using Divergences
Divergences between the MACD and the price chart can signal potential trend reversals. A bullish divergence occurs when the price forms lower lows while the MACD makes higher lows, suggesting that bearish momentum is weakening and a reversal might follow. Conversely, a bearish divergence takes place when the price creates higher highs, but the MACD shows lower highs, indicating a potential downward reversal. Divergences are considered leading signals, but they should be confirmed with additional tools or chart patterns to enhance accuracy.
Employing Crossovers
One of the most well-known strategies with MACD is the crossover method. When the MACD line crosses above the signal line, traders often see it as a buying opportunity. Conversely, a sell signal is generated when the MACD line crosses below the signal line. Crossovers closer to the zero line are generally considered more reliable, as they indicate fresh changes in momentum.
Combining MACD with Other Indicators

While the MACD is a powerful standalone tool, combining it with other indicators can improve its accuracy and reduce the chance of false signals. For example:
Relative Strength Index (RSI)
Pairing MACD with RSI allows traders to confirm signals. For instance, if MACD shows a bullish crossover and RSI indicates oversold conditions, the combined signals reinforce the likelihood of an upward move.
Bollinger Bands
MACD can corroborate volatility signals from Bollinger Bands. A bullish MACD signal occurring as price breaks above the upper Bollinger Band can confirm strong momentum.
Support and Resistance Levels
MACD is one of the best support and resistance indicator. Integrating MACD with support and resistance analysis can help validate entry and exit decisions. For example, a bullish MACD signal near a key support level adds weight to the possibility of a price rebound.
Trend Lines and Moving Averages
Using MACD alongside moving averages or trend lines can help traders confirm the overall trend direction and refine their timing for trades.
When combining MACD with other indicators, ensure you understand how each tool works to avoid overcomplicating your analysis.

Benefits of Using MACD in Trading
MACD offers a range of benefits for traders. It is straightforward to calculate and interpret, making it an accessible tool for those new to technical analysis. Its ability to measure both momentum and trend direction enables you to analyze market conditions comprehensively.
The oscillator’s adaptability across different time frames and markets makes it useful for scalpers, swing traders, and position traders alike. Furthermore, its visual structure, with the MACD line, signal line, and histogram, helps you quickly assess market momentum in real time.
Limitations of MACD
Although MACD is highly effective, it does have its limitations. Like most indicators, MACD is a lagging tool, relying on historical price data. This lag can result in delayed signals, especially in fast-moving markets, potentially causing you to miss the optimal entry or exit point.
Another limitation is the possibility of false signals, particularly in choppy, sideways markets. During periods of low volatility, MACD’s crossovers and divergences can mislead traders, prompting them to enter or exit trades unnecessarily. This is why it’s essential to use MACD in conjunction with other indicators or chart patterns for confirmation.
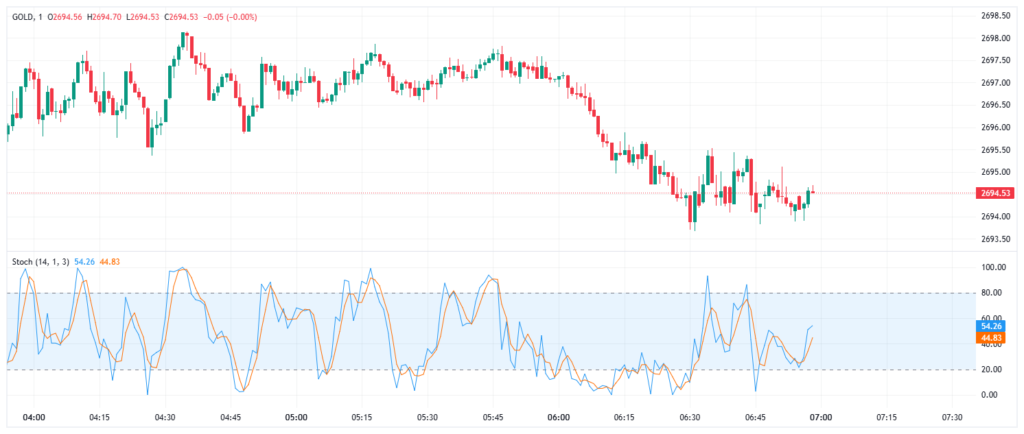
6. Stochastic Oscillator
The stochastic oscillator is a momentum indicator that compares an asset’s closing price to a range of its prices over a set period. It’s often used to predict potential reversal points by identifying oversold and overbought conditions. This indicator is another one of the best technical indicators that can be found in Forex indicators free download packages. It is also widely utilized in gold trading strategy indicators due to its efficiency in short-term scenarios. Traders frequently combine it with other tools for enhanced decision-making capabilities.
How to Use the Stochastic Oscillator
Identifying Overbought and Oversold Conditions
One of the primary uses of the Stochastic indicator is to spot overbought and oversold levels. Values above 80 suggest that the market is overbought, signaling that the price may soon experience a pullback. Conversely, values below 20 indicate oversold conditions, hinting that prices may rebound.
For example, when the %K line rises above 80 and then dips below, it can indicate that bullish momentum is weakening, creating a potential selling opportunity. Similarly, when the %K line falls below 20 and then climbs above, it may signal that bearish pressure is easing, suggesting a buying opportunity.
Crossovers
Traders often look for crossovers between the %K and %D lines to generate trading signals. When the %K line crosses above the %D line in the oversold zone (below 20), it can form a buy signal. Conversely, when the %K line crosses below the %D line in the overbought zone (above 80), it may indicate a sell signal.
These crossovers effectively confirm momentum shifts and make the Stochastic Oscillator an excellent tool for timing entry and exit points. It’s one of the best best technical indicators for day trading for long and short trades.

Spotting Divergences
Divergences between the Stochastic Oscillator and price action are potent signals for potential trend reversals. A bullish divergence occurs when the price forms lower lows while the Stochastic Oscillator makes higher lows, indicating weakening bearish momentum. On the other hand, a bearish divergence happens when the price reaches higher highs, but the Stochastic Oscillator forms lower highs, signaling waning bullish momentum.
Divergences are highly valuable because they often appear ahead of reversals, giving traders a chance to prepare for changing market conditions.
Trend Direction and Momentum
The Stochastic Oscillator assists in confirming trends. During a strong uptrend, Stochastic values may stay above 50 and frequently hover near overbought levels without significant reversals. Similarly, in a strong downtrend, the values might remain below 50 and linger near oversold levels. Observing these patterns helps traders determine the strength of the prevailing trend and avoid premature trades.

Combining the Stochastic Oscillator with Other Indicators
To increase accuracy and minimize the likelihood of false signals, traders often combine the Stochastic Oscillator with other technical tools. Some popular combinations include:
Relative Strength Index (RSI)
Pairing the Stochastic Oscillator with RSI strengthens signals for overbought or oversold conditions. For example, if both indicators confirm oversold conditions, it amplifies the likelihood of a price rebound.
Moving Averages
Using moving averages helps identify the overall market trend. For instance, if the Stochastic Oscillator signals a buying opportunity but the price remains below the 200-day SMA, traders may exercise caution and wait for stronger confirmation.
Bollinger Bands
Combining Bollinger Bands with the Stochastic Oscillator can highlight trading opportunities when the price approaches the outer bands, and Stochastic values confirm overbought or oversold levels.
Support and Resistance Levels
Stochastic divergence near key support or resistance levels can improve the reliability of reversal signals, aiding traders in timing their moves precisely.
When combining indicators, take care to understand how they work together and avoid overloading your analysis with conflicting signals.

Benefits of Using the Stochastic Oscillator
The Stochastic Oscillator offers several key benefits to traders:
- Its straightforward calculations and interpretation make it an accessible tool for traders of all experience levels.
- This indicator works well in various markets, including stocks, forex, and commodities, and can be applied across multiple timeframes.
- By highlighting overbought and oversold conditions, crossovers, and divergences, the Stochastic Oscillator provides actionable insights about market momentum.
- The Stochastic Oscillator can be fine-tuned by adjusting periods (e.g., 14, 9) or threshold levels for specific market conditions.

Limitations of the Stochastic Oscillator
While the Stochastic Oscillator is one of the best trading indicators and a valuable tool, it has limitations that traders should consider:
- During strong trends, the indicator can remain in overbought or oversold zones for extended periods, leading to misleading signals.
- Like most oscillators, the Stochastic Oscillator relies on historical price data, which means it often lags behind real-time developments.
- The indicator may generate unhelpful signals in low-trending or range-bound markets, complicating decision-making.
7. Fibonacci Retracement
Derived from mathematical sequences, Fibonacci retracement is an essential tool for identifying support and resistance levels during a trend. By marking retracement zones, such as 23.6%, 38.2%, and 61.8%, traders can predict where price corrections might end. This makes it a versatile choice on the Forex indicators list. Often highlighted in professional forex indicators and Forex indicators PDFs, Fibonacci retracement is invaluable for comprehensive market analysis. It is particularly effective when combined with other trend-following indicators.
How Fibonacci Retracement Levels Are Calculated
Fibonacci Retracement is derived from key percentage ratios within the Fibonacci sequence. The most commonly used retracement levels are 23.6%, 38.2%, 50%, 61.8%, and 78.6%. These percentages represent how far the price has retraced or corrected relative to the previous move.
To calculate these levels, follow these steps:
- Identify a significant price movement, such as a prominent uptrend or downtrend.
- Mark the highest and lowest points of that price movement, referred to as the swing high and swing low.
- Apply the Fibonacci tool available in charting platforms to draw the retracement lines between the swing high and swing low. The tool automatically generates horizontal lines corresponding to the Fibonacci levels.

For example, in an uptrend, if a stock rises from $100 to $150, the retracement levels might suggest that the price could pull back to $138.20 (38.2% retracement) or $130.90 (61.8% retracement) before resuming its upward trajectory.
How to Use Fibonacci Retracement
Identifying Support and Resistance Levels
Fibonacci retracement levels are often considered self-fulfilling prophecy zones, where a price correction is expected to slow down or reverse.
Support Levels
During an uptrend, retracement levels like 38.2%, 50%, or 61.8% can act as support. Traders often watch how the price reacts when it reaches these levels. If the price struggles to break below, the level is considered strong support.
Resistance Levels
During a downtrend, these same levels can serve as resistance. If the price stalls or reverses near a retracement level, it suggests that selling momentum is pushing back.
Traders use these levels to anticipate where price consolidations might occur and adjust their entries, exits, or stop-losses accordingly.

Following Trend Continuations
Fibonacci Retracement is particularly effective in trending markets. A common approach is to wait for a price pullback towards one of the retracement levels, then trade in the direction of the prevailing trend. For example, in an uptrend, if the price dips to the 61.8% level and starts bouncing back, traders may use this as an entry point for a long position.
Reversal Predictions with Fibonacci Confluence
Fibonacci Retracement levels become more powerful when confirmed by other technical tools or patterns. For instance, if a retracement level coincides with a historical support/resistance level, trendline, or moving average, the likelihood of the price respecting that level increases. This phenomenon is called Fibonacci confluence and is a reliable technique for enhancing accuracy.
Combining Fibonacci Retracement with Other Indicators
To make Fibonacci Retracement more effective, traders often combine it with other technical indicators for stronger confirmation of their trading decisions. Some popular combinations include:
Moving Averages
If a retracement level aligns with a significant moving average (e.g., 50-day or 200-day), it reinforces the potential for support or resistance.
Relative Strength Index (RSI)
RSI can help confirm the significance of a Fibonacci retracement level. For example, if the RSI shows oversold conditions near a retracement level during an uptrend, it supports the case for a price bounce.
MACD (Moving Average Convergence Divergence)
Combining Fibonacci levels with MACD crossovers can provide momentum confirmation. If the MACD signals a bullish crossover near a retracement support zone, traders might interpret it as an additional buying signal.
Candlestick Patterns
Chart patterns like hammer candles, engulfing patterns, or doji formations appearing near Fibonacci levels can provide further confirmation of potential reversals or trend continuations.
Practical Tips for Using Fibonacci Retracement
Start with Larger Time Frames
Use Fibonacci levels on daily or weekly charts to identify major support or resistance zones. Then, fine-tune entries by analyzing lower time frames.
Combine with Price Action
Watch how the price behaves when it approaches a Fibonacci level. Incorporating candlestick indicator formations or volume analysis can improve entry timing.
Adjust Stop-Losses
Place stop-loss orders slightly below the nearest retracement level in an uptrend or above the level in a downtrend to manage risk effectively.

Avoid Overreliance
While Fibonacci levels are helpful, avoid relying solely on them. Use a combination of technical analysis tools to make better decisions, especially in volatile or choppy markets.
Backtest Your Strategy
Test how the Fibonacci Retracement tool performs on historical price data, considering different time frames or asset classes to evaluate its reliability.
Benefits of Using Fibonacci Retracement
- Fibonacci Retracement works in various markets, including forex, stocks, commodities, and cryptocurrencies.
- It provides clear and straightforward levels, making it easy to identify potential entry and exit points.
- By using Fibonacci levels to set logical stop-losses and targets, traders can manage risk more effectively.
- Fibonacci Retracement can be combined with several indicators and strategies to increase accuracy and confidence in trading decisions.

Limitations of Fibonacci Retracement
- Fibonacci retracement levels rely on selecting the correct swing high and low, which is subjective and may vary among traders.
- Like most technical analysis tools, Fibonacci levels are based on historical price action and do not account for sudden market changes or news events.
- Prices may not always respect Fibonacci levels, particularly in highly volatile or unpredictable markets.
8. Ichimoku Cloud
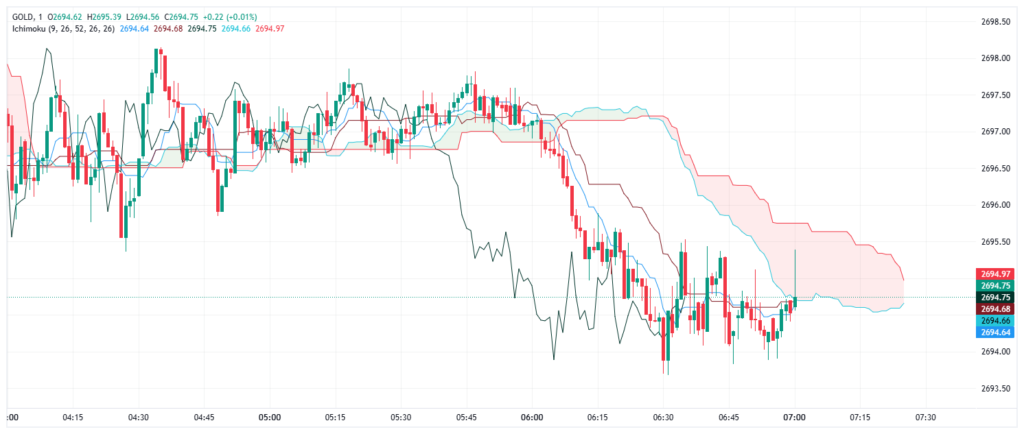
Ichimoku cloud is one of the top 10 trend indicators and is a multi-faceted indicator offering a comprehensive overview of potential market trends. It uses five different calculations to depict support, resistance, and momentum visually. Found in Forex indicators MT5, reversal indicator mt5 and Forex indicators gold download files, this tool is highly valuable for professional traders who want multi-dimensional market insights. It’s also used frequently by beginners who seek simplified, yet detailed, explanations of price movements.
Components of the Ichimoku Cloud
The Ichimoku Cloud consists of five primary components, each offering unique insights into market conditions. Here’s a breakdown of these components and their purposes:
Tenkan-sen (Conversion Line)
- Calculation: (9-period high + 9-period low) ÷ 2
- The Tenkan-sen represents the average price over the last nine periods. It is a short-term indicator that tracks momentum and provides early trend signals.
Kijun-sen (Base Line)
- Calculation: (26-period high + 26-period low) ÷ 2
- Acting as a medium-term trend indicator, the Kijun-sen provides a stronger signal of support and resistance and serves as a confirmation line for price movement.
Senkou Span A (Leading Span A)
- Calculation: (Tenkan-sen + Kijun-sen) ÷ 2, plotted 26 periods into the future
- This line forms the first boundary of the “cloud” and represents the average of the Conversion and Base lines.

Senkou Span B (Leading Span B)
- Calculation: (52-period high + 52-period low) ÷ 2, plotted 26 periods into the future
- This line forms the second boundary of the cloud, representing a longer-term view of support and resistance levels.
Chikou Span (Lagging Span)
- Calculation: Current closing price plotted 26 periods in the past
- The Chikou Span helps identify the relationship between current and past prices, acting as a confirmation of trends and potential reversals.
The area between Senkou Span A and Senkou Span B forms the cloud (Kumo):
- If Span A is above Span B, the cloud is green and indicates bullish sentiment.
- If Span B is above Span A, the cloud is red and signals bearish sentiment.
How to Use the Ichimoku Cloud

Identifying Trends
The key advantage of the Ichimoku Cloud is its ability to identify trends at a glance:
Bullish Trend
When the price is above the cloud, and the cloud is green, it suggests a strong uptrend.
Bearish Trend
When the price is below the cloud, and the cloud is red, it indicates a strong downtrend.
Neutral/Range-Bound Market
When the price is inside the cloud, it shows indecision or consolidation. Avoid making trades during this period unless there are clear breakout signals.
Support and Resistance Levels
The cloud itself acts as a dynamic support or resistance zone:
- During an uptrend, the cloud can be a support area. Prices may bounce off it before resuming upward movement.
- During a downtrend, the cloud functions as a resistance zone, preventing price from breaking higher.

The thicker the cloud, the stronger the potential support or resistance, as it reflects increased volatility or uncertainty.
Generating Buy and Sell Signals
Traders often look for specific signals using the Ichimoku Cloud components:
Tenkan-sen and Kijun-sen Crossovers
- A bullish signal occurs when the Tenkan-sen crosses above the Kijun-sen, especially when the price is above the cloud.
- A bearish signal forms when the Tenkan-sen crosses below the Kijun-sen, particularly when the price is below the cloud.
Price and Kumo Interactions
- When the price breaks above the cloud, it triggers a bullish breakout.
- When the price breaks below the cloud, it indicates a bearish breakout.
Chikou Span Confirmation
- If the Chikou Span is above the price and the cloud, it confirms bullish momentum.
- If the Chikou Span is below the price and the cloud, it confirms bearish momentum.
Cloud Color and Shape
- A thick and expanding cloud suggests strong momentum in the direction of the trend.
- A thinning cloud may signal an impending reversal.

Spotting Potential Reversals
The Ichimoku Cloud is powerful for predicting reversals:
- Divergence between the Chikou Span and the price often hints at a pending trend shift.
- A flat Kumo (particularly on Senkou Span B) indicates a key level of support or resistance that the price may gravitate toward.
Combining the Ichimoku Cloud with Other Indicators
The Ichimoku Cloud works best when combined with other tools to confirm signals and improve accuracy:
Relative Strength Index (RSI)
Use RSI to confirm overbought or oversold conditions when Ichimoku signals reversals or breakouts.
Bollinger Bands
Combine the ichimoku Cloud with Bollinger Bands to identify extreme price deviations while staying aware of overarching trends.
Volume Indicators
Analyze volume spikes to validate breakout signals from the Ichimoku Cloud.
Fibonacci Retracement Levels
Use Fibonacci levels to align the Ichimoku Cloud’s support/resistance predictions with retracement zones.
For example, if the Ichimoku Cloud signals a bullish breakout and the RSI confirms increasing momentum, this enhances the likelihood of a successful trade.
Benefits of Using the Ichimoku Cloud

- Provides multiple perspectives, including trend, momentum, and support/resistance, in a single chart.
- The cloud format simplifies trend identification, even in complex market conditions.
- Unlike static support or resistance levels, the cloud adapts to market volatility and provides forward-looking insights.
- Works across various markets and timeframes.
Limitations of the Ichimoku Cloud
- Its multiple components may overwhelm beginners, requiring time and practice to use effectively.
- Although forward-looking, its reliance on historical data can lead to delayed signals.
- The Ichimoku Cloud performs best in trending markets and may provide mixed signals in range-bound conditions.
- Combining the Ichimoku Cloud with other indicators on the same chart can lead to visual clutter.
9. Average True Range (ATR)
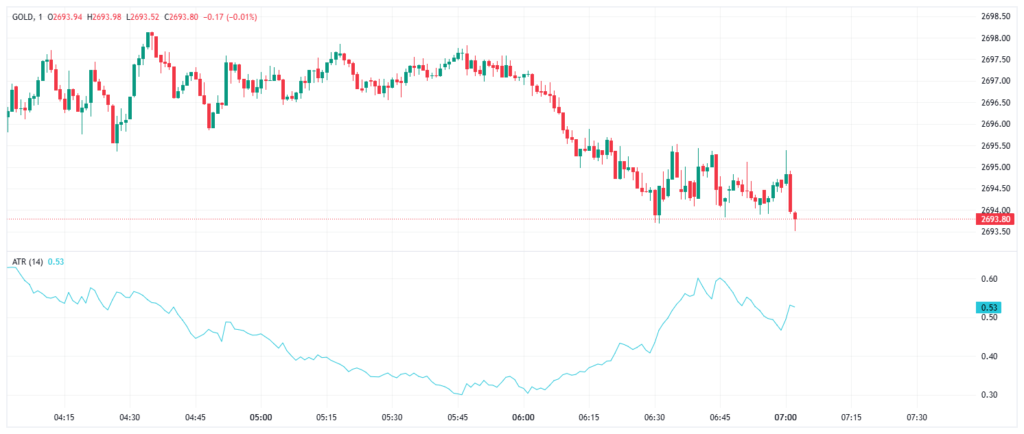
The average true range calculates the average range of price movements over a specific period, signaling volatility levels in the market. It is an indispensable resource for managing risk and setting stop-loss points. Found in Forex indicators gold free download files, ATR is one of the best forex indicators for dollar and currency trading pairs.
How to Use ATR
Measuring Market Volatility
ATR is primarily a volatility indicator:
- A high ATR value indicates high market volatility, where price movements are large over the analyzed period.
- A low ATR value reflects low volatility or a calmer market.
One key advantage is that ATR adapts to different asset classes and price levels. It provides figures in absolute terms, making it easier for traders to interpret volatility without distortion from percentage changes.
Setting Stop-Loss Levels
Traders often use ATR to determine logical stop-loss levels that align with current market volatility. Here’s how:
- If the ATR indicates high volatility, a larger stop-loss is required to avoid being stopped out by normal price swings.
- If the ATR is low, a tighter stop-loss can be used since price movements are narrower.

For instance, a trader could set a stop-loss 1.5 or 2 times the ATR value below the entry price in a long position. This ensures the stop-loss accounts for typical price fluctuations while still providing protection against unexpected reversals.
Identifying Breakouts
ATR is also useful in detecting potential breakouts:
- When the ATR increases dramatically, it may indicate that the market is exiting a period of consolidation, which might lead to a breakout.
- Conversely, a declining ATR suggests a lack of volatility, often preceding a consolidation phase.
For example, if a stock trades in a tight range for weeks and the ATR starts to rise sharply, it signals that volatility is increasing, and a breakout could be imminent.
Managing Risk
Effective risk management relies on an accurate understanding of volatility, and ATR is a crucial tool for assessing this. By gauging the potential size of price moves, traders can adjust their position sizes to ensure they’re not overexposed to large swings. Combining ATR with position-sizing strategies, such as the 1% or 2% rule, allows for better capital preservation in unpredictable markets.
Trend Confirmation
Some traders use ATR to confirm the strength of a trend:
- If the ATR rises during a strong uptrend or downtrend, it indicates that the trend has momentum and that participants are actively driving the market.
- On the other hand, if ATR decreases during a trending market, it may signal weakness or the potential for a reversal.

Combining ATR with Other Indicators
While ATR is a powerful tool on its own, it works even better when combined with other technical indicators. Here are a few practical combinations:
Moving Averages
Use ATR alongside moving averages to gauge volatility during trending periods. For instance, a rising ATR with a bullish moving average crossover can validate the strength of an uptrend.
Bollinger Bands
Combining ATR with Bollinger Bands can help analyze volatility within a specific price range. If ATR rises and the price breaks above or below the bands, it might confirm a strong breakout.
Relative Strength Index (RSI)
Use RSI to assess overbought or oversold conditions, complemented by ATR to ensure the breakout has sufficient momentum to sustain itself.

Fibonacci Retracements
By aligning ATR stop-loss levels with Fibonacci retracement zones, traders can refine entry and exit points, particularly in choppy markets.
Practical Tips for Using ATR
Adjust the Period According to Your Needs
While the default ATR is based on 14 periods, shorter timeframes (e.g., 7 periods) may provide quicker signals for short-term traders, while longer timeframes (e.g., 21 periods) are better suited for swing or position traders.
Use Multiple Time Frames
Analyze ATR on both higher and lower time frames to get a more comprehensive picture of volatility. A high ATR on a daily chart could indicate a key shift, while a lower ATR on an hourly chart might suggest short-term stability.
Customize Multipliers for Stop-Losses
Experiment with different ATR multiples (e.g., 1.5x, 2x, or 3x) to find the level that best matches your trading style and risk tolerance.
Avoid Overtrading in Low Volatility
A low ATR signals a range-bound market. Cautious traders should avoid overcommitting during these periods, as profits may be limited.
Backtest Your Strategy
Test how ATR performs with your specific trading strategies to understand its reliability and fine-tune your setups.

Benefits of Using ATR
- ATR works well in forex, stocks, crypto, futures, and commodities, adapting its insights to all asset types.
- ATR provides a quantitative basis for setting stop-loss levels, helping traders manage risk effectively.
- Rising or falling ATR values can signal when the market is transitioning between high and low volatility phases.
- ATR’s straightforward interpretation makes it beginner-friendly while still being valuable for advanced trading systems.
Limitations of ATR
- ATR only measures volatility, not the direction of price movement. Traders need other tools to determine trends and momentum.
- Since ATR is based on historical data, it reacts to past price moves and doesn’t predict future behavior.
- The choice of period (e.g., 14, 7, or 21) can lead to varying ATR values and interpretations.
10. Parabolic SAR
Parabolic SAR, short for stop and reverse, visually displays potential reversals in market trends. Plotted as dots above or below the price, this indicator is commonly cited as the best indicator for gold scalping. Available in Forex indicators free download packages, it’s a favorite for traders focusing on short-term strategies. Its clear and straightforward signals also make it a popular choice in profitable gold trading strategy PDFs.

How To Use the Parabolic SAR
The Parabolic SAR is plotted as a series of dots either above or below the price on a chart. These dots represent the general direction of the trend and move closer to the price as the trend progresses.
Identifying Trend Direction
The primary use of the Parabolic SAR is to determine the direction of a trend:
Uptrend
When the dots are below the price, it indicates a bullish trend, and traders may look for buying opportunities.
Downtrend
When the dots are above the price, it signals a bearish trend, encouraging traders to seek selling opportunities.
This straightforward approach allows for quick decision-making, making the Parabolic SAR a valuable tool for tracking trends.
Spotting Potential Reversals
The Parabolic SAR excels in identifying potential trend reversals:
- When the dots switch from below the price to above it, this suggests that the uptrend has ended, and a downtrend may be starting.
- When the dots move from above the price to below it, this signals the potential beginning of an uptrend.

These reversal points often act as entry or exit signals for traders.
Setting Stop-Loss Levels
The Parabolic SAR can be used as a dynamic stop-loss system:
- Traders place their stop-loss just below the SAR dots in an uptrend to protect their profits if the price reverses downward.
- Conversely, in a downtrend, the stop-loss is placed just above the SAR dots.
This approach ensures that stop-loss levels are adjusted automatically as the trend progresses, helping traders lock in profits while giving the trade room to breathe.
Making Buy or Sell Decisions
The Parabolic SAR provides clear trading signals:
- Buy Signal: When the dots switch to below the price, indicating the start of a potential uptrend.
- Sell Signal: When the dots move above the price, suggesting the start of a potential downtrend.
By following these signals, you can stay aligned with the prevailing market trend and avoid holding positions during reversals.

Practical Tips for Using the Parabolic SAR
Use in Trending Markets
The Parabolic SAR performs best in strong trending markets where the price moves consistently in one direction. Avoid relying on it in range-bound or choppy markets, as it may generate false signals.
Combine with Other Indicators
To filter out false signals, traders often combine the Parabolic SAR with other indicators. For example:
Moving Averages:
Use moving averages to confirm trends before acting on Parabolic SAR signals.
Relative Strength Index (RSI):
Combine with RSI to identify overbought or oversold conditions.
Fibonacci Retracements:
Align Parabolic SAR signals with Fibonacci levels for precise entry and exit points.
ADX (Average Directional Index):
Verify the strength of a trend using ADX alongside Parabolic SAR signals.
Adjust Acceleration Factor
Customize the AF settings to suit the asset and time frame you are trading. A higher AF catches trends more aggressively but can lead to more false signals, while a lower AF provides smoother signals but may lag during rapid price swings.
Backtest Your Strategy
Before applying the Parabolic SAR to live trades, backtest it on historical data to evaluate its effectiveness with your trading strategy.
Focus on Clear Signals
Trades based on the Parabolic SAR work best when the signals are supported by other indicators or confirmed by price action, such as breakouts or support/resistance levels.

Benefits of Using the Parabolic SAR
- The placement of dots makes it easy to interpret, even for beginners.
- Automatically adjusts stop-loss levels as the trend progresses.
- Highlights potential reversal points for timely entries and exits.
- Works well with various asset classes, including stocks, forex, and commodities.
Limitations of the Parabolic SAR
- The Parabolic SAR is less effective when the market lacks a clear trend, often producing misleading signals during consolidation periods.
- The indicator may respond too slowly during sudden price reversals, potentially leading to missed opportunities.
- Focuses solely on trend direction and lacks additional information, such as momentum or volume.
Reversal Indicators for MT5
Reversal indicator MT5 can be integrated into MT5 to enhance trading strategies by providing alerts and visual cues for potential market reversals. Here are some popular reversal indicators for MetaTrader 5 (MT5) that can help identify potential trend reversals:
Brilliant Reversal Indicator
This non-repaint indicator highlights potential reversal zones, making it useful for pinpointing precise reversal points.
Reversal Bar Indicator
It displays a bar representing a price reversal at new highs or lows, using distinct colors to indicate the reversal.
Cyclops Indicator
This tool follows the Cycleidentifier, along with SMA and RSI for filtering, and signals trades when a specific pattern is detected.
Top MT4 Indicators
These indicators can be combined and customized in MT4 to suit various trading strategies and preferences. Here are some popular indicators for MetaTrader 4 (MT4) that traders often use to enhance their trading strategies:
- Moving Average (MA
- Relative Strength Index (RSI)
- Bollinger Bands
- MACD (Moving Average Convergence Divergence)
- Stochastic Oscillator
- Fibonacci Retracement
- Ichimoku Cloud
Frequently Asked Questions

What is the best indicator on forex?
There’s no definitive answer, but MACD, RSI, and EMA are some of the most commonly used due to their versatility and reliability.
How to catch a trend in forex?
Use tools like moving averages or the Ichimoku cloud, pairing them with momentum indicators like RSI to confirm trends.
What is the most successful trading indicator?
The MACD and RSI are often highlighted for their ability to identify trends and momentum shifts effectively.
Is there a 100% winning strategy in forex?
No. Success depends on combining technical indicators with disciplined risk management and a solid understanding of the market.
Which indicator is the most accurate?
RSI and Fibonacci retracement are widely regarded as accurate for identifying trend reversals and critical support or resistance levels.
How to predict forex charts?
Predict using a combination of moving averages and momentum-based tools like the MACD or RSI for a holistic analysis.
Which indicator gives buy and sell signals?
MACD and RSI are popular tools for providing clear buy and sell signals based on market conditions.
What is the best indicator for gold in forex?
Bollinger bands and RSI are some of the best best indicators for swing trading and excellent tools for analyzing gold due to their effectiveness in tracking volatility and momentum.
How to know gold direction?
Combining moving averages with momentum analysis tools like RSI can provide insights into gold price movements.
What are trading indicators?
Trading indicators are mathematical tools that analyze price, volume, or market behavior to help predict future price movements.
Which is forex’s best indicator?
The best forex indicator varies, but many traders rely on moving averages and momentum-based tools like RSI.
Which are the most popular trading indicators?
Popular indicators include Moving Averages, RSI, MACD, Bollinger Bands, and Fibonacci Retracements.
Which are the most powerful trading indicators?
Powerful indicators combine trend, momentum, and volatility aspects, such as MACD, Ichimoku Cloud, and Bollinger Bands.
What is a price action indicator?
A price action indicator analyzes raw price movement without relying on external data, helping traders assess trends and reversals.
Where can I get MT4 indicators free download?
MT4 indicators can be found on various trading platforms, forums, or websites dedicated to forex trading resources.
How to use MACD indicator?
The MACD signals buy or sell when its MACD line crosses above or below the signal line, indicating momentum shifts.
Are there indicators for support and resistance?
Yes, many indicators highlight support and resistance levels, helping traders identify potential price reversal zones.
Which is the most current trading indicators list?
The latest trading indicators focus on enhancing accuracy with enhanced algorithms and data integration for diverse strategies.
Which are the best stock market technical indicators?
The best include RSI, MACD, Fibonacci Retracements, Bollinger Bands, and Moving Averages for analyzing price trends.
What is Fibonacci indicator?
Fibonacci indicators use Fibonacci ratios to identify potential support and resistance levels during market corrections.
What is the best MACD indicator settings?
The standard MACD settings of 12, 26, and 9 work well, but adjustments may be made depending on the trading style.
What are swing trading indicators?
Swing trading indicators, like RSI, MACD, and Fibonacci, help identify entry and exit points during market swings.
What is an RSI indicator?
The RSI measures the speed and change of price movements to determine overbought or oversold market conditions.
Which is the best indicator for long-term trading?
Moving Averages, particularly the 200-day MA, are highly reliable for long-term trend analysis.
Which is the best indicator for spot trading?
Momentum indicators, like the RSI and Bollinger Bands, are effective for quick-deciding spot trading strategies.
Which is the most used technical indicator?
Moving Averages are widely used due to their simplicity and effectiveness in identifying market trends.
What indicators do professional traders use?
Professionals often use moving averages, MACD, RSI, Fibonacci levels, and volume indicators to refine their strategies.
Which are the most common technical indicators?
Common indicators include Moving Averages, RSI, MACD, Stochastic Oscillator, and Bollinger Bands.
Which is the most useful trading indicator?
MACD is one of the most useful indicators, combining trend and momentum for versatile trading strategies.
Which are the best indicators for short-term trading?
For short-term trading, RSI, Bollinger Bands, and Exponential Moving Averages (EMAs) are particularly effective.
Which is the best indicator for option trading?
Implied volatility, Bollinger Bands, and RSI are useful in identifying opportunities for option trading strategies.
Conclusion
The best technical indicators for trading offer insights into trends, volatility, and market dynamics. From beginner-friendly options to advanced strategies, traders have a wealth of tools to explore. With resources like Forex indicators PDFs and free downloads, mastering these trading indicators can improve trading precision and overall profitability.
Disclaimer:
All information has been prepared by TraderFactor or partners. The information does not contain a record of TraderFactor or partner’s prices or an offer of or solicitation for a transaction in any financial instrument. No representation or warranty is given as to the accuracy or completeness of this information. Any material provided does not have regard to the specific investment objective and financial situation of any person who may read it. Past performance is not a reliable indicator of future performance.


