

Despite a strong rally, EUR/USD failed to breach the key resistance level of 1.1000 and has pulled back slightly. With no significant economic reports on the horizon, the pair remains sensitive to shifts in investor confidence.
The upcoming US inflation data on Thursday could provide the spark that determines the next move for EUR/USD.
EUR/USD Holds Steady with Bearish Tone Intact, Daily Chart Shows
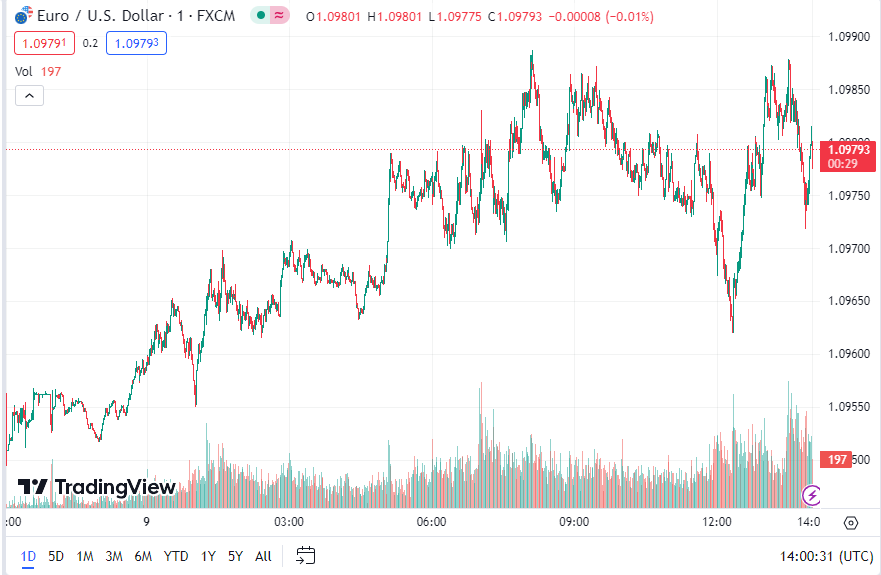
The EUR/USD pair is currently trading in the 1.09793 price zone and maintaining its recent gains. However, the bearish sentiment remains strong, as indicated by the daily chart.
Technical indicators in this timeframe are within negative levels, with slight upward movements that lack significant strength for a further increase.
Furthermore, the 20 Simple Moving Average (SMA) is gaining bearish traction around 100 pips above the current level, increasing the downside risk. Buyers have shown some support around a mildly bullish 100 SMA, which has been rejecting sellers since last week.
Expectations of Further Decline for EUR/USD in the Short Term, 4-Hour Chart Suggests
According to the 4-hour chart, EUR/USD is likely to extend its decline. The pair consistently encounters selling pressure when approaching a daily descendant trend line originating from the high on July 18 at 1.1275, currently around 1.0990.
In addition, technical indicators are still at negative levels with little directional strength. The pair is also trading below all its moving averages, with a bearish 100 SMA gaining downward momentum and reflecting increasing selling interest.
Key Support and Resistance Levels for EUR/USD
Support Levels: 1.0910, 1.0870, 1.0830
Resistance Levels: 1.1005, 1.1065, 1.1105
Moving Averages In Forex Trading
In the context of EUR/USD, the moving averages of 100 and 200 are commonly used to analyze trends and potential trading opportunities.
The 100-day moving average (100 SMA) is calculated by summing up the closing prices of EUR/USD over the past 100 days and dividing it by 100. This moving average provides a smoothed line that represents the average price movement over a medium-term period.
Similarly, the 200-day moving average (200 SMA) is calculated by summing up the closing prices of EUR/USD over the past 200 days and dividing it by 200. This moving average provides a longer-term perspective on the average price movement.
When the current price of EUR/USD crosses above the 100 SMA from below, it can indicate a bullish signal, suggesting a potential uptrend. Conversely, if the price crosses below the 100 SMA from above, it can indicate a bearish signal, suggesting a potential downtrend.
The 200 SMA is often considered a significant level of support or resistance. If the price is above the 200 SMA, it suggests a long-term bullish trend, and if the price is below the 200 SMA, it suggests a long-term bearish trend. Traders often look for opportunities when the price pulls back to the 200 SMA and bounces off it, confirming the support or resistance level.
By observing the interaction between the price of EUR/USD and these moving averages, traders can gain insights into the overall trend direction and potential entry or exit points for their trades. However, it’s important to note that moving averages should be used in conjunction with other technical indicators and analysis techniques for comprehensive decision-making in forex trading.
What is a moving average?
A moving average is a technical indicator that calculates the average price of a financial instrument over a specific period. It smooths out price fluctuations and helps traders identify trends.
How are moving averages calculated?
Moving averages can be calculated by adding up the closing prices over a specific period and dividing it by the number of periods. This calculation is repeated for each subsequent period.
What is the purpose of using moving averages in forex trading?
The main purpose of using moving averages in forex trading is to identify trends and potential trading opportunities. They can also help traders determine support and resistance levels and generate buy or sell signals.
What is a moving average crossover?
A moving average crossover occurs when two moving averages with different lengths intersect. It is considered a bullish signal when a shorter-term moving average crosses above a longer-term moving average, and vice versa for a bearish signal.
How do I choose the right moving average lengths for my strategy?
Choosing the right moving average lengths depends on various factors such as the trading timeframe, volatility of the currency pair, and personal trading style. Traders often experiment with different lengths and conduct backtesting to determine what works best for their strategy.
What is the difference between simple moving averages and exponential moving averages?
Simple moving averages (SMA) give equal weightage to all prices in the selected period. Exponential moving averages (EMA) give more weightage to recent prices, making them more responsive to price changes.
Can moving averages be used on any time frame?
Yes, moving averages can be used on any time frame, from tick charts to monthly charts. However, the choice of time frame depends on the trader’s trading strategy and goals.
What is the significance of the 50-period EMA in the Moving Average Trading Strategy?
The 50-period EMA is often used as a trend confirmation tool. When the price is above the 50-period EMA, it suggests an uptrend, and when the price is below the 50-period EMA, it suggests a downtrend.
What does it mean when the price crosses above or below the moving averages?
When the price crosses above a moving average, it can indicate a bullish signal and potential buying opportunity. Conversely, when the price crosses below a moving average, it can indicate a bearish signal and potential selling opportunity.
How do I set a stop-loss order in the Moving Average Trading Strategy?
Setting a stop-loss order involves placing an order to automatically sell a position if the price moves against you beyond a certain level. The specific placement of the stop-loss order can vary depending on the trader’s risk tolerance and strategy.
How can I identify trends using moving averages?
To identify trends using moving averages, traders look for the slope and direction of the moving average. An upward sloping moving average indicates an uptrend, while a downward sloping moving average indicates a downtrend.
How do moving averages help identify support and resistance levels?
Moving averages can act as support levels when the price bounces off the moving average in an uptrend, or as resistance levels when the price struggles to move above the moving average in a downtrend.
What are moving average envelopes?
Moving average envelopes are percentage-based bands plotted above and below a moving average. They create a channel that represents a certain percentage deviation from the moving average.
How do I determine the best settings for moving average envelopes?
Determining the best settings for moving average envelopes involves experimenting with different percentage deviations and conducting backtesting to see which settings align with your trading strategy and provide accurate signals.
Can moving average envelopes be used on any currency pair?
Yes, moving average envelopes can be used on any currency pair. However, it’s important to consider the volatility and characteristics of the specific currency pair to fine-tune the settings for optimal results.
What are the advantages of using moving average envelopes in forex trading?
Moving average envelopes can help traders identify overbought and oversold conditions, visualize price range expansion or contraction, and generate potential buying or selling signals.
What are the potential drawbacks of using moving average envelopes?
One potential drawback of using moving average envelopes is that they can generate false signals during sideways or ranging markets. Additionally, relying solely on moving average envelopes without considering other technical indicators or fundamental analysis may lead to inaccurate signals.
How can I use moving average ribbons to indicate trend direction and strength?
Moving average ribbons involve plotting multiple moving averages of different lengths on a chart. The convergence or divergence of these moving averages can indicate trend direction and the strength of the trend.
What are the benefits of using multiple moving averages in the Moving Average Ribbon Trading Strategy?
Using multiple moving averages in the Moving Average Ribbon Trading Strategy helps traders capture different aspects of price trends and increases the likelihood of accurate trend identification. It can also provide information about potential support and resistance levels.
What Are The Different Types Of Moving Averages
There are several types of moving averages commonly used in technical analysis. Here are some of the most widely used ones:
Simple Moving Average (SMA)
The Simple Moving Average calculates the average price over a specific period by summing up the closing prices and dividing it by the number of periods. It provides a straightforward representation of the average price movement.
Exponential Moving Average (EMA)
The Exponential Moving Average gives more weight to recent price data compared to older data points. It applies a mathematical formula that emphasizes the most recent prices, making it more responsive to current market conditions.
Weighted Moving Average (WMA)
The Weighted Moving Average assigns different weights to each price point within the selected period. It puts more weight on recent data, similar to the EMA, but uses a different calculation method.
Hull Moving Average (HMA)
The Hull Moving Average attempts to eliminate lag by using weighted moving averages and a square root of the period. It aims to provide smoother and more accurate signals by reducing the impact of price fluctuations.
Adaptive Moving Average (AMA)
The Adaptive Moving Average adjusts its sensitivity based on market volatility. It uses an algorithm to dynamically change its period and smoothing factor, allowing it to adapt to different market conditions.
Triangular Moving Average (TMA)
The Triangular Moving Average is a double-smoothed simple moving average. It applies two separate smoothing calculations to reduce noise and provide a smoother line.
Read These Next;
Exploring Forex Factory: An Invaluable Resource for Traders
The Best Time to Trade Forex: Maximizing Profit Potential
The Winning Mindset for Weekend Forex Trading
Essential Education for Taxes on Forex Trading
What is a Margin Level in Forex?
Forex Breakout Strategy: A Guide for Profitable Trading
Forex Consolidation Breakout Strategies for Traders
Master Forex Flag Pattern Strategy for Profit
Disclaimer:
All information has been prepared by TraderFactor or partners. The information does not contain a record of TraderFactor or partner’s prices or an offer of or solicitation for a transaction in any financial instrument. No representation or warranty is given as to the accuracy or completeness of this information. Any material provided does not have regard to the specific investment objective and financial situation of any person who may read it. Past performance is not a reliable indicator of future performance.