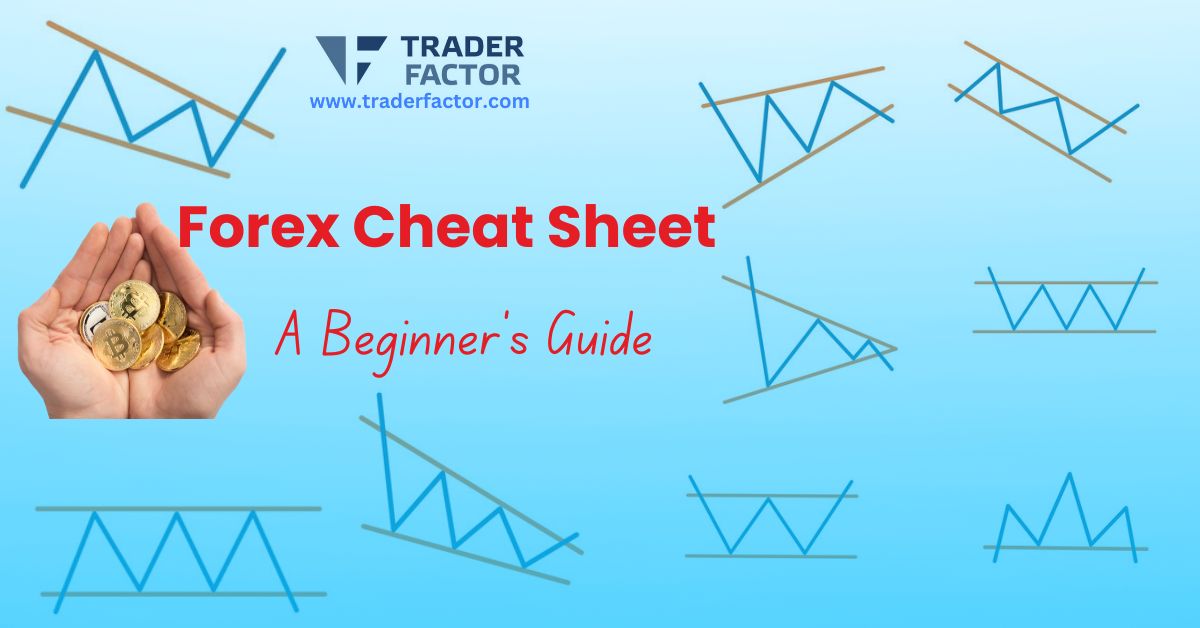

Forex Cheat Sheet: A Beginner’s Guide: Forex, also known as foreign exchange or FX trading, involves the buying and selling of currencies on a global market. It’s the largest financial market in the world, offering 24-hour market access, deep liquidity, and high leverage. Understanding Forex is paramount for success in trading international currencies.
A Forex cheat chart, often referred to as a Forex cheat sheet, is an invaluable tool for traders, especially those new to the Forex market. It’s essentially a compact reference that provides quick access to essential information needed for making informed trading decisions.
These cheat sheets can vary in content and format, but typically, they include:
✓ Key Currency Pairs: Major, minor, and exotic pairs with ISO codes.
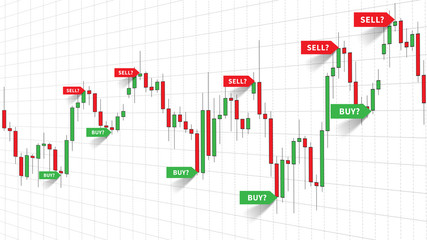
✓ Trading Signals and Patterns: Chart patterns and signals like head and shoulders, double tops/bottoms, and candlestick formations.
✓ Pip Values and Calculations: How to calculate pip value for different currency pairs.
✓ Economic Indicators: Key indicators such as GDP, unemployment, inflation rates, and central bank decisions.
✓ Trading Times: Forex market hours for major trading sessions.
✓ Risk Management Tips: Setting stop-loss/take-profit, calculating trade size.
Forex Cheat Sheet: Basics of Forex Market
Currency Pairs
Currencies are traded in pairs, e.g., EUR/USD. The first currency (EUR) is the base currency, and the second (USD) is the quote currency.
The Forex market operates through the simultaneous buying of one currency while selling another. For example, if you believe the Euro will strengthen against the US Dollar, you might buy the EUR/USD currency pair. Conversely, if you think the Euro will weaken, you’d sell the EUR/USD pair.
Consider an example where the EUR/USD pair is trading at 1.1000. If you buy this pair, it means you are buying 1 Euro for 1.10 US Dollars. If the Euro strengthens and the pair’s value rises to 1.2000, you could then sell your Euros for a profit since each Euro would now fetch more US Dollars than what you initially paid.
Another practical case involves the USD/JPY pair. If this pair is trading at 110.00, it means you can buy 1 US Dollar for 110 Japanese Yen. If economic forecasts or market conditions suggest the US Dollar will rise against the Yen, buying this pair could lead to a profit if the USD/JPY value increases, say, to 115.00, because you’ll be able to get more Yen for each Dollar you sell.
These examples highlight the fundamental dynamics of Forex trading, underscoring the importance of market analysis, economic indicators, and geopolitical events in trading decisions.

Bid, Ask, and Spread
When trading Forex, understanding the concepts of bid, ask, and spread is crucial. The bid price is what the buyer is willing to pay for a currency pair, while the ask price is what the seller is willing to accept. The spread is the difference between these two prices.
For instance, if the EUR/USD pair has a bid price of 1.1000 and an ask price of 1.1002, the spread is 2 pips. A pip is the smallest price move that a given exchange rate can make based on market convention. In this context, if you want to buy the EUR/USD pair, you’ll enter the market at the ask price of 1.1002. If you decide to sell the pair immediately after purchasing, you’ll do so at the bid price of 1.1000, thereby incurring a loss equivalent to the spread.
This concept plays a pivotal role in Forex trading strategies. Traders must account for the cost of the spread when entering and exiting trades, as it affects the break-even point of their trades. For a trade to be profitable, the asset’s price must move beyond the spread.
Consider a scenario where a trader expects the USD/JPY pair to increase from 110.00 (bid) / 110.02 (ask). If the trader buys at the ask price of 110.02, hoping the price will rise, the USD/JPY must move beyond 110.02 towards the trader’s target price to cover the spread before generating profit. If the pair moves to 110.50, for instance, the trader can then sell at the bid price (assuming it’s close to 110.50), securing a profit on the transaction. This example illustrates the importance of monitoring bid-ask spreads and factoring these costs into trade planning and strategy.
Leverage and Margin
Leverage allows traders to control large positions with a small amount of capital. Margin is the initial capital required to open a position.

Consider this illustration to elucidate how they work in Forex trading. Leverage is often expressed as a ratio, such as 100:1, meaning that with $1,000 of margin (your capital), you can control a position up to $100,000 in the currency market. This amplifies both potential profits and losses.
For instance, if a trader uses $1,000 to open a leveraged position in the EUR/USD pair, with a leverage ratio of 100:1, they are essentially controlling $100,000 in currency. If the EUR/USD moves favorably by 1% from the entry point, the profit on the $100,000 position would be $1,000 (1% of $100,000), effectively doubling the trader’s initial investment of $1,000. Conversely, a 1% move against the trader would wipe out the initial investment entirely, demonstrating the double-edged sword of leverage.
It’s crucial to understand that while leverage can magnify returns, it can also magnify losses, making it essential for traders to use risk management strategies. For example, setting stop-loss orders can help manage potential losses by automatically closing out positions at predetermined levels. This practical example emphasizes the importance of leverage and margin management in trading, illustrating how they must be meticulously applied to safeguard and potentially enhance trading capital.
Fundamental Analysis

This involves analyzing economic indicators, such as GDP growth rates, interest rates, and employment figures, to predict currency movements. Political events and natural disasters can also significantly impact currency values.
Another significant aspect of fundamental analysis is monitoring central bank decisions, such as changes in interest rates. For instance, if the European Central Bank (ECB) decides to raise interest rates, this could lead to an appreciation of the Euro (EUR) against other currencies. Here’s how it works in a practical scenario: consider that the ECB announces an unexpected interest rate hike. Traders anticipating the move might buy the EUR/USD pair expecting the Euro to strengthen.
If the pair was trading at 1.1200 before the announcement and moves to 1.1400 after, traders who bought the EUR/USD would see a profit from this movement, as each Euro would now fetch more US Dollars. This example illustrates the impact of central bank decisions on currency values and highlights the importance of staying informed about such events for successful Forex trading.
Technical Analysis

Technical analysis in Forex trading involves the study of historical price movements and market data to predict future price behavior. This method relies on the use of various indicators and chart patterns.
Here are some of the key indicators used in technical analysis, accompanied by practical examples:
Moving Averages (MAs)
Moving Averages smooth out price data to give a clearer view of the trend direction. The most commonly used MAs are the Simple Moving Average (SMA) and the Exponential Moving Average (EMA). For instance, if the 50-day MA crosses above the 200-day MA, it’s considered a bullish signal, suggesting it’s a good time to buy. Conversely, if the 50-day MA crosses below the 200-day MA, it’s seen as a bearish signal, indicating a potential sell opportunity.
Relative Strength Index (RSI)
The RSI measures the magnitude of recent price changes to evaluate overbought or oversold conditions in the price of a currency pair. Values range from 0 to 100, with readings above 70 considered overbought, and readings below 30, oversold. For example, if the EUR/USD pair shows an RSI reading of 75, it could suggest the pair is overbought, potentially leading a trader to expect a downward correction and possibly sell.
Bollinger Bands
These bands consist of an SMA (often 20-day SMA) flanked by two trading bands above and below it, which are standard deviations of the SMA. They help identify the volatility and overbought or oversold condition in the market. If the price touches the upper band, the market may be overbought; touching the lower band may indicate it’s oversold. For example, traders might look for buying opportunities when the price of GBP/USD bounces off the lower band with an aim for it to rise towards the middle or upper band.

MACD (Moving Average Convergence Divergence)
The MACD indicator is used to spot changes in the strength, direction, momentum, and duration of a trend in a currency’s price. It comprises two lines: the MACD line and the signal line, which move together and apart as the trends change. A trader may consider a signal to buy when the MACD line crosses above the signal line, indicating a potential uptrend. Conversely, a crossing below the signal line may signal a downtrend, suggesting a potential sell.
Fibonacci Retracement
This tool is used to identify potential reversal levels. These levels are percentages (e.g., 23.6%, 38.2%, 61.8%) of the original price move. Traders use Fibonacci levels as potential support and resistance areas. For instance, if USD/JPY moves from 105.00 to 110.00 and then starts to decline, traders might watch the 38.2% retracement level (around 107.81) as a potential area to enter a buy position, expecting the initial uptrend to resume.
Trading Strategies
Scalping
This strategy involves making numerous small trades throughout the day, aiming to profit from short-term price movements. Scalpers typically operate on tight spreads, making quick decisions to buy or sell based on minor market movements. For example, a scalper might enter a position in the EUR/USD pair at 1.1200 and exit at 1.1205, capturing a 5 pip profit. This strategy requires a deep understanding of market dynamics and the ability to make rapid, disciplined decisions.
Day Trading
Unlike scalpers, day traders may only make a few trades per day, but like scalpers, they close all positions before the market closes to avoid overnight risk. A practical example of day trading could involve analyzing the EUR/USD pair for potential significant movements due to an anticipated news release. A trader might enter a position early in the day and close it out for a profit after the news causes a favorable price movement.
Swing Trading
This strategy aims to profit from price ‘swings’ in the market over several days or weeks. A swing trader might use technical analysis to identify a potential uptrend in the GBP/USD pair and enter a long position, expecting the trend to continue for several days. They might set a target profit level and a stop-loss to manage risk, potentially exiting the trade with significant gains a week later when the price reaches their target.

Position Trading
Position traders take a long-term view of the market, holding positions for months or even years. They rely heavily on fundamental analysis to make trading decisions. For example, if a trader believes that the USD is going to weaken due to anticipated changes in U.S. fiscal policy, they might enter a long position in EUR/USD, expecting the Euro to strengthen against the Dollar over time. This strategy requires patience and a strong understanding of macroeconomic factors.
Carry Trade
In a carry trade, a trader borrows a currency with a low interest rate to fund the purchase of a currency with a higher interest rate, profiting from the interest differential. For instance, if the interest rate for the Japanese Yen is 0.1% and for the Australian Dollar is 1.75%, a trader might sell JPY to buy AUD, earning the interest difference. However, this strategy involves risk, particularly from adverse currency movements that could erase interest gains.
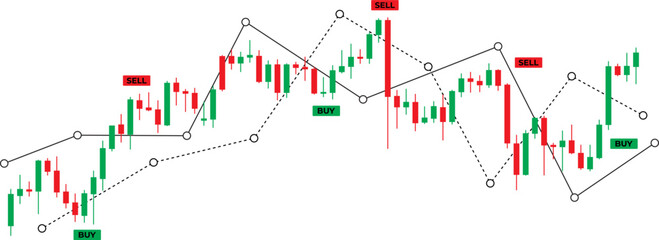
Forex Candlestick Patterns Cheat Sheet
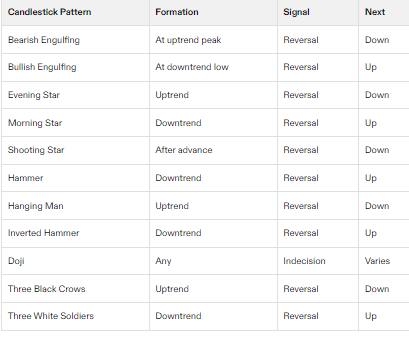
The Reversal Patterns
Double Top and Double Bottom
These mirror images are textbook examples of market reversal signals. The Double Top appears during an uptrend, signaling that the bullish momentum is waning and a downward reversal is on the horizon. Conversely, the Double Bottom occurs in a downtrend, indicating that bears are losing control and a shift to bullish momentum is imminent.
Head and Shoulders and Inverse Head and Shoulders
These patterns tell a story of a battle between bulls and bears, culminating in a decisive victory for one side. The classic Head and Shoulders formation emerges during an uptrend, predicting a reversal to a downtrend as sellers overtake buyers. Its counterpart, the Inverse Head and Shoulders, forms during a downtrend, signaling a bullish reversal as buyers regain strength.
The Continuation Patterns
Rising and Falling Wedges
A Rising Wedge can form during both an uptrend, indicating a potential reversal to the downside, and a downtrend, suggesting a continuation of the fall. The Falling Wedge, on the other hand, appears during an uptrend to indicate continuation upwards, or a downtrend, predicting a bullish reversal. These patterns highlight the tightening of price movements before a significant breakout.

Bearish and Bullish Rectangles
Formed during periods of consolidation, rectangles act as a pause in the market, allowing traders to catch their breath before the prevailing trend resumes. A Bearish Rectangle forms during a downtrend and signals that the continuation of the fall is likely. In contrast, a Bullish Rectangle occurs during an uptrend, indicating that the ascent is expected to continue.
Bearish and Bullish Pennants
Much like flags on the battlefield, these patterns signal the continuation of the prevailing trend. Bearish Pennants are created during a downtrend and point towards a further decline. Bullish Pennants, however, form during an uptrend, suggesting that prices are set to climb higher.
Risk Management
Effective risk management includes setting stop-loss orders to limit potential losses, utilizing take-profit orders to secure profits, and applying money management techniques to preserve trading capital.
Consider a trader who decides to enter a long position in the EUR/USD pair at 1.1200, anticipating an upward movement. To apply risk management, the trader might set a stop-loss order at 1.1150, which limits the potential loss to 50 pips. Additionally, they set a take-profit order at 1.1300, aiming for an upside of 100 pips. This strategy ensures that, should the market move unfavorably, the trader’s losses are capped at a predetermined level, while still allowing for profit realization should the market move as anticipated.
Money management might also play a role here, with the trader allocating only a portion of their total trading capital to this single trade, thereby preserving their capital against market volatility and ensuring they can continue to trade even if this particular trade results in a loss. This approach underscores the importance of not just aiming for profits but also prioritizing the protection of capital through calculated risk-taking.

Trading Psychology
The domain of trading psychology cannot be underestimated, as it significantly impacts decision-making in the high-pressure environment of trading. A practical example illustrating this is the concept of “loss aversion,” where traders experience more emotional pain from a loss than the pleasure from an equivalent gain. This can lead traders to hold onto losing positions for too long, hoping the market will reverse and vindicate their decisions, rather than closing the position to minimize losses.
For instance, consider a trader who enters a long position in the EUR/USD pair at 1.1250, expecting the pair to rise. However, instead of rising, the pair begins to fall. Driven by loss aversion, the trader avoids closing the position at a small loss, hoping for a market rebound. The market continues to decline, and the position eventually hits a significant loss, far exceeding the initial risk tolerance level.
This example underscores how emotional biases, if not recognized and managed, can lead to poor trading decisions and compounded losses. It also highlights the importance of having a disciplined approach to trading, where decisions are made based on preset rules and analysis, rather than emotional reactions.
Maintaining discipline, managing emotions, and handling losses with a constructive mindset are critical for successful Forex trading.
Tools and Resources

Essential tools for Forex traders include technical analysis software, economic calendars, and demo accounts for practice. Recommended reading materials and educational platforms offer invaluable insights into Forex trading.
One invaluable resource that comes highly recommended for anyone serious about mastering Forex trading is the collection of guides available at TraderFactor. These guides are meticulously crafted to cater to traders of all levels, from beginners to advanced practitioners, providing in-depth analysis and strategies tailored to diverse trading styles.
Whether you are looking to refine your technical analysis skills, deepen your understanding of macroeconomic indicators, or learn more nuanced trading strategies like those mentioned previously, TraderFactor’s guides offer clear, actionable insights. The platform also emphasizes the psychological aspect of trading, offering strategies to help traders maintain discipline and control emotions, thereby enhancing decision-making under pressure. Leveraging these resources can significantly improve your trading acumen and potentially your market success.

Forex Trading Plan
A comprehensive trading plan includes analysis methodologies, risk management strategies, and specific goals. A trading journal helps in reviewing performance and making adjustments.
Common Mistakes and How to Avoid Them
Common pitfalls include over-leveraging, lack of strategy, and emotional trading decisions. Education, strategy development, and disciplined execution are keys to avoidance.
Another practical example highlighting common pitfalls in Forex trading involves the misuse of leverage. Consider a trader who decides to use a high leverage ratio to amplify their potential profits on a EUR/USD trade. With a leverage of 100:1, the trader can control a large position with a relatively small amount of capital. However, the market moves against the position, leading to rapid losses that exceed the initial capital due to the amplified effect of leverage. This scenario underscores the double-edged nature of leverage—it can significantly increase profits but also magnify losses, often beyond the trader’s initial investment.
For instance, if the trader used $1,000 of capital to control a $100,000 position in the EUR/USD market and the market moved 1% against the trader, the loss would be $1,000 (1% of $100,000), effectively wiping out the initial capital. This example illustrates why it is crucial for traders to not only understand how leverage works but also to use it judiciously, aligning it with their risk tolerance and overall trading strategy to prevent catastrophic losses.
Advanced Tips and Tricks

Incorporate news and sentiment analysis to gauge market mood. Explore advanced trading techniques, such as algorithmic trading and hedging, for additional strategies.
Exploring the utility of algorithmic trading, consider a trader who implements a simple moving average (SMA) crossover strategy to determine entry and exit points in the market automatically. In this scenario, the trader uses two SMAs: a short-term 50-day SMA and a long-term 200-day SMA. The system is programmed to initiate a buy order when the 50-day SMA crosses above the 200-day SMA, indicating a potential uptrend. Conversely, a sell order is triggered when the 50-day SMA crosses below the 200-day SMA, signaling a potential downtrend.
For instance, if the EUR/USD pair has been in a downtrend and the 50-day SMA crosses above the 200-day SMA, the algorithmic system automatically executes a buy order based on the trader’s pre-established criteria. This strategy aims to capitalize on the beginning of a potential uptrend with minimal manual intervention. However, the trader also sets risk management parameters within the algorithm, such as stop-loss orders, to protect against significant losses if the market does not move as anticipated. This approach to trading offers a disciplined, rules-based strategy while minimizing the emotional biases that can adversely affect decision-making.
Choosing Forex Brokers

When selecting a Forex broker, consider regulatory compliance, trading platforms, account types, customer service, and, importantly, the spreads and fees. Here are brief insights into five recommended brokers:
ActivTrades
Offering a wide range of instruments and advanced trading platforms, ActivTrades provides tight spreads, fast execution, and enhanced trader protection.
Admirals
Renowned for its comprehensive educational resources, Admirals also offers competitive spreads, multiple account types, and MetaTrader platform support.
IronFx
IronFx is known for its diverse account options, allowing traders to choose based on their trading style and capital requirements. The broker provides access to a wide variety of instruments and leverage options.
Eightcap
Eightcap stands out for its low spreads, fast execution, and exceptional customer service. It offers both MetaTrader 4 and MetaTrader 5 platforms, catering to all levels of traders.
OneRoyal
Famed for its customer-centric approach, OneRoyal offers competitive spreads, a wide variety of trading instruments, and personalized trading experiences.
Remember, Forex trading requires a nuanced understanding of global markets, discipline, and a keen eye for detail. Starting with a solid foundation, like the one outlined above, and choosing the right broker, like ActivTrades, Admirals, IronFx, Eightcap, or OneRoyal, positions you for a better trading experience.
Frequently Asked Questions
What is included in a Forex chart patterns cheat sheet?
A Forex chart patterns cheat sheet provides a concise overview of key trading formations and signals to help traders identify potential market movements.
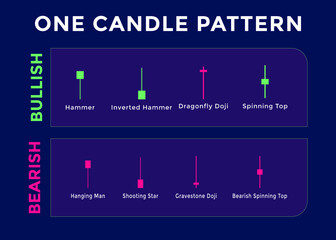
How can a candlestick cheat sheet improve Forex trading?
A candlestick cheat sheet simplifies the recognition of common price action patterns, offering traders insights into market sentiment and potential reversals.
Disclaimer:
All information has been prepared by TraderFactor or partners. The information does not contain a record of TraderFactor or partner’s prices or an offer of or solicitation for a transaction in any financial instrument. No representation or warranty is given as to the accuracy or completeness of this information. Any material provided does not have regard to the specific investment objective and financial situation of any person who may read it. Past performance is not a reliable indicator of future performance.