
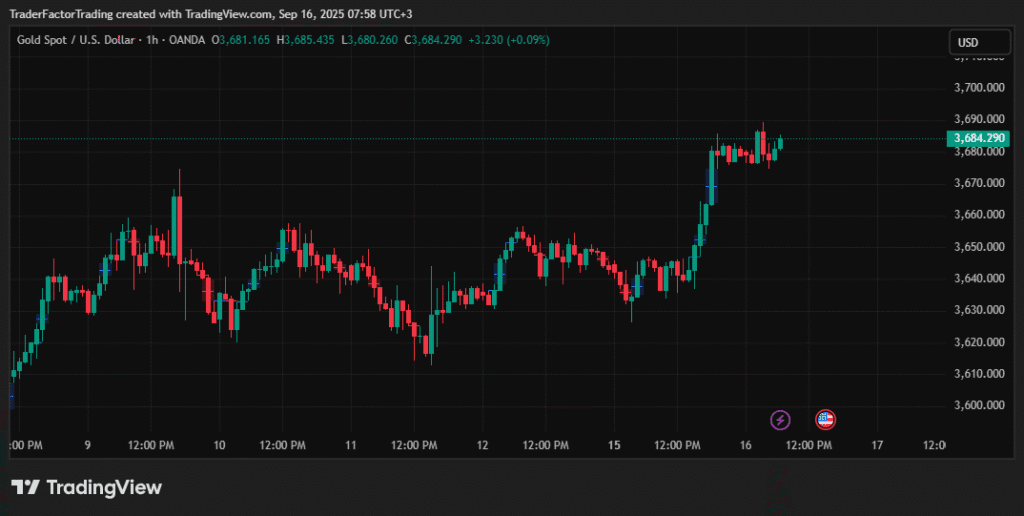
The price of gold experienced a notable retreat after nearly touching the significant $3,700 per ounce mark. This movement in the gold price today reflects a cautious sentiment among traders who are taking profits off the table. All eyes are now on upcoming key economic indicators from the United States, specifically the Retail Sales figures, and the highly anticipated interest rate decision from the Federal Reserve. The recent surge in gold price live charts has been fueled by a weaker U.S. Dollar, which is under pressure from widespread expectations of aggressive monetary easing by the central bank.
Market Dynamics Influencing Gold Price Today
The current gold price action is a classic example of market participants reacting to both technical signals and fundamental economic news. After a strong upward trend that pushed prices to lifetime highs, a period of consolidation or correction is often expected. Traders are capitalizing on these highs by selling their positions, which introduces downward pressure on the price. This profit-taking behavior is a standard market cycle, especially ahead of major economic announcements that have the potential to introduce significant volatility and alter the prevailing market trends.
The Federal Reserve’s Looming Decision
The upcoming Federal Reserve policy meeting is the most significant event influencing the gold price today in USD. Market consensus is leaning heavily towards an aggressive rate cut, a move that typically weakens the U.S. Dollar. Since gold is priced in dollars, a weaker dollar makes the metal cheaper for holders of other currencies, thereby increasing its appeal and often leading to a higher gold price. Investors are closely monitoring the Fed’s announcement and any forward guidance for clues about the future path of monetary policy, which will be a primary driver for gold price prediction models moving forward.
Impact of U.S. Economic Data
Beyond the Fed’s decision, crucial economic data from the United States is also playing a role. The release of U.S. Retail Sales figures will provide insight into the health of the consumer, a key component of the American economy. Stronger-than-expected data could temper the Fed’s dovish stance, potentially strengthening the dollar and creating headwinds for gold. Conversely, weak data would reinforce the case for rate cuts, likely providing further support for the precious metal. Therefore, the interplay between this data and central bank policy is creating a complex environment for traders.
Technical Analysis of the Gold Price Chart
From a technical standpoint, the gold price chart shows that the metal has entered overbought territory. Indicators like the Relative Strength Index (RSI) on daily charts are signaling that the recent rally may have been too rapid, suggesting that a brief correction could be underway. The price level just shy of $3,700 is acting as a significant psychological and technical resistance point. A failure to decisively break above this level has prompted the current pullback.
Support and Resistance Levels
Traders are now observing key support levels to gauge the potential depth of this correction. A sustained drop could see the gold price test lower support zones, offering new entry points for bullish investors who missed the initial rally. However, if the price can hold firm and consolidate above recent breakout levels, it would signal underlying strength and a potential continuation of the uptrend. The immediate direction of the gold price live feed will likely be determined by its reaction to the upcoming news events.
In conclusion, the gold market is at a pivotal juncture. While profit-taking has caused a short-term dip, the underlying narrative of anticipated Federal Reserve rate cuts continues to provide strong support. The market’s next significant move will be dictated by the Fed’s policy announcement and key economic data releases.
Disclaimer:
All information has been prepared by TraderFactor or partners. The information does not contain a record of TraderFactor or partner’s prices or an offer of or solicitation for a transaction in any financial instrument. No representation or warranty is given as to the accuracy or completeness of this information. Any material provided does not have regard to the specific investment objective and financial situation of any person who may read it. Past performance is not a reliable indicator of future performance.