

The US dollar gained strength in the early morning American session, buoyed by a hawkish Federal Reserve bet and better-than-expected Nonfarm Payrolls (NFP) data.
The U.S. Bureau of Labor Statistics (BLS) announced on Friday that Nonfarm Payrolls (NFP) in the United States experienced an uptick of 336,000 in September, significantly surpassing market predictions of 170,000. Additionally, the previously reported increase for August, initially stated as 187,000, underwent an upward revision to 227,000.
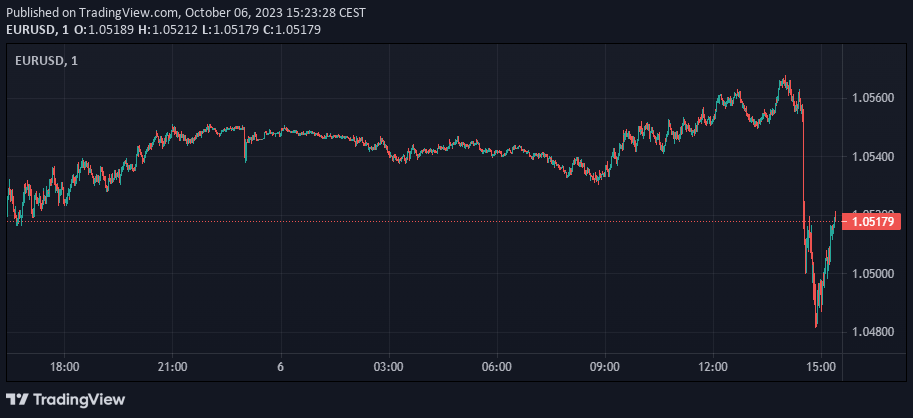
Surprising NFP Report Triggers Downward Shift in EUR/USD Pair
In the early American trading session on Friday, the EUR/USD pair faced a downward shift, inching towards 1.0500, triggered by a surprisingly robust Nonfarm Payroll (NFP) report. This led to an upsurge in the U.S. dollar’s momentum, which consequently exerted a downward force on the pair.
EURUSD Daily Chart
USD/CAD Reacts to Labor Market Data: Canadian Employment Figures Surpass Expectations
In the wake of the US and Canadian labor market data release, the USD/CAD experienced an increase, surging to 1.3745 before making a U-turn and retreating towards the 1.3700 vicinity. The uplifting effect of the US statistics was neutralized by the Canadian report.
USDCAD Daily Chart
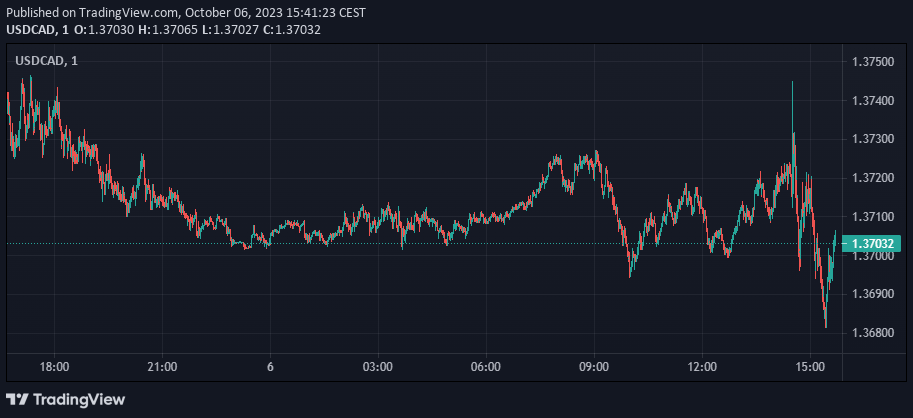
The USD/CAD pair has seen some activity recently. As of today, the last recorded price stands at 1.3714 which represents a daily change of 0.0009 or 0.07%. The daily open was at 1.3705.
In terms of trends, the Simple Moving Averages (SMA) over 20, 50, 100, and 200 days stand at 1.3554, 1.3514, 1.3412, and 1.3461 respectively.
The previous daily high was 1.3786 and the previous daily low was 1.3704. In the past week, the highest value recorded was 1.3585 and the lowest was 1.3417. Last month saw a high of 1.3694 and a low of 1.3379.
Fibonacci retracement levels, often used to predict potential support and resistance levels in trading, are calculated at 38.2% (1.3735) and 61.8% (1.3754).
The pivot points, which traders use to identify potential areas of price movement, are calculated as follows: S1 is 1.3677, S2 is 1.3649, and S3 is 1.3595. On the resistance side, R1 is at 1.3759, R2 is at 1.3813, and R3 is at 1.3841.
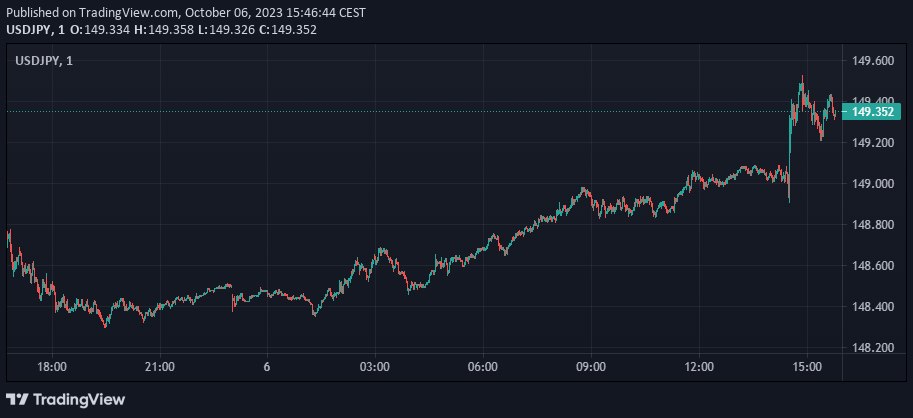
USD/JPY Ascends to New Three-Day Peak Following Favorable US NFP Report
The USD/JPY pair has reached a new three-day high of 149.50, spurred by the release of the United States Nonfarm Payrolls (NFP) report which surpassed expectations. The robust state of the labor market is likely to influence a more hawkish stance at the Federal Reserve’s monetary policy assembly in November, further bolstering the asset’s strength.
USDJPY Daily Chart
In relation to the Japanese Yen, recent data from the Bank of Japan’s (BoJ) money market confirmed that the flash crash experienced on Tuesday wasn’t a result of the central bank’s interference in the foreign exchange market.
This revelation has somewhat affected the attractiveness of the Japanese Yen. With the situation normalized, investors are now cautiously anticipating any covert intervention by the BoJ.
U.S. Dollar Index Rises Amid Robust Labor Market and Potential Rate Hike
The U.S. Dollar Index (DXY) is on the ascent, nearing a value of 107.00, fueled by the robust performance of the U.S. labor market. This development has sparked expectations of a potential interest rate hike from the Federal Reserve.
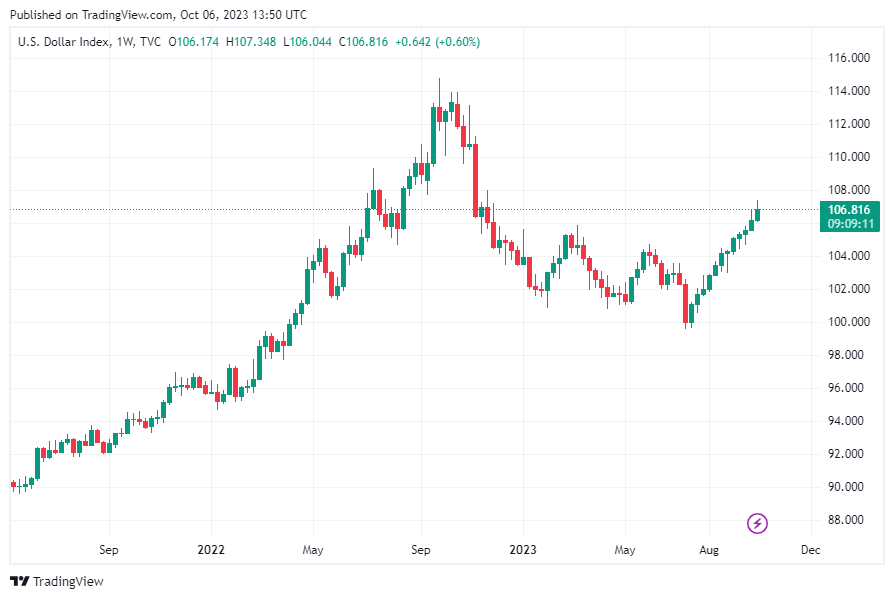
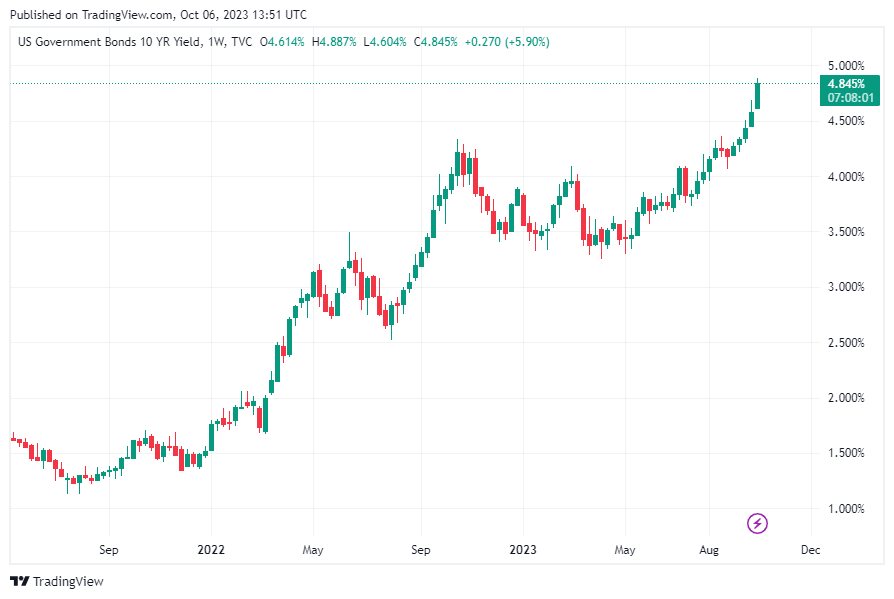
Concurrently, 10-year U.S. Treasury yields have surged close to 4.84%. Earlier this week, Loretta Mester, President of the Federal Reserve Bank, stated that if the economic conditions persist, another increase in interest rates could be on the horizon in November. However, should labor demand falter, it’s possible that interest rates may remain static.
US Nonfarm Payroll Employment Surges by 336,000 in September, Unemployment Rate Steady at 3.8%
The U.S. Bureau of Labor Statistics reported today that total nonfarm payroll employment rose by 336,000 in September, showing a significant boost to the economy. The unemployment rate remained unchanged at 3.8 percent.
Key sectors such as leisure and hospitality, government, health care, professional, scientific, and technical services, and social assistance all saw job gains. These figures are derived from two monthly surveys: the household survey, which measures labor force status including unemployment by demographic characteristics, and the establishment survey, which measures nonfarm employment, hours, and earnings by industry.
| Category | Statistics |
|---|---|
| Total nonfarm payroll employment | Increased by 336,000 in September |
| Unemployment rate | Remained unchanged at 3.8% |
| Job gains | Seen in leisure and hospitality, government, health care, professional, scientific, technical services, and social assistance |
| Number of unemployed persons | Essentially unchanged at 6.4 million |
| Unemployment rates across major worker groups | Showed little to no change |
| Long-term unemployment figures | Remained steady at 1.2 million |
| Labor force participation rate and employment-population ratio | Both remained unchanged |
| Number of persons employed part-time for economic reasons | Little changed at 4.1 million |
| Number of persons not in the labor force who currently want a job | Little difference from the prior month at 5.5 million |
| Number of persons marginally attached to the labor force | Approximately 1.5 million |
| Number of discouraged workers | Little change over the month at 367,000 |
Household Survey Data Reveals Stable Labor Market Indicators
Major labor market indicators from the household survey showed little or no change over the month. The number of unemployed persons was essentially unchanged at 6.4 million.
Unemployment rates across major worker groups including adult men (3.8 percent), adult women (3.1 percent), teenagers (11.6 percent), Whites (3.4 percent), Blacks (5.7 percent), Asians (2.8 percent), and Hispanics (4.6 percent) also showed little to no change in September.
Long-term unemployment figures (those jobless for 27 weeks or more) remained steady at 1.2 million, accounting for 19.1 percent of all unemployed persons.
The labor force participation rate and the employment-population ratio were both unchanged over the month, standing at 62.8 percent and 60.4 percent, respectively.
Part-Time Employment and Persons Not in Labor Force
The number of persons employed part-time for economic reasons, who would have preferred full-time employment, was little changed at 4.1 million. This group includes individuals working part-time because their hours had been reduced or they were unable to find full-time jobs.
The number of persons not in the labor force who currently want a job was 5.5 million, showing little difference from the prior month. This group includes individuals who were not actively looking for work during the 4 weeks preceding the survey or were unavailable to take a job.
Among those not in the labor force who wanted a job, the number of persons marginally attached to the labor force was approximately 1.5 million. These individuals had looked for a job sometime in the prior 12 months but had not looked for work in the 4 weeks preceding the survey.
The number of discouraged workers, a subset of the marginally attached who believed that no jobs were available for them, also changed little over the month at 367,000.
This robust jobs data suggests a healthier economic outlook, which has led to speculation that the Federal Reserve may soon initiate its tightening policy.
Canadian Employment Continues to Rise, Exceeding Market Expectations
Encouraging Employment Figures Canada’s Unemployment Rate remained consistent at 5.5% in September, surpassing the market’s predicted slight rise to 5.6%. Employment saw an upswing by 63,800, which exceeded the anticipated 20,000.
In September, Canadian employment figures showed a promising increase of 64,000 (+0.3%), following an upward trend from August with an increase of 40,000 (+0.2%). The employment rate, which represents the proportion of those aged 15 and older who are employed, saw a slight rise to 62.0%, counterbalancing the previous month’s decrease. Despite these changes, the unemployment rate remained steady at 5.5% for the third consecutive month.
Core-aged individuals (25 to 54 years) witnessed significant employment growth, particularly among women (+37,000; +0.6%) and men (+32,000; +0.5%). However, the employment rates for youth (15 to 24 years old) and individuals aged 55 and older remained largely unchanged.
The table below provides a detailed overview of employment changes across various sectors and provinces:
| Sector/Province | Employment Change in September | Percentage Change |
|---|---|---|
| Educational Services | +66,000 | +4.5% |
| Transportation and Warehousing | +19,000 | +1.8% |
| Finance, Insurance, Real Estate, Rental and Leasing | -20,000 | -1.4% |
| Construction | -18,000 | -1.1% |
| Information, Culture and Recreation | -12,000 | -1.4% |
| Quebec | +39,000 | +0.9% |
| British Columbia | +26,000 | +0.9% |
| Alberta | -38,000 | -1.5% |
| New Brunswick | -2,700 | -0.7% |
Year-over-year, average hourly wages showed a 5.0% increase in September, reaching $34.01. This follows increases of 4.9% in August and 5.0% in July. Total hours worked remained virtually unchanged in September, showing a 2.6% increase on a year-over-year basis.
Disclaimer:
All information has been prepared by TraderFactor or partners. The information does not contain a record of TraderFactor or partner’s prices or an offer of or solicitation for a transaction in any financial instrument. No representation or warranty is given as to the accuracy or completeness of this information. Any material provided does not have regard to the specific investment objective and financial situation of any person who may read it. Past performance is not a reliable indicator of future performance.