
The Three Black Crows candlestick pattern is a powerful bearish reversal indicator that every trader should learn to identify and interpret. This pattern appears at the top of an uptrend and often signals a significant shift in market sentiment from bullish to bearish.
Understanding its formation, psychology, and trading implications is crucial for making informed decisions. By mastering the basics of the Three Black Crows candlestick pattern, you can enhance your ability to spot potential trend reversals and manage your trades more effectively.
Understanding the Three Black Crows Candlestick Pattern
The Three Black Crows candlestick pattern is a visual formation on a price chart that signals a potential reversal of an uptrend. Its distinct appearance makes it relatively easy to spot for traders who know what to look for. The pattern consists of three consecutive long-bodied bearish candles that close progressively lower than the previous one. Each candle should open within the body of the preceding candle and close below its low. This structure indicates a strong and decisive takeover by sellers, pushing the price down with significant momentum. Recognizing this formation is the first step toward leveraging the valuable information provided by the Three Black Crows candlestick pattern.
The Formation of the Three Black Crows Candlestick Pattern
To correctly identify the Three Black Crows candlestick pattern, you must look for specific criteria on the chart. The market should be in a clear uptrend before the pattern appears. The formation begins with three long, bearish (red or black) candles that follow one another.
Each of these candles should close at a new low, progressively stepping down. Ideally, each candle opens within the body of the previous day’s candle. Also, the candles should have very small or nonexistent lower wicks, which shows that sellers maintained control throughout the session, closing the price near its low. This distinct structure is what defines the Three Black Crows candlestick pattern.
Psychology Behind the Three Black Crows Candlestick Pattern
The psychology driving the Three Black Crows candlestick pattern is a story of a dramatic power shift between buyers and sellers. After a sustained uptrend where buyers have been in control, the first black crow appears, signaling that sellers are starting to challenge the bullish momentum. The second crow confirms this shift, as sellers continue to drive the price down, often causing early bulls to exit their positions. By the time the third crow forms, conviction among sellers is at its peak. This sustained selling pressure over three consecutive sessions overwhelms the buyers, creating widespread bearish sentiment and suggesting the uptrend has likely ended. This is the core meaning of the Three Black Crows candlestick pattern.
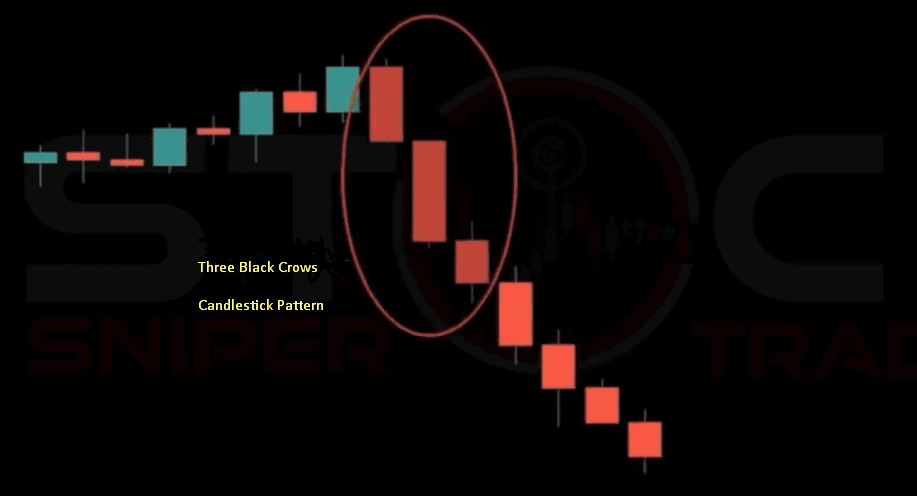
Identifying the Three Black Crows Candlestick Pattern on a Chart
Spotting the Three Black Crows candlestick pattern in real-time requires a keen eye and a solid understanding of its characteristics. It is a bearish reversal pattern, so your first step is to confirm that it appears after a significant uptrend. The pattern itself is composed of three consecutive bearish candlesticks. These candles should be relatively long, indicating strong selling pressure. Each candle must close lower than the one before it, creating a distinct downward staircase effect on the chart. When you see this formation, you are likely looking at the Three Black Crows candlestick pattern, which can be a valuable signal for your trading analysis.
Visual Criteria for the Pattern
The visual criteria for confirming a Three Black Crows candlestick pattern are quite specific. You must first establish the context of a prior uptrend. Following this, look for three consecutive bearish candlesticks. The body of each candle should be long, signifying a substantial price drop from open to close. Furthermore, each candle should open within the real body of the previous candle. Lastly, each candle must close below the low of the preceding candle, with little to no lower shadow or wick. This lack of a lower wick shows that sellers controlled the price action until the very end of the trading session, reinforcing the bearish signal of the Three Black Crows candlestick pattern.
Common Look-alikes and How to Differentiate
Traders sometimes confuse other formations with the Three Black Crows candlestick pattern, leading to false signals. For instance, a simple series of three bearish candles might not qualify if they don’t meet the specific criteria, such as opening within the previous body or having long real bodies. You need to differentiate it from less significant bearish pullbacks within an ongoing uptrend. A true Three Black Crows candlestick pattern shows a decisive and aggressive shift in momentum, not just a minor consolidation. Paying close attention to the length of the candle bodies and the opening and closing prices helps distinguish the authentic pattern from look-alikes.
The Meaning of the Three Black Crows Candlestick Pattern
The core meaning behind the Three Black Crows candlestick pattern is the signal of a potential trend reversal from bullish to bearish. When this pattern forms at the peak of an uptrend, it suggests that buying momentum has been exhausted and sellers have seized control of the market. The three successive days of strong selling pressure, represented by the long bearish candles, indicate a significant shift in market sentiment. Traders interpret this as a high-probability sign that the asset’s price is likely to continue its downward trajectory. Understanding this interpretation is fundamental to effectively trading the Three Black Crows candlestick pattern.
What Does the Pattern Indicate About Market Sentiment?
The Three Black Crows candlestick pattern offers a clear window into market sentiment. Its appearance suggests a transition from greed and optimism to fear and pessimism. During the preceding uptrend, buyers were confident. The first black crow introduces doubt, the second confirms the growing strength of the sellers, and the third solidifies the bearish outlook, often triggering panic selling from those who were late to recognize the reversal. The pattern reveals a decisive and powerful change in control, where sellers overwhelm buyers for three straight sessions, making the bearish sentiment undeniable when analyzing the Three Black Crows candlestick pattern.
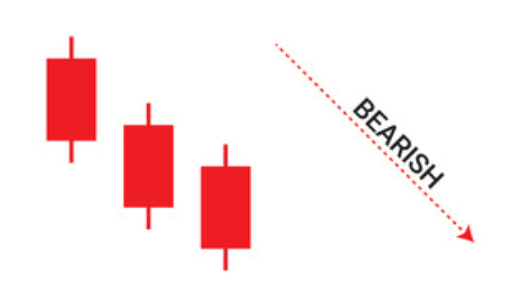
Is the Three Black Crows Bullish or Bearish?
The Three Black Crows candlestick pattern is unequivocally a bearish signal. There is no confusion about its direction; it points downward. The term “Three Black Crows bullish” is a misunderstanding of the pattern’s intent. It appears after an uptrend and signals its potential end and the beginning of a new downtrend. The three long, black (or red) candles demonstrate sustained and intense selling pressure. Any trader seeing this formation should immediately think bearish, as it indicates that the asset’s price is likely heading lower. The pattern’s opposite, known as the Three White Soldiers, is the bullish counterpart.
Crafting a Three Black Crows Pattern Strategy
Developing a robust Three Black Crows pattern strategy involves more than just identifying the pattern. You need a complete plan that includes entry triggers, stop-loss placement, and profit targets. A common strategy is to enter a short position after the third crow closes, confirming the pattern. However, some traders may wait for a small upward retracement before entering to get a better price. Your stop-loss should be placed above the high of the first or second crow to protect against a sudden reversal. A sound Three Black Crows pattern strategy ensures you manage risk while capitalizing on the bearish signal.
Entry and Exit Points
Determining your entry and exit points is a critical component of trading the Three Black Crows candlestick pattern. A conservative entry point would be to place a short sell order below the low of the third candlestick, waiting for a confirmation of the downward move. A more aggressive entry could be taken near the close of the third candle. For your exit strategy, a stop-loss order can be placed above the high of the entire pattern or above the high of the second crow. Take-profit targets can be set at previous support levels or by using a risk-reward ratio, such as 1:2 or 1:3, based on your stop-loss distance.
Using Confirmation with Other Indicators
To increase the reliability of your trades, you should always seek confirmation when using the Three Black Crows candlestick pattern. Relying on the pattern alone can sometimes lead to false signals. You can use technical indicators like the Relative Strength Index (RSI) to confirm overbought conditions before the pattern forms. An RSI reading above 70 followed by the three crows adds significant weight to the bearish signal. Similarly, a bearish crossover on the Moving Average Convergence Divergence (MACD) indicator can serve as another layer of confirmation, strengthening your conviction to enter a short trade based on the Three Black Crows candlestick pattern.
Three Black Crows Pattern Examples in Trading
Seeing Three Black Crows pattern examples on actual price charts is the best way to understand how this formation plays out in a live market. For instance, in the forex market, you might see a currency pair like EUR/USD in a strong uptrend for several days. Suddenly, a long bearish candle appears, followed by two more, each closing progressively lower. This classic formation would signal a potential shorting opportunity. By studying historical charts across different assets, like stocks or commodities, you can train your eye to quickly and accurately identify the Three Black Crows candlestick pattern and observe what happens after 3 Black Crows form.
Examples from the Forex Market
In the forex market, the Three Black Crows candlestick pattern can be a very effective reversal signal due to the high liquidity and volatility. Imagine the GBP/JPY pair has been climbing steadily. At the peak, you notice the formation of three consecutive, long bearish candles. The first opens high but closes significantly lower. The second opens within the body of the first and pushes the price down further. The third does the same, closing near its low. This would be a textbook example of the Three Black Crows candlestick pattern, indicating a strong likelihood that the pound will weaken against the yen in the near term.
Examples from the Stock Market
The stock market also provides numerous examples of the Three Black Crows candlestick pattern. Consider a popular tech stock that has been on a bull run for weeks, reaching a new all-time high. Then, on high volume, a large bearish candle forms. This is followed by two more bearish candles on the next two days, each closing lower than the last. This formation would suggest that the bullish momentum has stalled and institutional sellers are stepping in. For a trader, this appearance of the Three Black Crows candlestick pattern is a strong signal to consider closing long positions or initiating a new short position.
What Happens After 3 Black Crows?
Many traders wonder what happens after 3 Black Crows appear on a chart. In most cases, the formation is followed by a continuation of the downward price movement, confirming the start of a new downtrend or a significant correction. The intense selling pressure demonstrated over the three sessions often carries forward as more traders recognize the bearish shift and join the selling. However, the market does not always move in a straight line. Sometimes, a period of consolidation or a minor bullish pullback may occur immediately following the pattern before the downtrend resumes. This is why confirmation and risk management are key when trading the Three Black Crows candlestick pattern.

Immediate Price Action
The immediate price action following a Three Black Crows candlestick pattern is typically bearish. The momentum generated by three consecutive days of strong selling often spills over into the following sessions. You will frequently see the price continue to fall, although the pace may slow down compared to the rapid decline seen during the pattern’s formation. It is also possible to see a brief pause or a small bounce as some short-sellers take profits. However, this bounce is often short-lived and provides a new opportunity for other sellers to enter the market at a more favorable price, anticipating a continuation of the downtrend initiated by the Three Black Crows candlestick pattern.

Long-Term Price Implications
The long-term implications of a Three Black Crows candlestick pattern can be significant. When the pattern appears on a higher time frame, such as a daily or weekly chart, it can signal a major trend reversal that could last for weeks or even months. The pattern marks a decisive top and suggests that the underlying sentiment for the asset has fundamentally shifted from bullish to bearish. While short-term pullbacks can occur, the overarching direction indicated by the Three Black Crows candlestick pattern is down. Traders and investors use this formation as a warning sign to re-evaluate their long positions and prepare for a potential extended period of declining prices.
Three Black Crows and Three White Soldiers
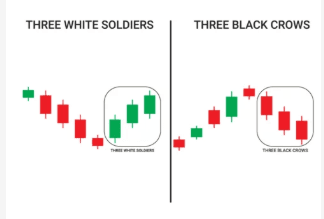
The Three Black Crows and Three White Soldiers patterns are direct opposites. While the Three Black Crows is a strong bearish reversal pattern that appears after an uptrend, the Three White Soldiers is its bullish counterpart. The Three White Soldiers pattern consists of three consecutive long-bodied bullish candles that appear after a downtrend, signaling a potential reversal to the upside. Recognizing both patterns allows you to identify major turning points in the market, whether the sentiment is shifting from bullish to bearish or vice versa. Understanding the relationship between the Three Black Crows candlestick pattern and its opposite is crucial for a complete analysis.

The Opposite Pattern: Three White Soldiers
The Three White Soldiers pattern is the exact opposite of the Three Black Crows candlestick pattern. It forms at the bottom of a downtrend and consists of three long, bullish (white or green) candles. Each candle opens within the body of the previous one and closes higher, creating an upward staircase effect. This pattern indicates that buyers have taken firm control from sellers and that a new uptrend is likely beginning. It is also known as the 3 Black Soldiers pattern by some, though this is a less common and potentially confusing name. Just as the three crows signal a top, the three soldiers signal a bottom.

Comparing the Two Patterns
When comparing the Three Black Crows candlestick pattern with the Three White Soldiers, the key difference is the market direction they signal. The Three Black Crows is bearish; the Three White Soldiers is bullish. Both patterns signify a strong and decisive reversal of the prior trend, driven by sustained pressure over three consecutive trading sessions. They are considered among the more reliable reversal patterns because they represent a significant shift in market psychology. A trader who can identify both the Three Black Crows and Three White Soldiers patterns is well-equipped to spot major turning points in any market.
Assessing the Three Black Crows Pattern Success Rate
The Three black crows pattern success rate is a topic of great interest to technical analysts. While no candlestick pattern is 100% accurate, the Three Black Crows is considered one of the more reliable reversal signals. Its success rate is significantly enhanced when it appears after a clear and extended uptrend and when it is confirmed by other technical indicators. For instance, if the pattern forms at a major resistance level and is accompanied by bearish divergence on the RSI or MACD, its probability of success increases substantially. The context in which the Three Black Crows candlestick pattern appears is just as important as the pattern itself.

Factors Influencing Reliability
Several factors influence the reliability of the Three Black Crows candlestick pattern. The length of the preceding uptrend is crucial; a pattern that forms after a long, sustained rally is more significant than one that appears after a short-term price spike. The volume during the formation of the three candles is another key factor. Increasing volume on each of the three bearish days adds to the credibility of the reversal signal. Furthermore, the size of the candle bodies matters. Long bodies with small or no wicks indicate strong conviction from sellers, making the Three Black Crows candlestick pattern a more reliable indicator of a pending downtrend.

How to Handle False Signals
Even reliable patterns can produce false signals, and the Three Black Crows candlestick pattern is no exception. A false signal might occur if the pattern forms during a period of low liquidity or if it is part of a larger consolidation phase rather than a true top. The best way to handle a false signal is through disciplined risk management. Always use a stop-loss order to limit your potential losses if the price moves against your position. Waiting for confirmation from price action (like a break below the third crow’s low) or other indicators before entering a trade can also help you filter out many of the potential false signals associated with the Three Black Crows candlestick pattern.
Combining the Three Black Crows with Other Tools
To maximize the effectiveness of the Three Black Crows candlestick pattern, it should be used in conjunction with other technical analysis tools. Combining it with support and resistance levels, trendlines, and volume analysis can provide a more comprehensive view of the market. For example, if the Three Black Crows pattern forms right at a key resistance level that has been respected in the past, the bearish signal becomes much stronger. Using a multi-faceted approach helps to confirm the reversal signal and increases your confidence in the trade setup provided by the Three Black Crows candlestick pattern.

Support and Resistance Levels
Incorporating support and resistance levels into your analysis of the Three Black Crows candlestick pattern is a powerful technique. A Three Black Crows formation that appears directly at a well-established resistance zone is a much stronger bearish signal. The resistance level acts as a ceiling that the price failed to break through, and the subsequent appearance of the three crows confirms that sellers have stepped in with force at that level. Conversely, after the pattern forms, previous support levels become potential price targets for your short trade. Watching how price interacts with these key levels adds valuable context to the Three Black Crows candlestick pattern.

Volume and Oscillator Confirmation
Volume analysis and oscillators can provide excellent confirmation for the Three Black Crows candlestick pattern. Ideally, you want to see volume increasing throughout the three days of the pattern’s formation, which indicates growing participation from sellers. Oscillators like the Relative Strength Index (RSI) or the Stochastic Oscillator can also add value. If the RSI shows a bearish divergence—where the price makes a new high but the RSI makes a lower high—just before the Three Black Crows pattern appears, it strongly reinforces the bearish reversal signal. This confluence of signals makes the trading decision based on the Three Black Crows candlestick pattern much more robust.
Spiritual Meaning vs. Market Meaning
While the name “Three Black Crows” might evoke certain imagery, it is important to separate any “3 black crows spiritual meaning” from its technical application in financial markets. In trading, the name is simply a memorable label for a specific bearish price pattern. Its meaning is derived from market psychology and the balance of supply and demand, not from any form of omen or superstition. Traders should focus on the objective data the pattern provides about price action and seller conviction. The Three Black Crows candlestick pattern is a tool for technical analysis, and its interpretation should remain grounded in market dynamics.

The Origin of the Name
The name “Three Black Crows” comes from Japanese candlestick charting terminology, where many patterns have evocative names based on nature or warfare. The “crows” refer to the three consecutive black (or bearish) candles, and their appearance is likened to a group of crows sitting on a high branch, looking down ominously. This descriptive name helps traders to quickly remember the pattern’s bearish implication. While it has no spiritual connection, the name effectively conveys the sense of impending doom for the prior uptrend, which is the core message of the Three Black Crows candlestick pattern.

Why to Avoid Superstition in Trading
Trading based on superstition, such as a perceived “3 black crows spiritual meaning,” is a recipe for disaster. Successful trading relies on objective analysis, a clear strategy, and disciplined risk management, not on omens or gut feelings. The financial markets are driven by economic data, corporate earnings, and mass human psychology—factors that can be analyzed and measured. The Three Black Crows candlestick pattern is valuable because it is a quantifiable representation of a shift in that psychology. Relying on superstition introduces randomness and emotion into your decision-making process, undermining the logical foundation required for consistent profitability in trading.
Conclusion
In summary, the Three Black Crows candlestick pattern is a vital tool for any trader looking to identify potential bearish reversals. This pattern, consisting of three consecutive long bearish candles after an uptrend, provides a clear and powerful signal that market sentiment is shifting. By understanding its formation, the psychology behind it, and how to combine it with other analytical tools, you can significantly improve your trading accuracy. Remember to always seek confirmation and practice sound risk management. Acknowledging the clear signals provided by the Three Black Crows candlestick pattern can help you stay on the right side of the market.
FAQs

How to trade 3 black crows?
To trade the 3 Black Crows, you should identify the pattern at the top of an uptrend. You can enter a short position after the third candle closes. Place a stop-loss above the high of the pattern to manage risk.
What does 3 crows mean in trading?
In trading, the 3 Black Crows pattern is a strong bearish reversal signal. It indicates that sellers have overwhelmed buyers for three consecutive sessions. This suggests that the prior uptrend is likely over.
What is a 3 candlestick trade strategy?
A 3 candlestick trade strategy involves using patterns composed of three candles, like the Three Black Crows or Three White Soldiers, to make trading decisions. These patterns often signal strong shifts in market momentum. A triple top is another pattern traders watch.

How reliable is the Three Black Crows pattern?
The Three Black Crows pattern is considered one of the more reliable reversal patterns. Its reliability increases when it appears after a long uptrend and is confirmed by high volume or other technical indicators. No pattern is foolproof, so risk management is key.
Which candle is best for scalping?
Scalping often relies on shorter timeframes and patterns that signal quick moves. While larger patterns like the Three Black Crows can provide context, scalpers typically focus on single candle formations like Dojis or Hammers on 1-minute or 5-minute charts.
How to identify a false signal?
You can identify a false signal by looking for a lack of confirmation. If a Three Black Crows pattern forms on low volume or fails to break a key support level, it might be a false signal. Always use stop-losses to protect against them.

What is the 3 black crows pattern?
The 3 Black Crows pattern is a bearish candlestick formation that signals a potential trend reversal. It consists of three consecutive long, bearish candles that appear after an uptrend. Each candle closes progressively lower.
What do Three Black Crows indicate?
Three Black Crows indicate a strong shift in market control from buyers to sellers. The pattern suggests that the preceding uptrend has lost momentum. It is a powerful signal of a potential new downtrend.
What’s the best strategy with a triple top?
The best strategy for a triple top is to wait for the price to break below the support level (neckline) that connects the lows between the three peaks. You can enter a short position on this breakdown. Place a stop-loss above the resistance level of the peaks.
What happens after 3 Black Crows?
After a 3 Black Crows pattern, the price often continues to decline as the bearish momentum persists. While a short-term bounce is possible, the pattern usually marks the beginning of a new downtrend or a significant price correction.
Disclaimer:
All information has been prepared by TraderFactor or partners. The information does not contain a record of TraderFactor or partner’s prices or an offer of or solicitation for a transaction in any financial instrument. No representation or warranty is given as to the accuracy or completeness of this information. Any material provided does not have regard to the specific investment objective and financial situation of any person who may read it. Past performance is not a reliable indicator of future performance.