
In Market outlook this week, markets cautious as Iran-US peace talks resume, RBA expected to hike to 4.35%, yen intervention fears linger, and JOLTS/NFP loom. Full analysis and key levels across gold, oil, forex, and equities.
📌 Key Takeaways – This Week’s Market Drivers
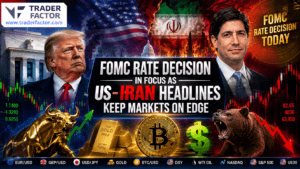
Market Outlook: Cautious Mood Amid Fresh Middle East Proposals, RBA Rate Hike, Yen Intervention, JOLTS and NFP Reports
TraderFactor Market Report | Week of May 04, 2026
Global markets are trading cautiously as traders juggle fresh Middle East peace proposals with a busy economic calendar. The RBA is widely expected to deliver its third consecutive rate hike to 4.35%, driven by surging inflation that hit 4.6% in March. Elsewhere, yen intervention fears are simmering after Japan took action near the 160.00 level, while gold attempts to hold its safe-haven status and Bitcoin has surged past $80,000.
“What is driving the market today?”
Markets are being driven by three core forces: fresh US‑Iran peace proposals (which could lower oil prices), expectations of an RBA rate hike to 4.35% (supporting the Aussie dollar), and lingering yen intervention risks ahead of key US labour data including JOLTS and NFP reports.

Traders are also watching “Project Freedom”, the US Navy operation to escort stranded ships out of the Strait of Hormuz, announced by President Trump over the weekend. Any military incident during the mission could spike oil prices again, while a peaceful resolution might reverse recent commodity gains. With central bank decisions, geopolitical headlines, and labour data all converging, volatility is expected to remain elevated throughout the week.
Support & Resistance Summary Table

| Asset | Current Price | S2 | S1 | R1 | R2 |
|---|---|---|---|---|---|
| Gold (XAUUSD) | 4610 | 4550 | 4580 | 4650 | 4700 |
| WTI Crude Oil | 98.28 | 95.00 | 97.00 | 100.00 | 105.00 |
| EURUSD | 1.17337 | 1.1680 | 1.1700 | 1.1780 | 1.1820 |
| GBPUSD | 1.35922 | 1.3550 | 1.3570 | 1.3650 | 1.3700 |
| AUDUSD | 0.72111 | 0.7150 | 0.7180 | 0.7250 | 0.7300 |
| NZDUSD | 0.59209 | 0.5880 | 0.5900 | 0.5960 | 0.6000 |
| USDJPY | 156.504 | 155.50 | 156.00 | 158.00 | 160.00 |
| USDCAD | 1.35879 | 1.3520 | 1.3550 | 1.3650 | 1.3700 |
| USDCHF | 0.78052 | 0.7750 | 0.7780 | 0.7850 | 0.7920 |
| BTCUSD | 80440 | 78000 | 79500 | 82000 | 85000 |
| NAS100 | 27816 | 27400 | 27600 | 28000 | 28300 |
| US30 (Dow) | 49470 | 49000 | 49200 | 50000 | 50500 |
| S&P 500 | 7248 | 7150 | 7200 | 7300 | 7400 |
How to use this table: S2 and S1 are key downside levels where buyers typically step in; a break below S2 signals trend weakness. R1 and R2 are upside obstacles; a break above R2 confirms strong momentum.
Gold Analysis (XAUUSD)
“Why is gold struggling to maintain its position as a safe haven?”
Gold is facing headwinds from a stable US dollar and reduced immediate safe-haven demand as US-Iran peace talks resume, though geopolitical uncertainty continues to provide a floor near $4,580.

Gold is trading at 4,610, caught between conflicting market forces. While resumed diplomatic efforts between the U.S. and Iran have eased the immediate risk premium and reduced safe-haven demand, the launch of the U.S. Navy’s ‘Project Freedom’ to escort vessels through the Strait of Hormuz introduces military risks that could ignite buying at any moment. Furthermore, underlying support remains strong due to sustained central bank buying and persistent inflation concerns. Looking ahead, a breakout above 4,650 targets 4,700, while a drop below 4,580 could trigger a decline toward 4,550.
Oil Analysis (WTI Crude)
“Why is oil recovering above $98 after an earlier gap lower?”
Oil is recovering from an initial gap down as traders weigh President Trump’s “Project Freedom” escort mission against the resumption of US-Iran peace talks, with supply risks persisting despite diplomatic efforts.
WTI crude is trading at 98.28 after dipping lower overnight. The initial weakness followed news of renewed peace proposals, but prices rebounded as the reality of the Strait of Hormuz blockade now in its third month continues to constrain global supply.
President Trump’s announcement that the US Navy will begin guiding stranded foreign ships out of the strait from Monday morning carries both bullish and bearish implications. A successful, peaceful mission would relieve supply bottlenecks, but any interference from Iranian forces could trigger a sharp spike in prices.
With Brent crude futures still reflecting a mid double-digit risk premium, oil is likely to remain highly sensitive to headlines this week. A break above 100 would target 105, while a diplomatic breakthrough could send prices back toward 95.
Currencies Analysis (Forex Market)
“Which forex pairs are moving most as the RBA prepares to hike and yen intervention fears linger?”
AUDUSD is gaining on pre‑RBA rate hike positioning, USDJPY remains volatile near 156.50 after suspected intervention, while EURUSD and GBPUSD are steady ahead of US labour data.
AUDUSD
“Why is the Australian dollar gathering strength despite global uncertainty?”
AUDUSD is rallying as markets price in a near‑certain 25 basis point RBA rate hike to 4.35% on Tuesday, driven by inflation that surged to 4.6% in March, up sharply from 3.7% in February.

The pair is trading at 0.72111, near four-year highs, supported by expectations that the RBA will deliver its third consecutive hike. Australia’s inflation spike was largely fuelled by a 32.8% monthly jump in automotive fuel prices due to the Middle East conflict, which has pushed headline CPI well above the RBA’s 2-3% target band. A hawkish hike — particularly if accompanied by upwardly revised inflation forecasts — could push AUDUSD toward 0.7300. However, a dovish hold or hints that this is the last hike would likely trigger a sharp reversal toward 0.7150.
USDJPY
“Why is the yen volatile and intervention fears lingering?”
USDJPY is trading near 156.50, recovering from lows of 155.50 after Japanese authorities conducted a rate check and allegedly intervened to support the yen when the pair breached 160.00.
The pair plunged nearly 200 pips to 155.50 on Thursday after reaching 160.00 — widely seen as Tokyo’s trigger level for action. The Japanese Ministry of Finance has since conducted a rate check, a classic pre-intervention warning shot. Finance Minister Satsuki Katayama warned traders to “keep their phones ready,” a phrase that has preceded actual intervention in the past. With Japan entering the Golden Week holiday, liquidity is thinner, making the market more vulnerable to official action. A break above 158.00 would increase intervention risk again, while a drop below 155.50 would signal that official action has had a lasting impact.
EURUSD
“Is the euro holding its ground ahead of US data?”
EURUSD is trading at 1.17337, consolidating recent gains as traders await US labour market signals later this week.
The pair has found support near 1.1700 and is attempting to push higher, but resistance at 1.1780 remains formidable. The recent Fed meeting revealed an increasingly split committee, with four dissenters pushing back against an easing bias, while one dissented in favour of a rate cut. This confusion has left the dollar without a clear directional bias. This week’s ISM Services PMI, JOLTS, and NFP reports will provide fresh catalysts; strong US labour data would likely push EURUSD back below 1.1700, while weakness could open the door to 1.1820.
GBPUSD
“Can sterling continue its bullish run?”
GBPUSD is trading at 1.35922, near a key resistance zone between 1.3575 and 1.3598 that has now turned into support.
The pair has been one of the strongest performers this week, breaking above key moving averages after basing near the 100-day MA at 1.3465. Buyers have stepped in on dips, pushing the pair to new highs at 1.3643 — the highest level since February 17. The next upside target is 1.3650, then 1.3700. However, any disappointment in US labour data or a dovish shift from the Fed would be needed to sustain the rally; otherwise, a pullback toward 1.3550 is possible.
NZDUSD
“Why is the kiwi lagging behind the Aussie?”
NZDUSD is trading near 0.59209, underperforming its Australian cousin as traders await New Zealand employment and unemployment data on Wednesday.
The pair has been range-bound between 0.5880 and 0.5960, lacking a clear catalyst. While the RBA is expected to hike, the RBNZ is seen as closer to cutting rates, especially if New Zealand’s labour market shows signs of cooling. Strong employment data would narrow that policy divergence and could push NZDUSD toward 0.6000, while weak data would send it back to 0.5880.
USDCAD
“Why is the Canadian dollar stable despite higher oil?”
USDCAD is trading at 1.35879, holding steady even as WTI remains above $98, because the Bank of Canada is expected to hold rates steady and markets are pricing in future cuts.
The pair has refused to break below 1.3550 despite oil prices at nearly $100, as the loonie’s traditional positive correlation with crude has weakened. The Bank of Canada is seen as dovish relative to the Fed, and any comments from officials this week reinforcing that view would push USDCAD higher toward 1.3650-1.3700. For a sustained move toward 1.3500, oil would need to rally further and the Fed would need to signal a clear dovish pivot.
USDCHF
“Is the Swiss franc under pressure again?”
USDCHF is trading at 0.78052, with the franc remaining weak as the Swiss National Bank tolerates a softer currency to support exports.
The pair has been grinding higher, and a break above 0.7850 would target 0.7920. The SNB has shown little appetite to resist CHF weakness, making USDCHF a straightforward dollar‑positive trade unless global risk sentiment deteriorates sharply.
Bitcoin Analysis (BTCUSD)
“Why has Bitcoin surged above 80,000?
Bitcoin is trading at 80,440, driven by strong ETF inflows, rising institutional demand, and a growing decoupling from traditional risk assets as investors seek alternative hedges against inflation.
The cryptocurrency broke through the psychological 80,000 level as momentum trading and spot ETF flows collided with broader market forces. Unlike gold, which has struggled to gain traction, Bitcoin has benefited from a narrative that positions it as a hedge against both inflation and geopolitical uncertainty.
Reduced correlation with equities has also attracted diversification flows. Key support sits at 79,500 and 78,000, while resistance is at 82,000 and 85,000. A close above 82,000 would open the door to new all-time highs, while a break below 78,000 would signal a potential trend reversal.
Equities Analysis
“Why is the stock market upbeat despite global uncertainty?”
US equities are trading near record highs as investors balance optimism over potential US‑Iran peace proposals with resilience in tech earnings and expectations of a soft labour market report.

The NAS100 is trading at 27,816, the S&P 500 at 7,248, and the Dow Jones at 49,470. Gains have been broad-based, supported by the view that US labour market softening will allow the Fed to cut rates later this year. However, upside momentum is capped by oil prices near $100, which threaten corporate margins, and by lingering intervention risks in currency markets. Key resistance for the NAS100 stands at 28,000, then 28,300; support is at 27,600 and 27,400.
Geopolitical Developments
“How are the new Middle East proposals affecting markets?”
Fresh diplomatic efforts between the US and Iran are being watched closely, with Tehran reviewing a US response to its 14‑point peace proposal, while President Trump simultaneously launches “Project Freedom” to guide trapped ships out of the Strait of Hormuz.
Iran has received and is reviewing the US response to its 14‑point peace proposal, which calls for an end to the war, withdrawal of US forces from areas surrounding Iran, and the lifting of the naval blockade. However, President Trump has signalled skepticism, stating that Iran “has not paid a big enough price.” In a separate development, Trump announced that the US Navy will begin guiding stranded foreign ships out of the Strait of Hormuz starting Monday morning, a mission he called “Project Freedom.” While described as a humanitarian gesture, the operation carries significant military risks.

The Strait of Hormuz has been effectively closed since the war began on February 28, with hundreds of vessels still trapped. Any interference from Iranian forces could trigger a sharp escalation and spike oil prices toward 110–120.
Economic Calendar (This Week)
“What economic data should traders watch this week?”
This week’s calendar is packed with high‑impact events: the RBA rate decision on Tuesday, JOLTS job openings and ISM Services PMI on Tuesday, New Zealand employment data and ADP NFP on Wednesday, and the all‑important US Non‑Farm Payrolls report on Friday.
Monday
The calendar is quiet with no major releases, giving markets time to digest weekend geopolitical headlines.
Tuesday
🇦🇺 RBA Cash Rate Decision – The Reserve Bank of Australia is widely expected to raise rates by 25 basis points to 4.35%, marking its third consecutive hike.
Inflation surged to 4.6% in March (up from 3.7% in February), driven largely by a 32.8% monthly jump in fuel prices amid the Middle East conflict. The trimmed mean CPI came in at 0.8% for Q1 2026, slightly below expectations of 0.9%, suggesting underlying inflation pressures may be less intense than headline figures imply.
However, the labour market remains tight, with unemployment at 4.3%, and the RBA’s February oil price assumption of $64 per barrel has been overtaken by Brent crude trading near $110. Traders will be closely watching for hawkish or dovish signals in the post-meeting statement.
🇺🇸 ISM Services PMI – A composite index measuring business activity in the non‑manufacturing sector. A reading above 50 indicates expansion. Strong data (above 55) would boost the USD, while weak data would pressure it.
🇺🇸 JOLTS Job Openings – Measures labour demand. A higher number suggests a tight labour market, which would be USD‑bullish, while a lower number supports the case for Fed rate cuts.
Wednesday
🇳🇿 New Zealand Employment & Unemployment Reports – Key drivers for NZD. Strong employment growth and falling unemployment would narrow the policy divergence between the RBNZ and the Fed, supporting NZDUSD.

🇺🇸 ADP Non‑Farm Employment Change – A precursor to Friday’s NFP. A strong ADP print would raise expectations for NFP, supporting the USD.
🇺🇸 FOMC Member Speeches – Traders will watch for hawkish or dovish comments, which can impact USD, gold, and equities.
Friday
🇺🇸 Non‑Farm Payrolls (NFP) – The most important US labour market report of the month. NFP measures the change in the number of employed people outside the farming sector. Analysts expect moderate growth. A stronger-than-expected number would boost the DXY and pressure gold and equities, as it would reduce the case for Fed rate cuts. A weaker report would have the opposite effect, pushing the dollar lower while lifting gold and stocks.
Historically, NFP releases cause significant volatility in currency pairs like EUR/USD and GBP/USD. The most dangerous scenario for markets would be weak employment combined with high wage growth — a stagflation signal that would send mixed messages to the Fed.
Final Market Outlook
Markets are entering a high‑volatility week driven by three converging themes: Middle East peace efforts (real or not), central bank actions (the RBA hike and Fed rate expectations), and critical US labour data (JOLTS, ADP, NFP).
What to watch next:
- Any clash during the “Project Freedom” escort mission (oil would spike)
- RBA decision and forward guidance (AUDUSD will move sharply)
- US labour data: JOLTS (Tue), ADP (Wed), NFP (Fri) — each could reset USD expectations

Use the support/resistance table above for entries and exits. Wait for confirmation at key levels.
Author Details:
Phyllis Wangui
Senior Market Analyst, TraderFactor
Phyllis Wangui is a seasoned financial markets analyst with over a decade of experience in forex and CFD brokerage evaluation. Specializing in regulatory compliance and risk assessment, she leads the TraderFactor reviews team in delivering transparent, data-driven broker breakdowns that help retail traders navigate complex offshore and Tier-1 trading environments.
Reviewed by Alex Kanyi
Head of Compliance | TraderFactor
“This report is for general information only. Trading involves significant risk. Seek independent advice before acting on any content.”
[Subscribe to the TraderFactor Newsletter]
Last Updated: May 2026
Disclaimer:
All information has been prepared by TraderFactor or partners. The information does not contain a record of TraderFactor or partner’s prices or an offer of or solicitation for a transaction in any financial instrument. No representation or warranty is given as to the accuracy or completeness of this information. Any material provided does not have regard to the specific investment objective and financial situation of any person who may read it. Past performance is not a reliable indicator of future performance.