
Learn how to read candlestick patterns in forex trading. Discover bullish and bearish candlestick signals, chart analysis techniques, and beginner-friendly trading strategie
Key Takeaways
- ✓ Candlestick patterns help traders understand market sentiment and price action.
- ✓ Bullish candlestick patterns can signal potential buying opportunities.
- ✓ Bearish candlestick patterns can warn traders of possible downward reversals.
- ✓ Patterns such as Hammer, Bullish Engulfing, Morning Star, Shooting Star, and Evening Star are useful for beginners.
- ✓ Candlestick patterns are more reliable when combined with support, resistance, trend analysis, and risk management.
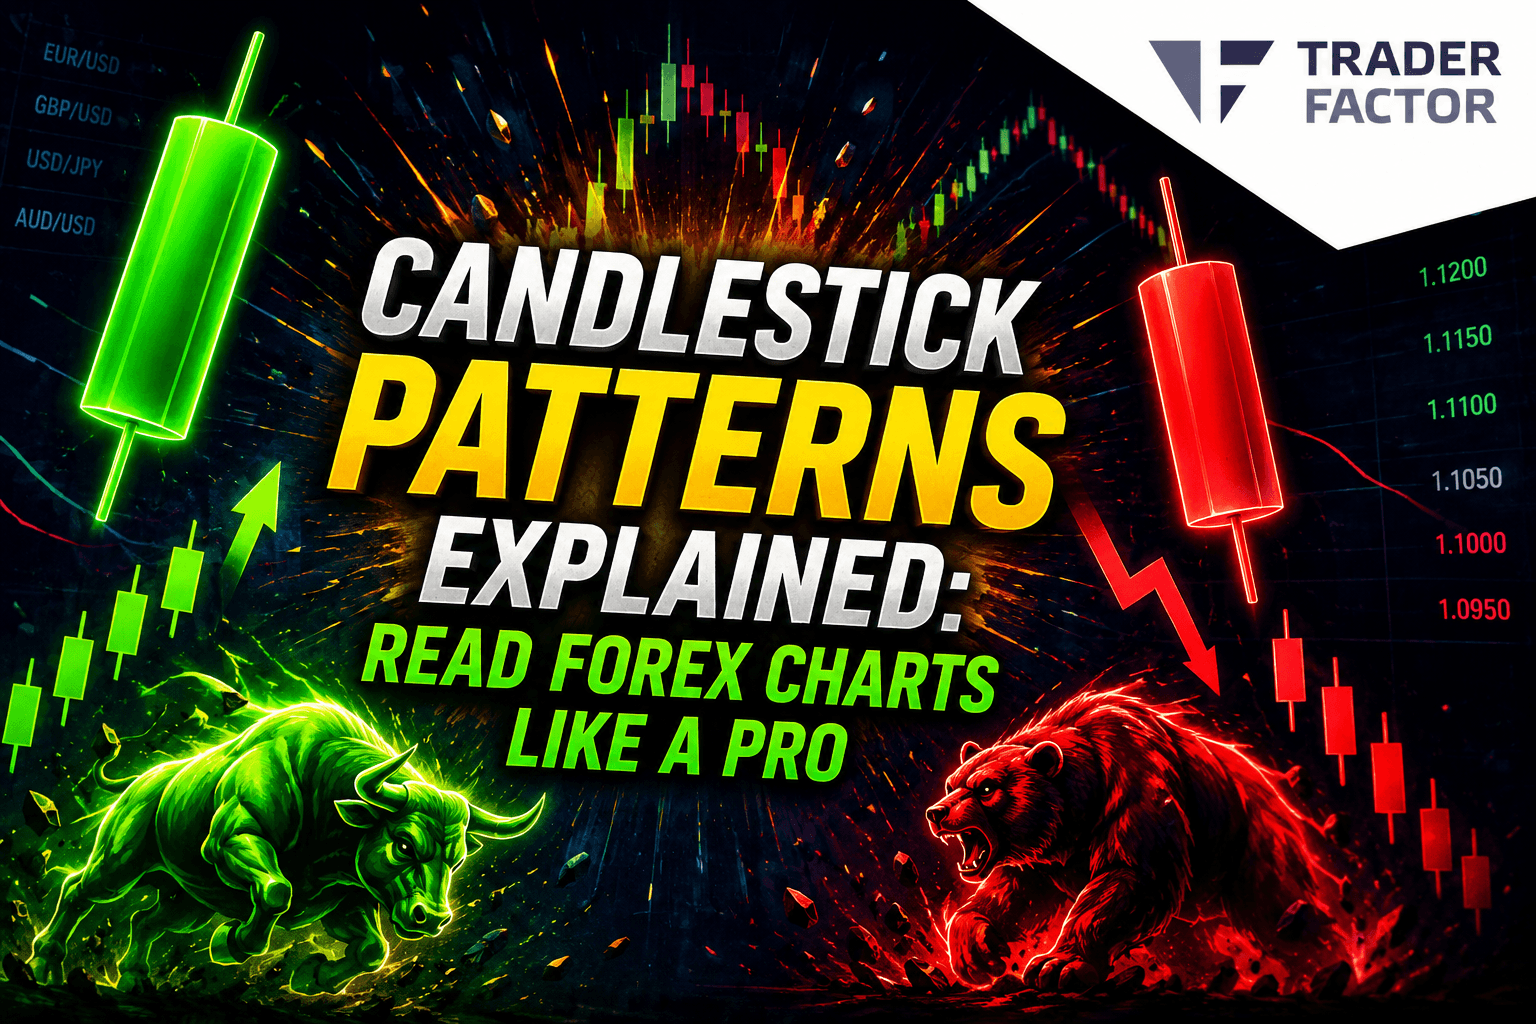
Candlestick Patterns Explained: Beginner’s Guide to Reading Forex Charts
TraderFactor Guide 2026
Candlestick patterns are a must-know for any forex trader. They give you clear, visual cues about market trends and potential price reversals, helping you make smarter trading decisions. If you’re new to trading, getting a handle on these patterns is one of the best ways to build a solid foundation. In this guide, we’ll break down how you can read, analyze, and apply candlestick patterns to improve your forex trading strategy.
What Are Candlestick Patterns in Forex Trading?
Candlestick patterns are visual formations on a price chart that help traders understand market sentiment and predict potential price movements. Originally developed by Japanese rice traders in the 18th century, Japanese candlesticks have become one of the most widely used tools in forex trading, stocks, commodities, and cryptocurrencies.
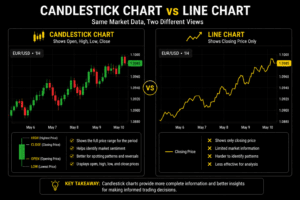
Unlike simple line charts, candlestick charts provide more detailed information about price action during a specific period. Each candlestick shows four important price points:
- Opening price
- Closing price
- Highest price
- Lowest price
By studying these price movements, traders can identify whether buyers or sellers are controlling the market and anticipate possible trend reversals or continuations.
Candlestick chart compared with line chart in forex trading
Why Candlestick Patterns Matter
Candlestick patterns help traders:
- Identify potential market reversals
- Confirm ongoing trends
- Spot buying and selling opportunities
- Improve entry and exit timing
- Understand market psychology
Because forex markets are heavily influenced by trader behavior, candlestick patterns provide valuable insights into the battle between buyers (bulls) and sellers (bears).
Understanding Candlestick Anatomy
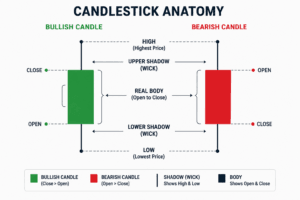
Every candlestick consists of two main parts:
The Body
The body represents the difference between the opening and closing prices.
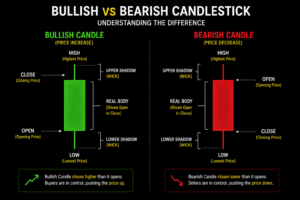
- A bullish (green) candle forms when the closing price is higher than the opening price.
- A bearish (red) candle forms when the closing price is lower than the opening price.
The Wick (Shadow)
The thin lines extending above and below the body are called wicks or shadows.
- The upper wick shows the highest price reached during the period.
- The lower wick shows the lowest price reached during the period.

Long wicks often indicate strong market rejection and can signal potential reversals.
Example of a Bullish Candlestick
When EUR/USD opens at 1.1000 and closes at 1.1050, buyers have pushed prices higher during the trading session. The resulting bullish candlestick signals buying strength.
Example of a Bearish Candlestick
When EUR/USD opens at 1.1050 and closes at 1.1000, sellers have dominated the session. The resulting bearish candlestick indicates selling pressure.
How Candlestick Charts Reflect Market Psychology
Every candlestick tells a story about trader sentiment.
For example:
- Large bullish candles indicate aggressive buying.
- Large bearish candles indicate strong selling pressure.
- Small-bodied candles suggest market indecision.
- Long wicks often reveal rejected price levels.
By learning to interpret these signals, traders can better understand market psychology and make more informed trading decisions.
Candlestick Patterns vs Line Charts
Many beginners start with line charts because they are simple. However, line charts only show closing prices and provide limited information.
Candlestick charts offer a more complete picture by displaying:
| Feature | Line Chart | Candlestick Chart |
|---|---|---|
| Opening Price | No | Yes |
| Closing Price | Yes | Yes |
| High Price | No | Yes |
| Low Price | No | Yes |
| Market Sentiment | Limited | Strong |
| Pattern Recognition | Limited | Excellent |
For this reason, most professional forex traders rely on candlestick chart analysis when making trading decisions.
Candlestick patterns are powerful tools that help traders read market sentiment, identify potential trading opportunities, and improve decision-making. Before learning advanced trading strategies, it is essential to understand how candlestick charts work and what each candle reveals about buyer and seller behavior.

Most Important Bullish Candlestick Patterns Every Beginner Should Know
Bullish candlestick patterns signal that buyers are gaining control of the market and that prices may move higher. These patterns often appear at the end of a downtrend or during a market correction, giving traders clues that a potential reversal could be approaching.
While no candlestick pattern guarantees success, understanding the most common bullish candlestick patterns can help traders identify high-probability trading opportunities and improve their market timing.
Let’s explore the most important bullish candlestick patterns every beginner should know.
1. Hammer Pattern
The Hammer Pattern is one of the most popular bullish reversal patterns in forex trading.
It forms after a downward trend and has a small body near the top of the candle with a long lower shadow. The long wick shows that sellers pushed prices lower, but buyers stepped in and drove the price back up before the candle closed.
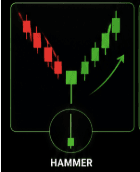
What the Hammer Pattern Tells Traders
- Sellers initially controlled the market.
- Buyers absorbed the selling pressure.
- Market sentiment may be shifting from bearish to bullish.
- A trend reversal could be forming.
How to Trade the Hammer Pattern
Many traders wait for the next candle to close above the hammer before entering a buy trade. This confirmation helps reduce false signals.
Example
Imagine EUR/USD falls steadily for several hours. A hammer forms at a key support level, followed by a strong bullish candle. This combination may indicate the beginning of an upward reversal.
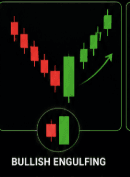
2. Bullish Engulfing Pattern
The Bullish Engulfing Pattern is one of the strongest bullish candlestick signals.
This pattern consists of two candles:
- A small bearish candle.
- A larger bullish candle that completely engulfs the previous candle’s body.
The second candle demonstrates that buyers have overwhelmed sellers and taken control of the market.
What the Bullish Engulfing Pattern Indicates
- Strong buying momentum.
- Potential trend reversal.
- Increased market confidence among buyers.
- Possible continuation of upward price movement.
Trading Tip
The bullish engulfing pattern becomes more reliable when it forms near major support zones or after an extended downtrend.
Example
If GBP/USD declines for several days and then forms a bullish engulfing candle at support, traders may view this as a strong buying opportunity.
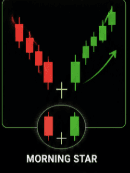
3. Morning Star Pattern
The Morning Star Pattern is a powerful three-candle bullish reversal formation.
It consists of:
- A large bearish candle.
- A small indecision candle (often a Doji).
- A strong bullish candle.
This pattern shows a gradual shift from selling pressure to buying strength.
What the Morning Star Reveals
- Sellers are losing momentum.
- Market uncertainty appears.
- Buyers begin taking control.
- A bullish reversal may be underway.
Why Traders Like the Morning Star
The three-candle structure provides more confirmation than many single-candle patterns, making it one of the most trusted bullish reversal signals.

Example
After a prolonged decline in USD/JPY, a morning star forms near a support level. The third bullish candle confirms the reversal and signals potential upward movement.
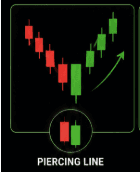
4. Piercing Line Pattern
The Piercing Line Pattern is another important bullish reversal signal.
It forms when:
- A bearish candle is followed by a bullish candle.
- The bullish candle opens lower but closes above the midpoint of the previous bearish candle.
This shows that buyers are beginning to overpower sellers.
Key Characteristics
- Appears after a downtrend.
- Signals growing buying pressure.
- Often precedes trend reversals.
Best Use
The pattern becomes stronger when supported by increased trading volume or key technical support levels.
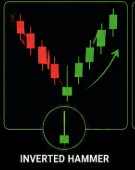
5. Inverted Hammer Pattern
The Inverted Hammer Pattern resembles an upside-down hammer with a small body and a long upper shadow.
Although it appears bearish at first glance, it often signals a potential bullish reversal after a downtrend.
What It Means
- Buyers attempted to push prices higher.
- Sellers resisted but failed to regain full control.
- Market sentiment may be shifting upward.
Confirmation Is Important
Because the pattern can sometimes fail, traders often wait for a bullish confirmation candle before entering a trade.
How to Increase the Accuracy of Bullish Candlestick Patterns
Successful traders rarely rely on candlestick patterns alone. Instead, they combine them with other technical analysis tools.
Consider confirming bullish candlestick patterns with:
- Support and resistance levels
- Moving averages
- RSI (Relative Strength Index)
- Trend lines
- Volume analysis

Using multiple forms of confirmation can significantly improve trading accuracy and reduce false signals.
Key Takeaway
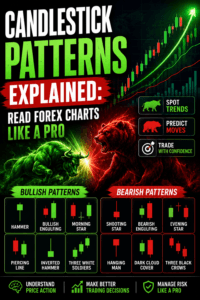
Bullish candlestick patterns help traders identify potential buying opportunities and market reversals. The Hammer Pattern, Bullish Engulfing Pattern, Morning Star Pattern, Piercing Line Pattern, and Inverted Hammer Pattern are among the most effective bullish candlestick formations for beginners.
By learning how these patterns work and combining them with sound risk management, traders can make more informed decisions and improve their overall trading performance.
Most Important Bearish Candlestick Patterns Every Beginner Should Know
While bullish candlestick patterns signal potential buying opportunities, bearish candlestick patterns warn traders that selling pressure may be increasing. These patterns often appear after an uptrend and can help traders identify possible market reversals before prices begin to decline.

Understanding bearish candlestick patterns is essential for traders who want to protect profits, avoid entering trades too late, or identify potential short-selling opportunities.
Let’s explore the most important bearish candlestick patterns every beginner should know.
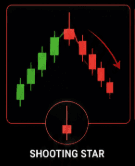
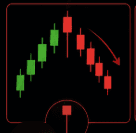
1. Shooting Star Pattern
The Shooting Star Pattern is one of the most reliable bearish reversal signals in technical analysis.
It appears after an uptrend and consists of:
- A small real body near the bottom of the candle
- A long upper shadow
- Little or no lower shadow
The long upper wick shows that buyers pushed prices higher during the session, but sellers regained control and forced prices back down before the candle closed.
What the Shooting Star Indicates
- Buyers are losing momentum.
- Sellers are entering the market.
- A potential downward reversal may be forming.
Trading Tip
Many traders wait for the next candle to close below the shooting star before confirming a bearish reversal.
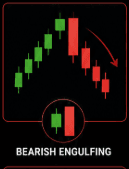
2. Bearish Engulfing Pattern
The Bearish Engulfing Pattern is the opposite of the bullish engulfing pattern.
It consists of:
- A small bullish candle.
- A larger bearish candle that completely engulfs the previous candle’s body.
This pattern signals that sellers have overwhelmed buyers and may be taking control of the market.
Why Traders Watch This Pattern
- Strong selling pressure emerges.
- Market sentiment shifts from bullish to bearish.
- Trend reversals often occur after the pattern forms.
Example
If EUR/USD has been rising steadily and suddenly forms a bearish engulfing pattern near a resistance level, traders may anticipate a price decline.
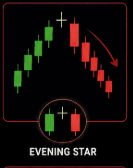
3. Evening Star Pattern
The Evening Star Pattern is a powerful three-candle bearish reversal formation.
It consists of:
- A strong bullish candle.
- A small indecision candle (often a Doji).
- A large bearish candle.
This sequence signals a gradual shift from buyer dominance to seller control.
What the Evening Star Reveals
- Uptrend momentum is weakening.
- Buyers are losing confidence.
- Sellers are beginning to take over.
- A bearish reversal may be developing.
Why It Matters
The Evening Star Pattern is considered one of the strongest bearish reversal signals because it provides confirmation over three separate trading periods.
4. Hanging Man Pattern
The Hanging Man Pattern resembles a hammer but appears after an uptrend rather than a downtrend.
The candle features:
- A small body near the top
- A long lower shadow
- Minimal upper shadow
Although buyers managed to close the candle near its opening price, the long lower wick reveals that sellers pushed prices significantly lower during the session.
What It Suggests
- Selling pressure is increasing.
- Buyers may be losing control.
- A bearish reversal could follow.
Confirmation Matters
Traders often wait for a bearish candle after the Hanging Man before entering a short trade.
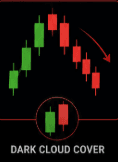
5. Dark Cloud Cover Pattern
The Dark Cloud Cover Pattern is a two-candle bearish reversal formation.
It develops when:
- A bullish candle is followed by a bearish candle.
- The bearish candle opens above the previous close.
- The bearish candle closes below the midpoint of the bullish candle.
This pattern suggests a sudden shift in momentum from buyers to sellers.
Why It’s Important
- Signals weakening bullish sentiment.
- Often appears near resistance levels.
- Can mark the beginning of a new downtrend.
How to Confirm Bearish Candlestick Patterns
Bearish candlestick patterns become more reliable when combined with other technical indicators.
Consider confirming bearish signals with:
- Resistance levels
- RSI overbought conditions
- Moving averages
- Trendline breaks
- Volume increases
Combining multiple signals can help traders avoid false reversals and improve decision-making.
Bullish vs Bearish Candlestick Patterns
Understanding both bullish and bearish patterns helps traders adapt to changing market conditions.
| Bullish Pattern | Bearish Pattern |
|---|---|
| Hammer | Shooting Star |
| Bullish Engulfing | Bearish Engulfing |
| Morning Star | Evening Star |
| Inverted Hammer | Hanging Man |
| Piercing Line | Dark Cloud Cover |
By learning to recognize both types of patterns, traders can better anticipate market movements and react more effectively to changing trends.
Key Takeaway
Bearish candlestick patterns provide valuable warning signs that an uptrend may be losing strength. The Shooting Star, Bearish Engulfing, Evening Star, Hanging Man, and Dark Cloud Cover patterns are among the most important bearish reversal formations every trader should understand.
When combined with support and resistance analysis, trend confirmation, and proper risk management, these patterns can help traders make more informed trading decisions and avoid costly mistakes.
How to Use Candlestick Patterns With Support and Resistance Levels
Learning candlestick patterns is only the first step toward becoming a successful trader. While patterns like the Hammer, Bullish Engulfing, Shooting Star, and Evening Star can provide valuable market signals, they become much more effective when combined with support and resistance levels.
Many beginner traders make the mistake of trading every candlestick pattern they see. However, professional traders look for patterns that form at key price levels because these areas often attract strong buying or selling activity.
What Are Support and Resistance Levels?
Support and resistance are important areas on a price chart where the market has historically struggled to move beyond.
Support Level
A support level is a price area where buying pressure tends to outweigh selling pressure, preventing prices from falling further.
When price approaches support:
- Buyers often enter the market.
- Selling pressure decreases.
- Bullish candlestick patterns become more significant.
Resistance Level
A resistance level is a price area where selling pressure tends to outweigh buying pressure, preventing prices from moving higher.
When price approaches resistance:
- Sellers often enter the market.
- Buying momentum weakens.
- Bearish candlestick patterns become more meaningful.
Why Support and Resistance Improve Candlestick Trading
Candlestick patterns can appear almost anywhere on a chart. However, not every pattern leads to a successful trade.
For example:
A Hammer Pattern forming randomly in the middle of a trend may have little significance.
A Hammer Pattern forming at a major support level has a much higher probability of triggering a bullish reversal.

Similarly:
A Bearish Engulfing Pattern that forms near a strong resistance zone often carries more weight than one that appears in the middle of a trend.
This is because support and resistance levels represent areas where large numbers of traders are likely to make trading decisions.
Example 1: Trading a Bullish Engulfing Pattern at Support
Imagine EUR/USD has been declining for several days and approaches a major support level.
At that support zone:
- A small bearish candle forms.
- A large bullish candle completely engulfs it.
- The market closes above support.

This combination suggests that buyers are defending the support level and may be preparing to push prices higher.
Potential Trading Plan
- Entry: Above the bullish engulfing candle.
- Stop Loss: Below support.
- Take Profit: At the next resistance level.
This approach allows traders to align candlestick signals with market structure.
Example 2: Trading a Shooting Star at Resistance
Now imagine GBP/USD has been rising steadily and reaches a major resistance area.
At resistance:
- A Shooting Star Pattern forms.
- Buyers fail to maintain higher prices.
- The next candle closes lower.

This suggests that sellers are entering the market and a reversal may be developing.
Potential Trading Plan
- Entry: Below the Shooting Star candle.
- Stop Loss: Above resistance.
- Take Profit: At the next support level.
By waiting for confirmation, traders can reduce the risk of false signals.
Combining Candlestick Patterns With Other Indicators
Support and resistance work even better when combined with other technical analysis tools.
Many traders confirm candlestick signals using:
Moving Averages
Moving averages help identify the overall trend direction.

For example:
- Bullish patterns above the 200-day moving average may have greater reliability.
- Bearish patterns below the moving average often carry more weight.
Relative Strength Index (RSI)
RSI measures whether a market is overbought or oversold.
Examples:
- A Hammer Pattern forming while RSI is oversold may strengthen a bullish setup.
- A Shooting Star forming while RSI is overbought may strengthen a bearish setup.
Trend Lines
Trend lines help traders identify key areas where reversals are likely to occur.
A candlestick pattern that forms near a trend line often attracts additional attention from traders.

Common Mistakes Beginners Should Avoid
Many traders struggle with candlestick analysis because they ignore market context.
Avoid these common mistakes:
Trading Every Pattern
Not every candlestick pattern is worth trading.
Always look for:
- Support or resistance confirmation
- Trend alignment
- Additional technical signals

Ignoring Risk Management
Even strong patterns can fail.
Always use:
- Stop-loss orders
- Proper position sizing
- Risk-to-reward ratios
Entering Too Early
Many traders enter immediately after spotting a pattern.
Waiting for confirmation from the next candle can help filter out weak signals.
Key Takeaway
Candlestick patterns become far more powerful when combined with support and resistance levels. Instead of trading patterns in isolation, successful traders look for confluence between candlestick signals, key price levels, trend direction, and technical indicators.
By combining these tools, traders can improve accuracy, reduce false signals, and make more informed trading decisions.
Frequently Asked Questions About Candlestick Patterns

What Are Candlestick Patterns?
Candlestick patterns are chart formations that help traders analyze price action and predict potential market movements. Each candlestick displays four key price points: the opening price, closing price, highest price, and lowest price during a specific time period.
By studying these formations, traders can identify trend reversals, trend continuations, and potential entry or exit opportunities.
How Do Beginners Read Candlestick Charts?
Beginners can read candlestick charts by focusing on the relationship between the opening and closing prices.
A bullish candle forms when the closing price is higher than the opening price, indicating buying pressure. A bearish candle forms when the closing price is lower than the opening price, indicating selling pressure.
The body shows the difference between the opening and closing prices, while the wicks (shadows) show the highest and lowest prices reached during the trading period.
What Is the Strongest Bullish Candlestick Pattern?
The Bullish Engulfing Pattern and Morning Star Pattern are often considered among the strongest bullish reversal signals.
These patterns indicate that buyers have taken control of the market after a period of selling pressure. However, their reliability increases significantly when they form near support levels or are confirmed by other technical indicators.
What Is the Strongest Bearish Candlestick Pattern?
Many traders consider the Bearish Engulfing Pattern and Evening Star Pattern to be among the most powerful bearish reversal formations.
These patterns signal that sellers may be taking control after an uptrend and can indicate the beginning of a downward price movement.
Are Candlestick Patterns Accurate?
Candlestick patterns can be highly effective when used correctly, but they are not 100% accurate.
Their success depends on factors such as:
Market conditions
Trend direction
Support and resistance levels
Trading volume
Risk management

Professional traders often combine candlestick patterns with indicators such as RSI, moving averages, and trend lines to improve accuracy.
Which Candlestick Pattern Is Best for Forex Trading?
There is no single “best” candlestick pattern for forex trading. However, some of the most commonly used patterns include:
Hammer Pattern
Bullish Engulfing Pattern
Morning Star Pattern
Shooting Star Pattern
Bearish Engulfing Pattern
Evening Star Pattern

The most effective pattern often depends on market context and the trader’s strategy.
Can Candlestick Patterns Be Used in Other Markets?
Yes. Candlestick patterns are widely used in:
Forex trading
Stock trading
Cryptocurrency trading
Commodity trading
Indices trading
Because candlestick analysis is based on price action and market psychology, the same principles apply across different financial markets.
Do Professional Traders Use Candlestick Patterns?
Yes. Many professional traders use candlestick patterns as part of their technical analysis process.
However, experienced traders rarely rely on candlestick patterns alone. Instead, they combine them with:
Market structure analysis
Support and resistance levels
Trend analysis
Risk management techniques
This combination helps improve the quality of trading decisions.
What Timeframe Works Best for Candlestick Patterns?
Candlestick patterns can appear on any timeframe, from one-minute charts to monthly charts.
However, many traders find that patterns on higher timeframes, such as the 4-hour, daily, and weekly charts, tend to be more reliable because they filter out market noise.
Should You Trade Every Candlestick Pattern?
No. One of the biggest mistakes beginners make is trading every candlestick pattern they see.
Instead, traders should look for:
Strong support or resistance levels
Trend confirmation
Additional technical signals
Proper risk-to-reward setups

Waiting for confirmation can help reduce false signals and improve trading performance.
Key Takeaway
Candlestick patterns are valuable tools for understanding market sentiment and identifying potential trading opportunities. While no pattern guarantees success, combining candlestick analysis with sound risk management and technical confirmation can help traders make more informed decisions and improve their overall trading results.
Mastering Candlestick Patterns for Better Trading Decisions
Candlestick patterns remain one of the most effective tools for analyzing price action and understanding market sentiment. Whether you trade forex, stocks, commodities, or cryptocurrencies, learning how to read candlestick charts can help you identify potential trend reversals, spot trading opportunities, and make more informed decisions.
Throughout this guide, we’ve explored the fundamentals of candlestick chart analysis, including candlestick anatomy, bullish candlestick patterns, bearish candlestick patterns, and the importance of combining these signals with support and resistance levels. Understanding what each candle represents allows traders to gain valuable insight into the ongoing battle between buyers and sellers.

For beginners, patterns such as the Hammer, Bullish Engulfing, and Morning Star can help identify potential buying opportunities. On the other hand, bearish formations like the Shooting Star, Bearish Engulfing, and Evening Star can alert traders to possible market reversals and selling pressure. While these forex candlestick patterns are powerful on their own, they become even more effective when used alongside technical indicators, trend analysis, and sound risk management practices.
It’s important to remember that no candlestick pattern guarantees success. Financial markets are influenced by many factors, including economic news, market sentiment, and global events. For this reason, traders should avoid relying on a single signal and instead seek confirmation through multiple forms of analysis. Combining candlestick patterns with support and resistance levels, moving averages, RSI, and trend lines can significantly improve the accuracy of trading decisions.
As you continue your trading journey, focus on practicing pattern recognition and understanding the story behind each candle. The more experience you gain reading candlestick charts, the easier it becomes to identify high-probability setups and avoid common trading mistakes.
By mastering candlestick patterns and applying them within a structured trading strategy, you can develop a deeper understanding of market behavior, improve your confidence as a trader, and make better trading decisions over the long term.
The key is consistency, patience, and continuous learning. Start by mastering a few reliable candlestick patterns, test them in different market conditions, and gradually build a trading approach that suits your goals and risk tolerance.
Keep Exploring
| Anchor Text / Topic | Suggested Post (click to read) | Category |
|---|---|---|
| The Hammer Pattern (bullish reversal) | How to Trade Hammer Candlestick Pattern | Candlestick |
| Forex Markets & Whipsaw (trader behavior) | Forex Markets Whipsaw on US-Iran Deal News | Market |
| Risk Management (scalping) | Top 8 Risk Management Practices in Forex Scalping | Risk |
| Long Wick & Price Action (buyers vs. sellers) | Gold Price Action: Three-Week Bear Run | Price Action |
| Market Sentiment Shifts (bullish → bearish) | Bitcoin Rebounds Past 92K as Sentiment Shifts | Sentiment |
| Advanced Strategies (candlestick basics) | 7 Best Advanced Strategies in Forex Trading | Strategy |
| Candlestick vs. Line Chart (chart types) | Mastering Forex Line Trading for Analysis | Charting |
| Anticipating Trends (economic data) | Markets Predictions Ahead of UK CPI Data | Economic |