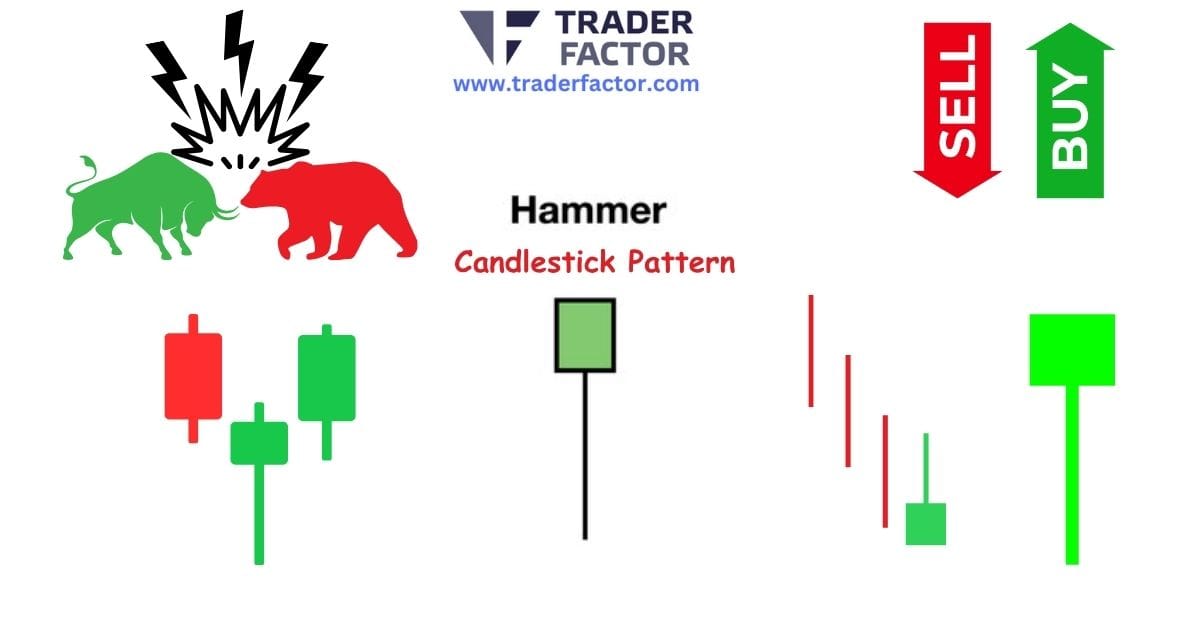

The hammer Candlestick Pattern is a powerful tool you can use to spot potential trend reversals in the market. Understanding this single-candle formation is crucial. It often appears after a price decline. This suggests that sellers are losing ground. Buyers, in contrast, are starting to gain control.
For forex traders, recognizing and interpreting the hammer candlestick meaning in Forex is a vital skill. This guide will walk you through everything you need to know. We will cover its structure, significance, and how to trade it effectively. By the end, you will have a solid grasp of how to use the hammer Candlestick Pattern in your trading strategy.
Understanding the Anatomy of the hammer Candlestick Pattern
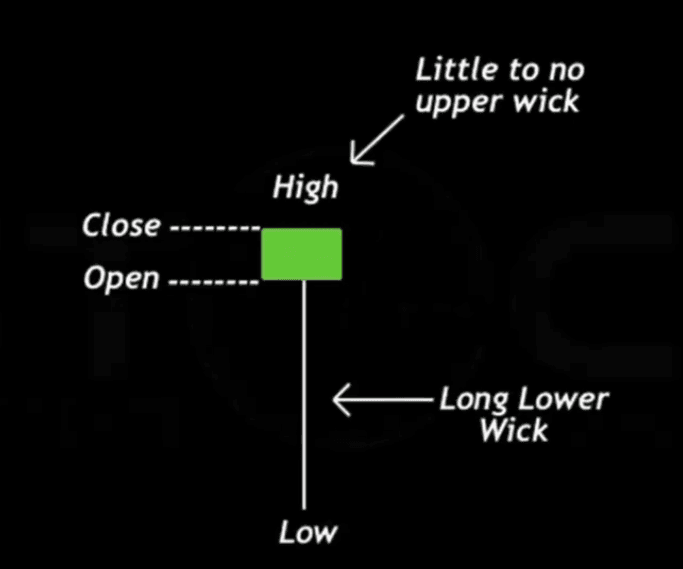
To effectively trade financial markets, you must understand the visual cues that chart patterns provide. Candlestick patterns, like the hammer, offer deep insights into market psychology. This specific pattern is a bullish reversal signal. It typically forms at the end of a downtrend. Its distinct shape makes it easy to spot. It has a small body at the top. A long lower shadow extends below it. This shadow should be at least twice the length of the body. There is very little or no upper shadow. This structure shows that sellers pushed the price down significantly during the period. However, strong buying pressure emerged. This pushed the price back up to close near its opening level, which is a key characteristic of the hammer Candlestick Pattern.
The Small Body of the hammer Candlestick Pattern
The small real body of the hammer Candlestick Pattern is a critical component that communicates a story of market indecision followed by a shift in power.
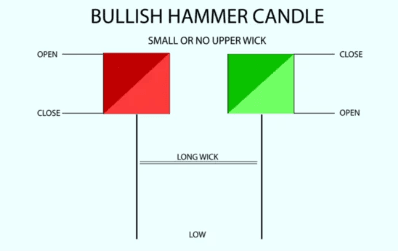
The small body shows that the opening and closing prices for the period were very close to each other. This proximity signifies a standoff between buyers and sellers. Initially, the bears were in control, pushing prices lower. But the bulls fought back fiercely. This battle is what contains the price action within a narrow range for the body. Whether the body is green (close above open) or red (close below open), the small size itself is what matters most when identifying the hammer Candlestick Pattern.
The Long Lower Shadow of the hammer Candlestick Pattern
The long lower shadow, or wick, is arguably the most defining feature of the hammer Candlestick Pattern. It visually represents the sellers’ failed attempt to drive prices down further. During the trading session, bearish momentum was strong enough to create a new low. However, this low was not sustained. Buyers entered the market with force, rejecting the lower prices and pushing the asset’s value back up. This rejection is what forms the long tail. A longer shadow indicates a more significant rejection and, therefore, a more potent bullish signal from the hammer Candlestick Pattern.
Interpreting the Psychology Behind the hammer Candlestick Pattern
The formation of a hammer Candlestick Pattern on a chart tells a compelling story about the battle between buyers and sellers. It signifies a potential capitulation of sellers and the beginning of a strong buying presence. When this pattern appears after a sustained downtrend, it suggests that the bearish sentiment might be exhausted. The market tested lower prices but found strong support, leading to a recovery by the end of the period. This psychological shift is what traders look for as an early sign of a trend reversal. Understanding this dynamic is key to successfully trading the hammer Candlestick Pattern.

Sellers’ Exhaustion in the hammer Candlestick Pattern
The downtrend preceding a hammer Candlestick Pattern is marked by consistent selling pressure. Each candle may close lower than the last, reinforcing a bearish outlook. The appearance of the long lower wick on the hammer signals a critical turning point. It shows that while sellers initially dominated the session and pushed the price to a new low, they could not maintain this momentum. This failure to hold the lows suggests that the selling power is waning. You could interpret this as sellers taking profits or a lack of new sellers entering the market, a key insight provided by the hammer Candlestick Pattern.

Buyers’ Assertion in the hammer Candlestick Pattern
The recovery from the session’s low to a close near the open is a clear sign of buyers asserting their control, which is the core of the hammer Candlestick Pattern. This buying pressure is strong enough to erase most or all of the intraday losses. It indicates that demand is stepping in at these lower price levels. For traders, this is a strong hint that the sentiment is shifting from bearish to bullish. The ability of the bulls to engineer such a significant comeback within a single trading period is a powerful statement and a primary reason why the hammer Candlestick Pattern is considered a reliable reversal signal.
How to Identify a Valid hammer Candlestick Pattern
While the classic hammer is a powerful signal, it is important to be aware of its variations and other similar candlestick patterns.
Not every candle with a small body and a long lower wick is a valid hammer. Correct identification is crucial to avoid false signals. You need to look for a specific context. A true hammer Candlestick Pattern appears after a clear and established downtrend. The preceding price action should consist of several bearish candles. The pattern’s reliability is enhanced when it forms near a significant support level, such as a previous price low, a trendline, or a key moving average. Volume can also act as a confirmation; an increase in trading volume on the day the hammer forms strengthens the signal, validating the hammer Candlestick Pattern.
Context is Key for the hammer Candlestick Pattern
The location of a hammer Candlestick Pattern on a chart is paramount. If it appears in a sideways or ranging market, it holds little to no significance. Its power as a reversal signal is derived from its appearance at the bottom of a downtrend. It marks a potential end to the bearish move. Therefore, you must first analyze the overall market trend. Is the price making lower lows and lower highs? If so, the appearance of a hammer could be a meaningful event. Ignoring the market context is a common mistake that can lead to misinterpreting the hammer Candlestick Pattern.

Confirmation of the hammer Candlestick Pattern
A single hammer Candlestick Pattern is a warning, not a definitive signal. Prudent traders always wait for confirmation before acting. Confirmation typically comes from the next candle. This subsequent candle should open and close above the close of the hammer. A strong bullish candle following the hammer provides greater assurance that the reversal is underway. This confirmation helps filter out fakeouts, where the price might briefly pause before continuing its downward trend. This hammer pattern entry strategy, waiting for confirmation, improves the probability of a successful trade when using the hammer Candlestick Pattern.
Types of hammer Candlestick Patterns and Similar Formations
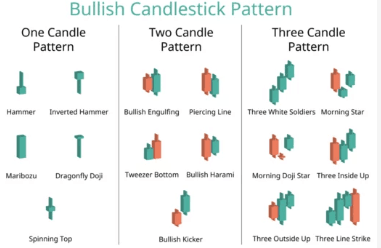
These include the Inverted hammer candlestick and the Hanging Man candlestick. Each has a similar shape but appears in a different context, which changes its meaning. Recognizing these different types of hammer candlestick and related patterns like the shooting star candlestick will give you a more nuanced understanding of price action. For instance, the bullish hammer candlestick pattern is a bottom reversal, while its lookalike, the Hanging Man, is a top reversal pattern.
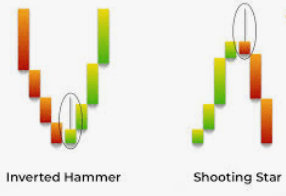
The Inverted hammer Candlestick Pattern
The inverted hammer has a small body at the bottom and a long upper shadow, with little to no lower shadow. This pattern suggests that buyers tried to push the price up during the session but were met with selling pressure. Despite the sellers pushing the price back down, the initial buying enthusiasm is a bullish sign. Like the standard hammer, the inverted hammer Candlestick Pattern requires a bullish confirmation candle to follow.
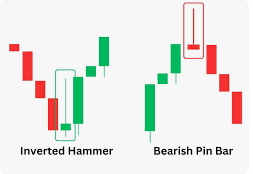
The Inverted hammer candlestick also appears at the bottom of a downtrend and signals a potential bullish reversal. However, its appearance is the opposite of a classic hammer.
The Hanging Man and Shooting Star Candlestick Pattern
The Hanging Man candlestick looks identical to a hammer but forms at the top of an uptrend, signaling a potential bearish reversal. Likewise, the shooting star candlestick pattern looks like an inverted hammer but also appears after an uptrend, indicating a potential top. This is a crucial distinction. A hammer shape after a fall is bullish; the same shape after a rise is bearish. This bearish hammer candlestick warns that buying momentum is fading.
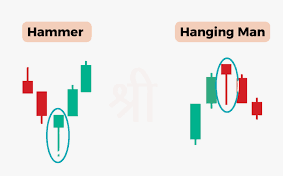
Misidentifying a Hanging Man as a hammer Candlestick Pattern can lead to a costly trading error.
Trading Strategies for the hammer Candlestick Pattern
Once you have identified a valid hammer Candlestick Pattern and received confirmation, the next step is to formulate a trading plan. This involves defining your entry point, setting a stop-loss order, and establishing a profit target. A disciplined approach is essential for managing risk and maximizing potential returns. Your strategy should be clear and systematic. There is no single hammer candlestick pattern formula for success, but a structured plan will always outperform impulsive decisions. A common strategy involves entering a long position after the confirmation candle closes.
Entry and Stop-Loss for the hammer Candlestick Pattern
A common hammer pattern entry strategy is to place a buy order after the confirmation candle closes above the high of the hammer. More aggressive traders might enter near the close of the hammer itself, but this carries more risk. Your stop-loss order should be placed just below the low of the hammer’s shadow. This level represents the point where the reversal signal is invalidated. If the price breaks below this low, it means the buyers have failed to maintain control, and the downtrend is likely to resume. Proper stop-loss placement is critical when trading the hammer Candlestick Pattern.

Profit Targets for the hammer Candlestick Pattern
Determining your profit target when trading a hammer Candlestick Pattern requires you to look at the chart’s structure. You should identify the next significant resistance level. This could be a previous swing high, a major moving average, or a Fibonacci retracement level. Aiming for a risk-reward ratio of at least 1:2 is a good practice. For example, if your stop-loss is 50 pips away from your entry, your profit target should be at least 100 pips away. This ensures that your potential profits are significantly larger than your potential losses on any given trade involving a hammer Candlestick Pattern.
Combining the hammer Candlestick Pattern with Other Indicators
The hammer Candlestick Pattern is most effective when used in conjunction with other technical analysis tools. Relying on a single pattern can be risky. Combining it with indicators like the Relative Strength Index (RSI), moving averages, or support and resistance levels can provide a stronger, more reliable signal. This concept, known as confluence, is when multiple indicators point to the same conclusion. Confluence increases your confidence in a trade setup and can improve the overall success rate of your strategy that uses the hammer Candlestick Pattern.

Using RSI with the hammer Candlestick Pattern
The Relative Strength Index (RSI) is a momentum oscillator that can help you identify overbought or oversold conditions. A hammer Candlestick Pattern that forms when the RSI is in oversold territory (typically below 30) is a much stronger bullish signal. This combination suggests that not only is the price at a potential reversal point according to the candlestick, but the momentum is also heavily skewed to the downside and is due for a correction. A bullish divergence, where the price makes a new low but the RSI makes a higher low, further strengthens the signal from the hammer Candlestick Pattern.

Support and Resistance with the hammer Candlestick Pattern
Support and resistance levels are fundamental to technical analysis. A hammer Candlestick Pattern that forms at or near a major support level is a high-probability trading setup. This support level could be a horizontal price zone where the market has reversed in the past, a dynamic trendline, or a significant moving average like the 200-period MA. When the price action of a hammer Candlestick Pattern respects a known support zone, it confirms that buyers are actively defending that level, adding significant weight to the potential bullish reversal.
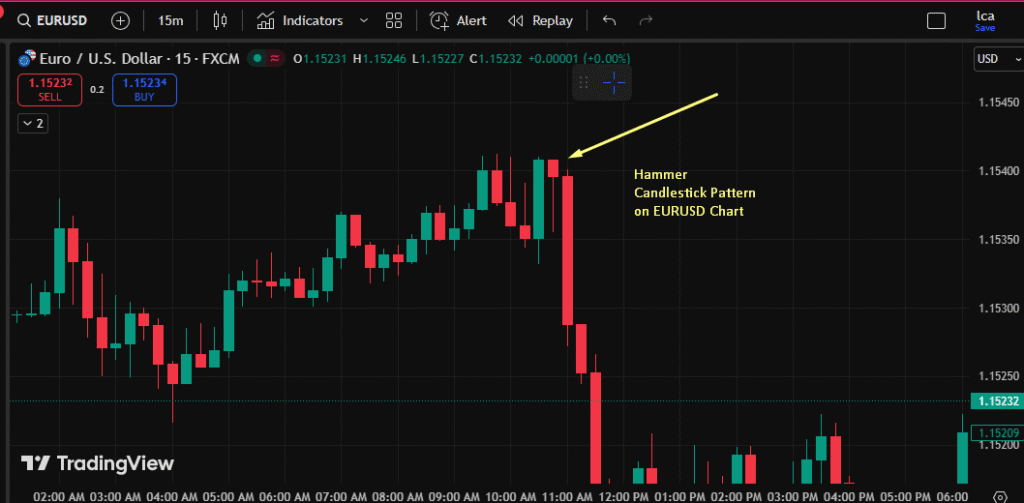
Real World hammer Candlestick Pattern Example
Let’s look at a hammer candlestick pattern example on a hammer candlestick chart. Imagine the EUR/USD currency pair has been in a steady uptrend for several days. The price then forms a candle with a small body and a long lower shadow that is three times the length of the body. This is a classic hammer Candlestick Pattern. The next day, a strong bearish candle forms, closing well above the high of the hammer. This confirmation provides a clear signal to enter a long trade, placing a stop-loss just above the hammer’s high. The price then begins a new downtrend.
Analysis of a Successful hammer Candlestick Pattern Trade
In a successful trade, after you enter on the confirmation candle, the price would begin to move upwards. The uptrend might be gradual at first but should gain momentum. You would watch the price approach your pre-determined resistance level. As it nears this target, you could decide to close your full position or take partial profits and move your stop-loss to break-even to protect your gains. This scenario demonstrates the ideal outcome when correctly identifying and trading a hammer Candlestick Pattern, confirming the hammer candlestick pattern meaning as a powerful reversal indicator.

Learning from a Failed hammer Candlestick Pattern
Not every hammer Candlestick Pattern will result in a reversal. Sometimes, the pattern can fail. Imagine entering a trade based on a hammer, only for the price to reverse and break below your stop-loss. This is a failed signal. In this case, it is crucial to accept the small, managed loss and exit the trade. Analyzing what went wrong is important. Perhaps the downtrend was too strong, or there was no confirmation from other indicators. Learning from these failed instances is just as important as celebrating the successful trades involving a hammer Candlestick Pattern.
The Morning Star and hammer Candlestick Pattern Connection
The Morning Star pattern is a three-candle bullish reversal pattern that often incorporates a hammer or a similar indecisive candle. This powerful formation provides an even stronger reversal signal than a hammer alone. The pattern starts with a long bearish candle, followed by a small-bodied candle (like a hammer, spinning top, or doji) that gaps down, and is completed by a long bullish candle.
The combination of a Morning star and hammer candlestick pattern presents a very compelling case for a market bottom, reinforcing the bullish sentiment suggested by the hammer Candlestick Pattern.
Structure of the Morning Star Pattern
The first candle in the Morning star candlestick pattern is a large bearish candle, continuing the downtrend. The second candle is a small-bodied candle that indicates indecision; this is where a hammer Candlestick Pattern can fit perfectly. This middle candle shows that the bears are no longer in full control. The third candle is a strong bullish candle that closes at least halfway into the body of the first bearish candle. This sequence shows a clear and decisive shift from bearish to bullish power, a more elaborate story than a single hammer Candlestick Pattern.

Trading the Morning Star and hammer Candlestick Pattern
Trading the Morning star pattern is similar to trading a standalone hammer Candlestick Pattern, but with more confidence. Your entry would be after the third bullish candle closes, confirming the reversal. The stop-loss is placed below the low of the middle candle (the hammer). Because the Morning Star is a more robust pattern, traders might use wider profit targets, looking for a more significant trend reversal. The hammer Candlestick Pattern within this larger formation acts as the initial, crucial signal that the market momentum is about to change.
Advanced Considerations for the hammer Candlestick Pattern
To become proficient in using the hammer Candlestick Pattern, you should consider more advanced concepts. This includes analyzing the pattern across different timeframes and understanding its limitations. A hammer on a weekly chart, for example, is far more significant than one on a 5-minute chart. It is also important not to rely solely on this pattern. It should be one of many tools in your analytical toolbox. Developing a nuanced view of the hammer Candlestick Pattern will improve its practical application in your trading. You can often find a hammer candlestick pattern pdf online for further study.

Timeframe Analysis of the hammer Candlestick Pattern
The significance of a hammer Candlestick Pattern is directly related to the timeframe on which it appears. A hammer on a daily or weekly chart represents a battle over a longer period and indicates a more substantial potential shift in the primary trend. On shorter timeframes, such as hourly or 15-minute charts, hammers can signal smaller corrections or the end of minor pullbacks within a larger trend. Therefore, always consider the context of the higher timeframe trend when interpreting a hammer Candlestick Pattern on a lower timeframe.

Limitations of the hammer Candlestick Pattern
While powerful, the hammer Candlestick Pattern is not infallible. It can produce false signals, especially in choppy or low-volume markets. There is no guarantee of a reversal. The pattern also does not provide a price target, so you must use other methods to determine your exit point. Over-reliance on any single indicator, including candlestick patterns, is a recipe for failure. Always use the hammer Candlestick Pattern as part of a comprehensive trading plan that includes robust risk management and confirmation from other forms of analysis.
Common Mistakes When Trading the hammer Candlestick Pattern
Many traders, especially beginners, make common mistakes when trying to trade the hammer Candlestick Pattern. One of the biggest is acting on the pattern without waiting for confirmation. This leads to entering trades too early and getting stopped out. Another error is ignoring the overall market context, such as trading a hammer that appears in a strong, momentum-fueled downtrend. Recognizing these pitfalls and actively avoiding them is crucial for consistent success. A deep understanding of all candlestick patterns is essential to avoid these errors.

Trading Without Confirmation of the hammer Candlestick Pattern
Jumping into a trade as soon as a hammer Candlestick Pattern forms is a frequent mistake driven by the fear of missing out. This is a high-risk approach. The hammer itself is just a sign of potential change; it is not a guarantee. Without a confirmation candle, you have no proof that buyers have actually taken control. Patience is a virtue in trading. Waiting for that next bullish candle to validate the signal from the hammer Candlestick Pattern significantly increases the probability of a successful trade and helps filter out market noise.

Ignoring Volume with the hammer Candlestick Pattern
Volume is a critical piece of the puzzle that many traders overlook. A hammer Candlestick Pattern that forms on low volume is not a strong signal. It suggests that the reversal was not backed by significant market participation. Conversely, a hammer that appears with a spike in volume is much more credible. It shows that the battle between buyers and sellers was intense and the subsequent victory by the bulls was decisive. Always check the volume indicator when you spot a potential hammer Candlestick Pattern to gauge its true strength.
Frequently Asked Questions

Is a hammer bullish or bearish?
A hammer candlestick is a bullish reversal pattern. It signals a potential end to a downtrend and the beginning of an uptrend. Its appearance suggests buyers are overpowering sellers.
Can a red hammer be bullish?
Yes, a red hammer can still be bullish. The most important feature is the long lower shadow, which shows a rejection of lower prices. A green hammer is considered slightly more bullish, but both signal a potential reversal.
Is a hammer good for day trading?
Yes, the hammer pattern can be effective for day trading, especially on 5-minute or 15-minute charts. However, signals on lower timeframes can be less reliable. Day traders should always seek quick confirmation.

How to trade hammer candlestick?
Identify a hammer after a downtrend. Wait for a confirmation candle to close above the hammer’s high, then enter a buy trade. Place a stop-loss below the hammer’s low.
What timeframe is best for hammer?
Higher timeframes, such as daily or weekly charts, provide more reliable hammer signals. These patterns indicate more significant shifts in market sentiment. Lower timeframes can be used but may have more false signals.
Which candle is best for bullish?
Besides the hammer, the Bullish Engulfing pattern and the Morning Star pattern are very strong bullish signals. A Bullish Marubozu, a long green candle with no shadows, also indicates strong buying pressure.

Does it matter if a hammer is red or green?
The color matters slightly, but it is not the most critical factor. A green hammer is stronger because it shows the close was higher than the open. However, a red hammer is still a valid bullish signal.
How to read hammer?
Read a hammer as a story of rejection. The price opened, sellers pushed it way down (long lower shadow), but buyers stepped in and pushed it all the way back up to close near the open (small body).
What is the 3 candle rule?
The “three-candle rule” often refers to waiting for three consecutive candles to confirm a new trend direction. In the context of a hammer, some traders wait for the confirmation candle and then another bullish candle to confirm the reversal.

What timeframe is best for hammer patterns?
The best timeframe depends on your trading style. Swing traders prefer daily or weekly charts for strong signals. Day traders can use hourly or 15-minute charts but must manage risk carefully due to increased noise.
What is the hammer indicator on Tradingview?
TradingView has a built-in “Hammer” pattern recognition indicator. It automatically scans the chart and highlights any candles that meet the technical criteria of a hammer pattern. This can help you spot potential setups more easily.
Conclusion
In summary, the hammer Candlestick Pattern is a valuable and easily recognizable signal for forex traders. It indicates a potential bullish reversal after a downtrend, signifying that buying pressure is overcoming selling pressure. However, it should never be used in isolation. The most effective strategies involve waiting for confirmation from the subsequent candle and combining the signal with other technical indicators like RSI and support levels. By understanding its psychology, practicing proper identification, and adhering to a disciplined trading plan with clear entry, stop-loss, and profit targets, you can effectively integrate the hammer Candlestick Pattern into your arsenal and improve your ability to spot market turning points.
Disclaimer:
All information has been prepared by TraderFactor or partners. The information does not contain a record of TraderFactor or partner’s prices or an offer of or solicitation for a transaction in any financial instrument. No representation or warranty is given as to the accuracy or completeness of this information. Any material provided does not have regard to the specific investment objective and financial situation of any person who may read it. Past performance is not a reliable indicator of future performance.