
Stop guessing support and resistance. Learn what POI means in Forex, how to spot liquidity sweeps, and why institutional order flow changes everything.
What Does POI Mean in Forex? The Ultimate Trader’s Guide
If you’ve ever watched a perfect support level crumble moments after you bought in, you’ve likely been the victim of liquidity engineering. In the world of institutional trading, lines on a chart don’t move markets—money does.
This guide strips away the jargon to explain Point of Interest (POI). We aren’t just talking about definitions; we’re looking at how smart money moves, why your stop-loss gets hunted, and how to position yourself alongside the institutions rather than against them.
Key Takeaways:
The Strategy: We don’t guess; we wait for the “trap” to spring before entering.
Definition: A POI is a specific zone where institutional money has entered the market.
The Difference: Unlike standard support/resistance, a POI requires a liquidity sweep to be valid.
What is a Point of Interest (POI) in Trading?
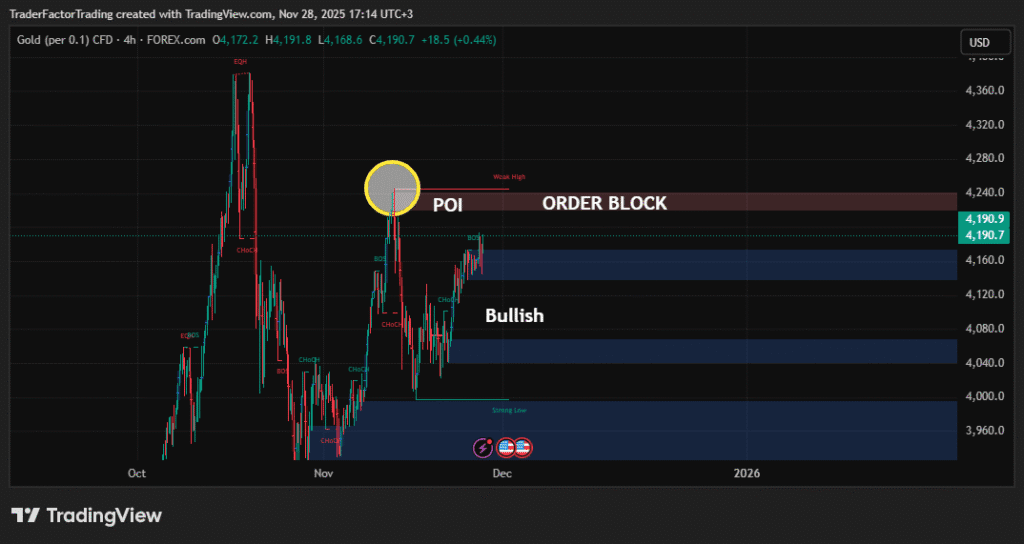
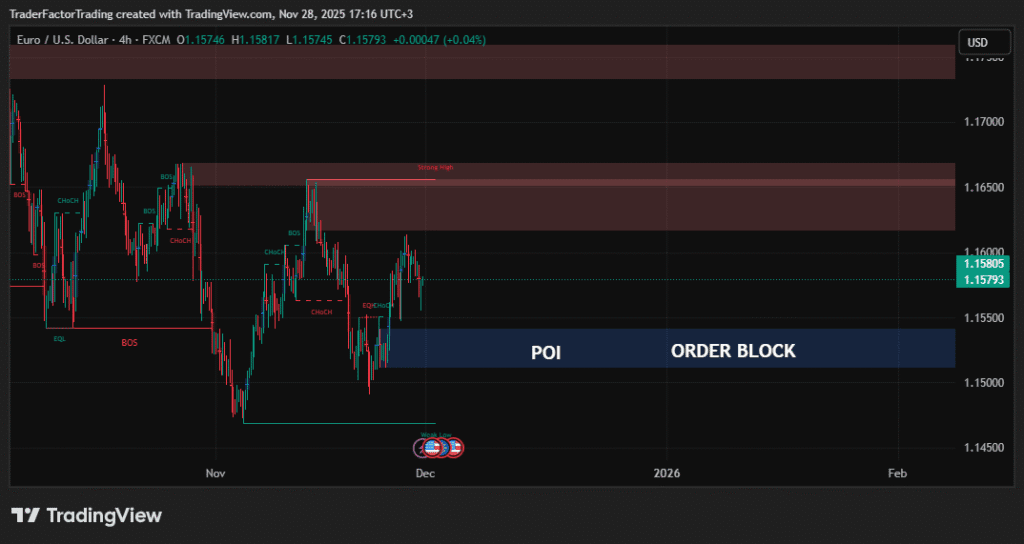
A Point of Interest (POI) is a specific price zone on a chart where a significant institutional reaction occurred, making a future reaction highly probable. It’s the footprint left behind after large players have manipulated the market to fill their orders.
Think of it this way: if a hedge fund needs to buy one billion EUR/USD, it can’t just click “buy.” An order that large would cause the price to skyrocket, resulting in a terrible average entry price. Instead, they need to find a massive pool of sellers to absorb their buy order.
And where are the most concentrated pools of sell orders? Just below obvious support levels, where retail traders place their stop losses.
A POI marks the exact zone where this manipulation—the liquidity sweep—took place.
The “Smart Money” Checklist
For a zone to be considered a high-probability POI, it should exhibit these three characteristics:
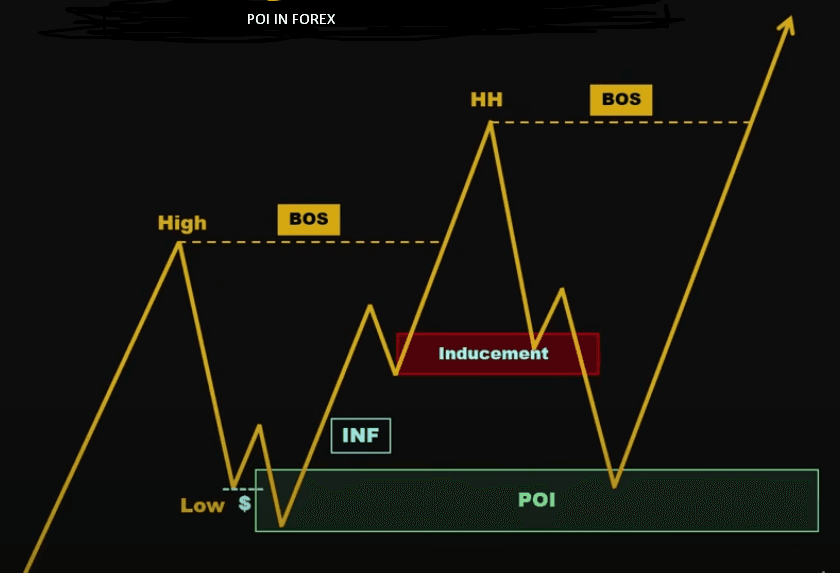
A Break of Structure (BOS): The aggressive move away from the POI should decisively break a key market structure point, confirming the new direction has momentum.
A Liquidity Sweep: The price must first move above a previous swing high or below a previous swing low, clearing out stop orders.
An Imbalance (or FVG): After the sweep, the price moves away with such speed and force that it leaves behind large, inefficient candles, known as an imbalance or Fair Value Gap (FVG).
The Critical Role of Liquidity Sweeps
This is the most critical concept for modern Forex trading. The market cannot move without liquidity (orders).
Real-World Example:
Imagine the EUR/USD is trending up. Everyone sees a clear “double bottom” support level at 1.0500. Retail traders place their buy limit orders there, and more importantly, they place their Sell Stop (stop-loss) orders just below 1.0500.
Institutions need to buy millions of Euros. To do that, they need sellers. Where are the sellers? They are your stop losses below 1.0500.
- The Trap: Price drops to 1.0500, bouncing slightly to lure in early buyers.
- The Sweep: Suddenly, a single candle smashes down to 1.0490. Stop losses trigger (becoming sell orders).
- The Entry: Institutions gobble up those sell orders to fill their buy positions.
- The Reversal: Price aggressively reverses and shoots up to 1.0600.
The POI is that specific candle at 1.0490 that swept the lows.
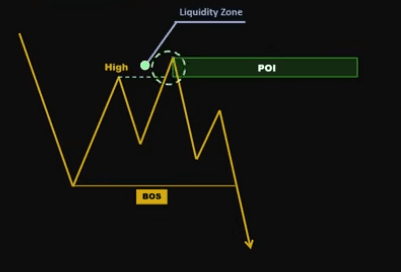
Identifying High-Probability POI Zones
Identifying a valid POI requires a keen eye for specific market behavior. The process involves looking for key characteristics that signal institutional activity.
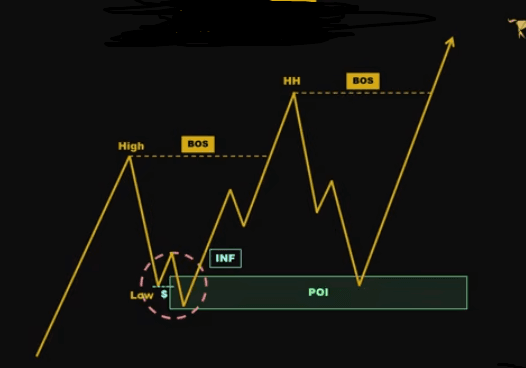
Bullish POI Scenario
A bullish POI forms after the market has swept liquidity below a previous low. This indicates that sell-stop orders have been triggered, and large buyers have stepped in.
Here’s how to identify it:
- Look for a previous swing low in the market structure.
- Observe as the price moves below this low.
- The key is to find a single candle (the “last selling candle”) whose wick or body sweeps the liquidity below that low.
- Crucially, the price should immediately reverse and close back above the low within the same or next candle. The follow-up candle should not close lower than the sweep candle.
- This zone, created by the sweeping candle, becomes your high-probability bullish POI. Traders will watch for the price to return to this area to look for a long entry.
Bearish POI Scenario
A bearish POI is the mirror opposite. It forms after the market sweeps liquidity above a previous high, triggering buy-stop orders and allowing large sellers to enter the market.
Here’s how to identify it:
- Identify a previous swing high in the market structure.
- Watch for the price to move above this high.
- A single candle (the “last buying candle”) will sweep the liquidity with its wick or body.
- The price then immediately reverses and closes back below the high. The next candle should not close higher than the sweep candle.
- This area is now a high-probability bearish POI. Traders anticipate the price returning to this zone to seek a short entry.
Scenario: A Bearish POI on GBP/USD
- The Setup: The GBP/USD hourly chart shows a clear swing high at 1.2550. Many breakout traders have placed Buy Stop orders just above this level, while swing traders who shorted earlier have their stop-loss orders there. This creates a rich pool of buy-side liquidity.
- The Inducement: The price rallies towards 1.2550 but stalls just below it, maybe even forming a small double top. This tempts more sellers to enter the market, adding even more stop-loss orders above the high.
- The Sweep: A single H1 candle suddenly spikes to 1.2565. This move triggers all the Buy Stop orders from both breakout traders and the stop losses from early sellers.
- The Institutional Entry: As these buy orders flood the market, institutional players with massive sell orders waiting in their systems can now fill their positions without causing the price to crash prematurely. They are selling to the breakout buyers.
- The Reversal: Once the institutional sell orders are filled, the buying pressure evaporates. The price aggressively reverses, leaving behind the trapped breakout traders and creating a powerful down move.
The true bearish Point of Interest is the wick or body of that H1 candle that swept the 1.2550 high. This is not just a resistance level; it’s a validated zone of institutional selling.
POI Trading vs. Order Block Trading
Many traders use these terms interchangeably, but there is a distinct difference in quality.
An Order Block is just a candle; a POI is a verified zone of interest. A high-probability POI is a qualified order block. The liquidity sweep is the qualifier.
| Feature | Standard Order Block | High-Probability POI |
|---|---|---|
| Trigger Event | Just the last candle before a move. | Must sweep liquidity (take out a High/Low). |
| Market Context | Can happen anywhere. | Happens at key structural points. |
| Reliability | Low (often acts as bait/inducement). | High (institutional orders are present). |
| Trader Action | Often blindly sets limits. | Waits for confirmation inside the zone. |
| Failure Rate | High (often gets run over). | Lower (backed by smart money). |
Inducement is a market trap designed to lure traders into premature positions. For example, after a bullish break of structure, an obvious order block near the breakout point often serves as inducement. Retail traders will place buy orders there, creating a pool of sell-stop liquidity just below it. The market will often sweep this liquidity before moving to the true POI, which is typically located at a more extreme price level where a prior liquidity sweep occurred.

A true POI has already proven its strength by engineering a liquidity sweep. An ordinary order block, without this validation, is just a potential level that can easily fail. By focusing only on POIs that have swept liquidity, you filter out low-probability setups and avoid common market traps.
Actionable Tips for Effective POI Trading
How do you actually trade this? Stop trying to catch falling knives. Use this three-step confirmation process.
Step 1: The Higher Timeframe POI (H4 or Daily)
- Identify a previous swing High or Low that has been swept.
- Mark the candle responsible for the sweep. This is your H4 POI.
- Action: Set an alert. Do not trade yet.
Step 2: The Approach
- Wait for price to return to your H4 POI.
- Watch for “Inducement.” Price often creates a fake support level just before the POI to trap early traders.
- Action: Wait for the fake support to break.
Step 3: The Lower Timeframe Entry (M15 or M5)
- Once price taps into the H4 POI, drop to the 15-minute chart.
- Look for a Change of Character (ChoCH). This means the short-term trend has shifted to align with your H4 direction.
- Action: Enter on the retest of the M15 internal POI.

Distinguish Between Inducement and Valid POIs: Be skeptical of the most obvious levels. The first order block after a breakout is often an inducement trap. Look for the POI at the extreme of a move or a zone that has clearly taken out a previous swing point.
Wait for the Single-Candle Sweep: The strongest POIs are formed by a decisive, single-candle sweep and an immediate reversal. If the price lingers above or below the liquidity level for several candles, the zone is weaker.

Backtest Your Strategy: Before risking real capital, backtest the concept of POI trading at least 100 times. This will help you build confidence and train your eyes to spot these high-probability zones in real-time market conditions.
Importance of POI in Forex
Understanding the importance of Poi in Forex will help you make informed trading decisions based on key price levels. Market psychology plays a crucial role in determining these levels. Traders often gather around these points, creating clusters of orders that can influence price movements. Recognizing these points can give you an edge in your trading strategy. Additionally, it can serve as a significant level for implementing risk management techniques. You can effectively manage your risk exposure by setting stop-loss orders or profit targets near these levels. This strategic approach helps you protect your capital and optimize your trading performance.
Identifying Poi on Price Charts
To identify points of interest on price charts, you need to look for clusters of orders that indicate significant price levels. These clusters often signify areas where many traders have placed orders, making them crucial to watch.
When identifying trends, consider where these clusters form, as they can act as key support or resistance levels. You can gain valuable insights into potential market movements by analysing price action around these. Understanding the significance of price charts is essential for making well-informed trading decisions based on the behaviour of other market participants. Keep a keen eye on these areas to navigate the market more effectively.
Utilizing Poi in Trading Strategies
To implement successful trading strategies, incorporate its analysis into your decision-making process for improved market navigation. Its strategies utilize key trading indicators to identify potential entry and exit points in the market.

By analyzing Points of Interest on price charts, traders can gain valuable insights into market trends and potential price reversals. Integrating analysis into your trading strategies can help you make more informed decisions and increase the effectiveness of your trades.

These trading indicators serve as important tools in understanding market dynamics and predicting future price movements.
Support and Resistance Levels for Point of Interest
Incorporating its analysis into your trading strategy allows for comparing support and resistance levels, enhancing your ability to interpret market signals effectively. While support and resistance levels are based on historical price movements, Technical analysis identifies significant price levels based on clustering.
Unlike trendlines that connect swing lows or highs, it focuses on areas where the price has repeatedly reacted, indicating potential interest levels to traders. By understanding the differences between it and traditional support and resistance levels, you gain a more nuanced view of the market dynamics.

This comparative analysis can help you make more informed trading decisions by providing additional insights into the underlying market sentiment and potential price reversal points.
Tips for Using Points Effectively
To effectively use forex trading, familiarize yourself with common patterns and key price levels signifying potential trading opportunities. When using it effectively, it’s crucial to avoid common mistakes that can hinder your trading success.

One common error is relying solely on it without considering other technical indicators or fundamental analysis. It should complement your overall trading strategy rather than be the sole decision-making tool. Additionally, be cautious of overtrading based on signals alone, as it’s essential to maintain a disciplined approach to risk management.
Frequently Asked Questions
Can POI be used in conjunction with other technical indicators to improve trading strategies?
Yes, POI can be effectively used alongside other technical indicators to enhance trading strategies. By combining POI with tools like moving averages, RSI, or MACD, traders can confirm signals and improve the accuracy of their trades. This integration helps in developing a robust POI trading strategy that accounts for various market conditions.
How do traders determine the strength of a POI level compared to support and resistance levels?
Traders assess the strength of a POI level by analyzing its historical significance, trading volume, and frequency of price interaction. Unlike traditional support and resistance levels, a POI often incorporates additional factors such as market sentiment and order flow, offering a nuanced perspective on potential price movements.
Are there specific currency pairs or timeframes where it is more effective?
POI can be applied to various currency pairs and timeframes, but its effectiveness may vary. Traders often find it more beneficial in major currency pairs and during timeframes that align with their trading style—be it intraday, swing, or long-term trading. The adaptability of POI across different scenarios is a key advantage.
Can POI levels be used for both short-term and long-term trading strategies?
Absolutely, POI levels are versatile and can be tailored for both short-term and long-term trading strategies. Short-term traders may use POI to identify entry and exit points within a day, while long-term traders can leverage these levels to forecast broader market trends and significant price shifts.

Is there a specific way to adjust levels for volatile market conditions?
In volatile markets, traders can adjust POI levels by increasing their buffer zones or using dynamic indicators that account for rapid price changes. This flexibility allows traders to maintain the relevance of POI even under heightened market uncertainty, ensuring more stable trading decisions.
What does POI stand for in trading?
In trading, POI stands for Point of Interest. It refers to specific price levels or zones that are expected to influence market behavior due to historical data, psychological factors, or other trading dynamics.
What is a POI in forex?
In forex, a POI is a critical price point that traders monitor for potential market reactions. It signifies an area where price action could reverse, continue, or experience increased volatility, making it a focal point for forex trading decisions.
What does POI mean in money?
POI in the context of money refers to focal price areas that hold significance for traders, potentially affecting their financial decisions and strategies based on anticipated market movements.
What is POI in charts?
POI in charts denotes specific levels marked for their anticipated impact on price action. These points may correlate with historical highs or lows, trendlines, or other technical markers that suggest a potential change in market direction.
How to find POI in trading?
To find POI in trading, analyze historical price data to identify recurring levels where significant price movement occurred. Utilize technical analysis tools such as Fibonacci retracement and pivot points to pinpoint these areas effectively.
How to identify POI?
Identify POI by observing price patterns, volume spikes, and historical support/resistance levels. Traders can also refer to Point of Interest forex PDFs and resources that detail various types of POI in forex trading for further guidance.
How do I check my POI?
Checking your POI involves continuously monitoring identified levels for price action. Use charting software to set alerts and ensure that these points are actively influencing market behavior as expected.

What is the POI rule?
The POI rule refers to the guideline that traders should closely monitor and validate POI levels before making trading decisions. This rule emphasizes the importance of patience and confirmation to avoid premature market entries or exits.
How does POI work?
POI works by highlighting key price areas where traders anticipate significant reactions based on historical data and market psychology. These points guide decision-making and strategy formulation in various trading scenarios.
What is the purpose of POI?
The purpose of POI is to provide traders with strategic reference points that help in forecasting potential market movements. By focusing on these interest areas, traders can enhance their decision-making process and improve the precision of their trading strategies.
What is the best timeframe for POI?
POIs exist on all timeframes because the market is fractal. However, H4 and Daily POIs carry more weight and are less susceptible to market noise than M1 or M5 POIs.
Why do POIs fail?
POI often fails because it was actually “Inducement.” If a zone looks too obvious and hasn’t swept any liquidity, it is likely a trap designed to be broken.
What is a mitigation in POI trading?
Mitigation occurs when price returns to a POI to close out open institutional positions (drawdown) before continuing the main trend. This return to the zone offers the entry signal.
Who Are the Best Forex Brokers?

Here are some trusted multiregulated forex brokers suitable for all styles of trading :
M4 Markets: Learn how M4 Markets achieves competitive trading with low spreads and high leverage. Discover their unique account options and more.

OneRoyal: Known for its social trading platform, OneRoyal offers many educational resources and a convenient demo account for practice.
IronFx: This broker provides a simple platform and a risk management tool, helping you better control your trading risks.
ActivTrades: Offers a user-friendly platform, extensive educational resources, and versatile demo accounts.
EightCap: EightCap wraps it up with an intuitive platform, top-notch educational materials, and an effective customer support team.
Conclusion
Trading POIs isn’t about predicting the future; it’s about reacting to the evidence left by major players.
- Stop marking every single up/down candle as a zone.
- Start looking for where retail traders are placing their stop losses.
- Wait for those stops to be hit before you look for an entry.
By focusing on liquidity rather than lines, you align your strategy with the engines that drive the market.
Disclaimer:
All information has been prepared by TraderFactor or partners. The information does not contain a record of TraderFactor or partner’s prices or an offer of or solicitation for a transaction in any financial instrument. No representation or warranty is given as to the accuracy or completeness of this information. Any material provided does not have regard to the specific investment objective and financial situation of any person who may read it. Past performance is not a reliable indicator of future performance.