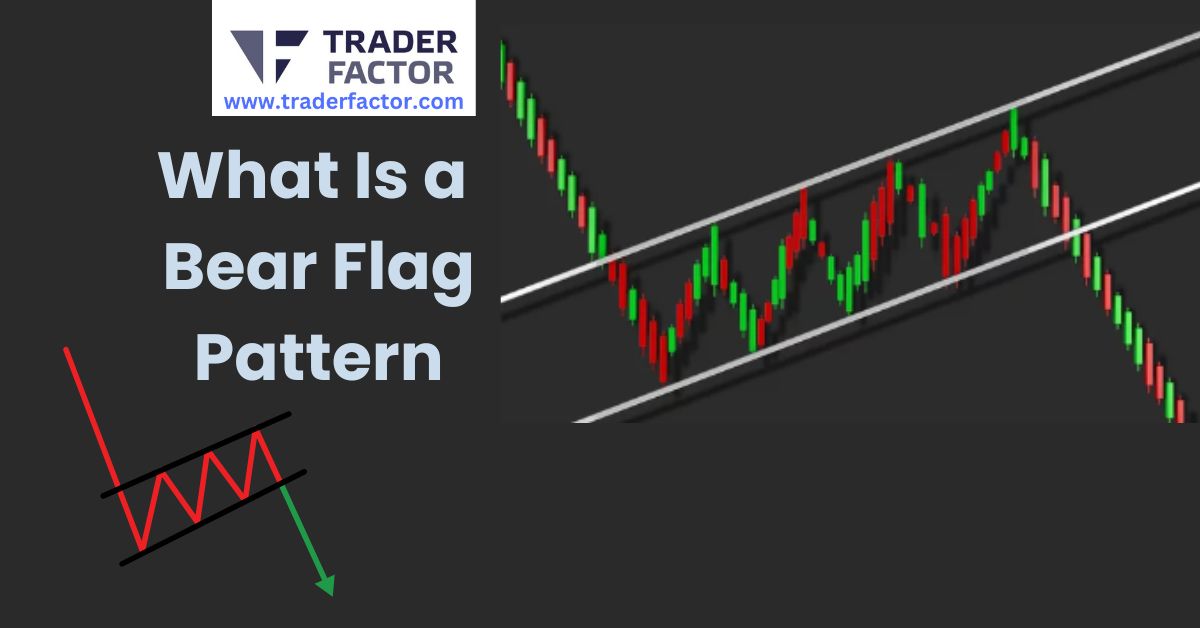

A bear flag pattern is a technical chart formation that indicates a continuation of a bearish trend. It starts with a sharp price decline forming the flagpole, followed by a consolidation phase characterized by slight higher lows and highs. Volume plays a key role, often high during the initial decline and lower during consolidation, before rising again upon breakdown. Traders watch for a break below the lower trendline to enter short positions. What Is a Bear Flag Pattern? Recognizing this pattern’s structure and volume dynamics helps make more informed trading decisions, which means understanding how this pattern evolves is essential for traders seeking to enhance their strategies.
Definition of Bear Flag
The bear flag pattern, an essential tool in technical analysis, signifies a bearish market continuation.

At its core, this pattern helps traders interpret market sentiment and price action strategies.
It starts with a steep decline known as the flagpole, followed by a brief consolidation phase where prices make slight higher lows and higher highs.
This consolidation forms the flag and indicates ongoing selling pressure.
Understanding bear flag psychology is important. During consolidation, some traders might mistakenly interpret the brief upward drift as a reversal, but seasoned analysts recognize it as a temporary pause before further decline. Accurate market sentiment analysis during this phase can prevent costly mistakes.
Technical analysis basics reveal that the bear flag pattern is reliable when preceded by a significant sell-off, which sets the stage for the flagpole. Utilizing price action strategies, traders monitor for a breakdown below the lower range of the consolidation phase, signaling renewed bearish control.
Risk management techniques are essential when trading bear flags. Traders should set stop-loss orders above the flag’s upper boundary to limit potential losses, ensuring disciplined and strategic market engagement. This multifaceted approach enhances trading decisions and minimizes risks.
Anatomy of the Pattern
Within the anatomy of the bear flag pattern lies significant insights for traders seeking to capitalize on bearish market trends. This pattern comprises two main components: the flagpole and the flag. The flagpole represents a sharp price decline, often driven by strong bearish sentiment and emotional selling. Following this, the flag forms through a consolidation phase marked by slight upward or sideways price movement, reflecting a temporary pause in the downtrend.

Understanding bear flag psychology is essential for market sentiment analysis. During the consolidation phase, traders’ emotions are mixed; some are hopeful for recovery, while others remain pessimistic. This tug-of-war creates the slight upward drift seen in the flag portion.
A detailed analysis of the pattern’s anatomy reveals the importance of risk reward ratios and breakout confirmation signals. Traders should monitor the pattern closely for a breakdown below the lower trendline, which serves as a significant signal for entering short positions.

| Component | Description | Importance |
|---|---|---|
| Flagpole | Sharp initial decline | Indicates strong bearish momentum |
| Flag | Consolidation phase | Temporary pause, trader emotions mixed |
| Breakout Signal | Breakdown below lower trendline | Confirms continuation of downtrend |
Accurate market sentiment analysis and understanding trader emotions are essential for leveraging this pattern effectively.
Key Formation Characteristics
Amid the essential aspects of technical analysis, key formation characteristics of the bear flag pattern provide traders with precise indicators for market behavior. This pattern, rooted in bear flag psychology, hinges on market sentiment analysis and the technical indicators interplay. The initial sharp price drop, known as the flagpole, is triggered by intense selling pressure. Following this, a consolidation phase emerges, where prices move within a tight range, forming the flag. This phase is vital as it reflects temporary equilibrium and the significance of consolidation phases.

Four key characteristics mark the formation of a bear flag:
- Initial Decline: A steep, almost vertical price drop indicating strong bearish sentiment.
- Consolidation Phase: A slight upward or horizontal movement within parallel trendlines, signifying a temporary pause.
- Volume Pattern: High volume during the initial decline, followed by lower volume during consolidation, illustrating trader emotions impact.
- Breakdown: Resumption of the downtrend with increased volume as prices break below the lower trendline.

Understanding these characteristics aids in deciphering market sentiment and anticipating future movements. This technical pattern’s reliability is enhanced by the interplay of these elements, guiding traders in making informed decisions.
Identifying Bear Flags
Identifying bear flags involves a keen understanding of market behavior and technical indicators. Traders need to closely analyze bear flag psychology, which reflects a temporary pause in a prevailing downtrend. By incorporating market sentiment analysis and observing trader behavior patterns, one can spot these formations effectively.

Bear flags start with a sharp price decline, forming the flagpole, followed by a brief consolidation phase that slopes counter to the previous trend. Utilizing technical analysis tools, such as trendlines and moving averages, helps in mapping these patterns accurately. Price action strategies are essential for confirming these formations, especially when the flag’s lower trendline breaks.
Here’s a table outlining the steps to identify a bear flag:
| Step | Description |
|---|---|
| 1 | Sharp price decline (flagpole) |
| 2 | Rectangular consolidation (flag) |
| 3 | Flag slopes upwards or sideways |
| 4 | Decrease in trading volume during consolidation |
| 5 | Break below the lower trendline confirms pattern |

These steps highlight the importance of a data-driven approach in recognizing bear flags. By understanding the interplay of market forces and trader psychology, traders can identify potential short-selling opportunities and enhance their trading strategy. This analytical approach guarantees that decisions are based on objective market signals rather than speculation.
Role of Volume
Understanding the interplay of market forces and trader psychology is key to identifying bear flag patterns. Volume analysis plays a significant role in confirming the legitimacy of these patterns. By scrutinizing trading volume, traders can discern whether a bear flag pattern is likely to result in a continuation of the downtrend.

- Volume Trends: During the initial sharp sell-off (flagpole), trading volume should be high, indicating strong bearish sentiment. Conversely, during the consolidation phase (flag), volume typically decreases, reflecting a temporary pause in selling pressure.
- Volume Indicators: Tools like the On-Balance Volume (OBV) and the Volume Oscillator help traders to gauge market sentiment and confirm the validity of the flag pattern.
- Volume Confirmation: A significant increase in volume upon the breakdown from the consolidation phase acts as a confirmation of the bear flag pattern. This surge implies renewed selling pressure and a likely continuation of the downtrend.
- Divergence Analysis: By comparing price movements with volume trends, traders can identify divergences that might signal a weakening pattern or a potential reversal.

Incorporating volume analysis, traders gain a more thorough understanding of bear flag patterns, enabling informed decision-making and enhancing trading accuracy.
Trading Strategies
Successful trading strategies for bear flag patterns hinge on precise timing and effective risk management. Traders typically initiate short selling positions when the price breaks below the flag’s lower trendline. This breakout often signals a resumption of the prior downtrend, making it an opportune moment for entering bearish trades.

Technical indicators such as moving averages and volume analysis play essential roles in confirming the pattern. A declining volume during the consolidation phase followed by a surge upon breakdown strengthens the validity of the bear flag. Additionally, setting stop-loss orders just above the upper trendline is critical for mitigating risks associated with market volatility.
Effective risk management strategies are indispensable. Traders must size their positions appropriately to avoid significant losses. Utilizing position size calculators can aid in maintaining balanced exposure. Furthermore, understanding trading psychology is fundamental. Recognizing emotional triggers and maintaining discipline helps traders stick to their strategies, even amidst fluctuating market conditions.

Benefits for Traders
Traders who effectively employ bear flag patterns in their strategies can reap significant benefits. This chart pattern offers several advantages, enhancing trading outcomes through data-driven analysis and disciplined execution.
Firstly, the bear flag pattern provides high profit potential. By identifying continuation signals in a downtrend, traders can enter short positions with confidence, leveraging the anticipated further decline for substantial gains.
Secondly, understanding market psychology through bear flag patterns allows traders to gauge the sentiment driving price movements. Recognizing these patterns helps in anticipating market reactions, providing a competitive edge.
Thirdly, bear flag patterns enforce trading discipline. By adhering to specific entry and exit points defined by the pattern, traders minimize emotional decision-making, leading to more consistent and rational trades.
Lastly, employing bear flag patterns supports risk management. The clear structure of the pattern, including defined stop-loss levels above the flag, helps limit potential losses and manage exposure effectively.

In summary, the benefits of using bear flag patterns include:
- High profit potential through precise entry points.
- Enhanced understanding of market psychology.
- Improved trading discipline by following structured strategies.
- Effective risk management via well-defined stop-loss placements.
These advantages make bear flag patterns a valuable tool for systematic and profitable trading.
Risks and Challenges
Steering through the risks and challenges of bear flag patterns requires a keen understanding of market dynamics and disciplined execution. Traders must navigate the complexities of market psychology, recognizing that patterns can sometimes lead to false signals. A sharp initial decline followed by a brief consolidation might suggest a continuation, but without proper trading discipline, traders might misinterpret these signals.

Managing risk tolerance is vital. Bear flag patterns can result in significant losses if the market reverses unexpectedly. Traders must set strict stop-loss orders and adhere to them without letting emotions interfere. Emotional management becomes a key factor, as market volatility can test even the most experienced traders. It is important to remain objective and not let fear or greed dictate trading decisions.

Pattern recognition skills are fundamental. Misidentifying a bear flag can lead to erroneous trades and potential financial setbacks. Traders should combine this pattern with other technical analysis tools to confirm its validity. Data-driven decisions, rather than impulsive actions, enhance the likelihood of success. By maintaining rigorous trading discipline and continuously refining pattern recognition skills, traders can mitigate the inherent risks of bear flag patterns.
Related Chart Patterns
In technical analysis, understanding related chart patterns can enhance a trader’s ability to predict market movements with higher accuracy. The bull flag pattern, a bullish counterpart to the bear flag, involves a sharp upward movement followed by a consolidation phase, signaling a continuation of the uptrend. Recognizing such patterns allows traders to refine their chart analysis and make more informed decisions.

The following related chart patterns are essential for thorough market analysis:
- Bull Flag: This pattern mirrors the bear flag but in an upward trend, featuring a steep rise (flagpole) followed by a consolidation period (flag). It indicates potential continuation of the bullish trend.
- Head and Shoulders: A reversal pattern that signals a potential trend reversal from bullish to bearish, identified by three peaks with the middle peak being the highest.
- Double Top and Bottom: Patterns indicating trend reversals, where the double top suggests a bearish reversal and the double bottom indicates a bullish reversal.
- Rising and Falling Wedges: These patterns can signal trend reversals or continuation depending on the wedge’s slope and the preceding trend.
Frequently Asked Questions

What Is a Bear Flag Pattern?
How Long Does the Consolidation Phase in a Bear Flag Typically Last?
The consolidation duration in a bear flag typically lasts one to three weeks. Traders analyze flagpole height, volume analysis, and breakout confirmation to develop trading strategies and capitalize on potential downward price movements.
Can Bear Flag Patterns Appear in Any Time Frame?
Yes, bear flag patterns can appear in any time frame. Traders perform time frame analysis, monitor trading volume, and utilize technical indicators for pattern recognition, aligning market trends to confirm the pattern’s validity across different periods.

Do Bear Flag Patterns Work in Both Crypto and Stock Markets?
Bear flag patterns work in both crypto and stock markets. Traders employ bear market strategies, trading volume analysis, risk management techniques, breakout confirmation signals, and market sentiment indicators to identify and act on these patterns effectively.
Are There Any Common Mistakes Traders Make When Trading Bear Flags?
Traders often misjudge bear flags due to poor entry strategies, inadequate risk management, and ignoring volume analysis. They may overlook market indicators, leading to emotional decisions influenced by flawed trader psychology, ultimately resulting in significant losses.
What Are the Psychological Factors Behind Bear Flag Patterns?
Trader sentiment and market psychology drive bear flag patterns. Fear selling and confirmation bias amplify emotional trading, leading to continuation patterns. Recognizing these psychological factors helps traders avoid pitfalls and make data-driven decisions.
Disclaimer:
All information has been prepared by TraderFactor or partners. The information does not contain a record of TraderFactor or partner’s prices or an offer of or solicitation for a transaction in any financial instrument. No representation or warranty is given as to the accuracy or completeness of this information. Any material provided does not have regard to the specific investment objective and financial situation of any person who may read it. Past performance is not a reliable indicator of future performance.