Learn the Smart Money Concept trading strategy step-by-step. Discover liquidity, order blocks, BOS, and proven entry models with real examples.
Smart Money Concept Trading Strategy (SMC Guide + Proven Setups 2026)
What is Smart Money Concept? QuicK Answer
Smart Money Concept (SMC) is a trading strategy that focuses on tracking institutional activity…
If you’re a beginner, you’ve probably heard about the smart money concept trading strategy. Have you ever timed your trade perfectly, only to watch the market take an unexpected turn? A smart money trading strategy (SMC) can help you decode these frustrating moments. Big players like banks and institutions use tactics like liquidity grabs and stop hunts to manipulate price action, forcing retail traders out of their positions. By understanding the order flow and spotting liquidity pools, you can align your trades with these market movers instead of fighting against them. SMC isn’t about luck; it’s about reading the market structure, identifying key mitigation zones, and trading with confidence. Learn how to trade smarter by thinking like the pros.

Key Takeaways– Inducements
- 📦 Order Blocks (OB): Inducement forms near zones of institutional activity.
- 📉 Support and Resistance: Key levels attract retail traders’ stop-losses.
- 🚨 Liquidity Traps: Beware of false breakouts and fakeouts.
- 📊 Market Structure Breaks: Often signals sharp price reversals.
What is Smart Money Concept (SMC)?
Smart Money Concept (SMC) is a trading strategy that focuses on tracking institutional activity—banks, hedge funds, and large financial players by analyzing liquidity, market structure, and price imbalances to identify high-probability trade setups.
Unlike traditional indicator-based trading, SMC is built on the idea that price is driven by liquidity and institutional order flow. Instead of reacting late, traders anticipate where institutions are likely to move price next.Overview: Smart Money Concept Trading Strategy
Imagine placing what you thought was the perfect trade, only to watch the market suddenly reverse and hit your stop-loss. Frustrating, right? This happens to many beginners because they’re unknowingly caught in the trap of market manipulation. The good news is, there’s a way to understand and even outsmart these moves through the Smart money concept trading strategy, or SMC.
At its core, SMC revolves around understanding how the “smart money” big players like banks, hedge funds, and institutional investors operate and influence market behavior. Unlike individual traders, these institutional giants use tactics that create sudden and dramatic price movements, catching less experienced traders off guard. One common tactic is the Liquidity Grab, where these players deliberately push prices in a way that triggers retail traders’ stop-loss orders, allowing them to collect liquidity and set the stage for their next move.

Beginners often struggle here because they aren’t familiar with how the market really works behind the scenes. It’s easy to think the market is random, but it isn’t; it’s heavily influenced by strategies like Order Flow, the method Smart money concept uses to analyze and fill large buy or sell orders without disrupting prices too much. Another challenge is the Stop Hunt, where sudden price movements are designed to shake out traders who entered just before a big move begins. If you’ve been tricked into closing your trade just before prices turn in your favor, it’s likely you’ve unwittingly faced a stop hunt.
Why Smart Money Concepts Work (The Real Edge)
Most retail traders lose because they:
- Enter trades late
- Use lagging indicators
- Place stop losses in predictable areas
Institutions exploit this behavior by:
- Targeting stop losses (liquidity)
- Creating false moves (manipulation)
- Entering at optimal price levels
SMC flips this dynamic by helping you:
Enter at premium or discount prices
Trade with institutional flow
Identify manipulation before expansion

You’ve probably fallen victim to these moves if you’ve wondered why prices seemed to “hunt” your stop-loss order. It’s not luck or bad timing; it’s the intentional handiwork of Smart money concept manipulating the market for their advantage. However, their strategies leave behind clues in the charts, like specific price patterns and sharp moves that traders can learn to spot.
Smart Money Concept Trading Strategy (Step-by-Step Model)
This is the exact framework used by advanced SMC traders.
Step 1: Identify Higher Timeframe Bias
Use H1–H4 charts to determine direction:
- Uptrend → Look for buys
- Downtrend → Look for sells
Avoid trading against higher timeframe structure.
Step 2: Wait for Liquidity Sweep
Before entering, price must:
- Take out highs or lows
- Trigger stop losses
- Trap retail traders
This confirms institutional intent.
Step 3: Confirm Break of Structure (BOS)
After liquidity is taken:
- Look for strong displacement
- Identify BOS in the new direction
This confirms the shift in order flow.
Step 4: Identify Entry Zone (Confluence)
Look for confluence between:
- Order Block
- Fair Value Gap (FVG)
- Premium/Discount level
The more confluence, the higher the probability.
Step 5: Execute Entry (Sniper Precision)
Drop to lower timeframes (M1–M5):
- Wait for confirmation (engulfing / rejection)
- Enter with tight stop loss
Step 6: Risk Management (Non-Negotiable)
- Risk 1–2% per trade
- Minimum 1:2 risk-to-reward ratio
- Move to breakeven when appropriate
Consistency comes from risk control—not just entries.
Example Trade Breakdown (Realistic Model)
- Price forms equal highs (liquidity)
- Price spikes above highs (liquidity sweep)
- Strong bearish displacement occurs
- Bearish BOS confirms direction
- Price retraces into FVG / order block
- Entry triggered on lower timeframe
- Target set at previous lows
This is the classic SMC setup used by professional traders.
Best Timeframes for Smart Money Trading
- Higher Timeframe (Bias): H1–H4
- Entry Timeframe: M1–M5
- Refinement: M1 for sniper entries
Multi-timeframe analysis is essential for precision.
Advanced Smart Money Concepts (Pro Level)
1. Breaker Blocks
Failed order blocks that flip direction and become continuation zones.
2. Mitigation Blocks
Areas where institutions re-enter positions to manage existing trades.
3. Inducement
False signals designed to lure traders into the wrong direction.
4. Liquidity Engineering
Understanding how institutions build and target liquidity over time.
Inducements
Inducement is a key concept in the world of Smart Money Concepts (SMC) that can significantly enhance a trader’s ability to predict market movements. At its core, inducement refers to market actions designed to lure retail traders into making impulsive decisions, often placing trades right before the smart money moves in the opposite direction. It’s a deliberate strategy used by large institutions to create liquidity for their positions.
Understanding inducement can transform the way you approach trading. By recognizing these setups, you can avoid falling into common traps and instead position yourself alongside institutional players. This concept helps traders refine their entries and identify potential reversals with higher accuracy, offering an edge in navigating the markets with confidence.

Understanding Market Manipulation
The financial markets often feel unpredictable, especially for beginners. One moment, a trade seems to be moving in your favor; the next, the market yanks the rug out from under you. What’s really happening? More often than not, it’s not just chance at play; it’s a form of market manipulation by big players like banks and institutional traders. These large entities, often referred to as “smart money,” use sophisticated tactics to shape price movements in their favor. Recognizing these moves is a critical skill for any trader.
By understanding tricks like the Liquidity Grab, Stop Hunt, and Retail Fade, you can start to see patterns in what seems chaotic and adjust your trades to work with Smart money concept, not against them. Let’s break these concepts down.

Liquidity Grab
Imagine you’re in a crowded parking lot, and you see someone waving at you. You think they’re motioning to get your attention, but instead, they’re signaling your car is in their way. The next thing you know, you’re maneuvering to let them through. A liquidity grab works in a similar way. Big players like banks and institutions know where retail traders tend to place their stop-loss orders. These stop-losses often cluster just above resistance levels or below support levels, forming what traders call liquidity pools.
When institutions need to execute large buy or sell orders, they target these areas to “trigger” the stop-loss orders and grab liquidity. For example, if a large institution wants to buy, they first drive the price lower to collect the sell orders created by stop-losses. This downward movement forces many retail traders to exit their positions. Once enough liquidity is in the market, the institution starts buying at a better price, driving the market upward.
How can you spot this? Look for sudden price moves that break key levels, such as support or resistance, especially if the price quickly returns to normal. These movements are more than likely liquidity grabs. By avoiding areas where stop-losses are traditionally placed and observing price patterns, you can prevent yourself from falling into the trap.

Stop Hunt
If you’ve ever placed a stop-loss thinking, “This position is safe,” only to have the market briefly dip down, trigger your stop, and then reverse in your favor, chances are you’ve experienced a stop hunt. This is another tactic of manipulation wherein big players intentionally move the price just enough to liquidate the positions of retail traders before pushing the market in their desired direction.
Picture this scenario. You see a promising upward trend and enter the trade at what looks like a solid spot. To protect your position, you place a tight stop-loss below the last low point. Moments later, the price dips sharply, triggering your stop-loss and closing your trade at a loss. What happens next? The price shoots back up in the original direction.
Why does this happen? Smart money, like institutional traders, uses stop hunts to eliminate smaller players and free up liquidity for their own trades. By triggering these stops, Smart money concept gains access to the pool of sell orders, which they use to fuel their own large buy orders. This creates better conditions for their trades to succeed.

To anticipate stop hunts, try to avoid placing your stop-loss in obvious places just below support or above resistance. Instead, consider using slightly wider stops or analyzing price action to understand where manipulation might occur.
Retail Fade
Have you heard the phrase, “The crowd is usually wrong”? This idea plays a significant role in the market through a concept called the retail fade. Smart money often trades against the majority of retail traders, knowing that most amateur traders follow predictable patterns or chase trends too late.
For example, if retail traders jump into a buying frenzy after seeing several big green candlesticks, smart money might take the opposite position. Why? Large institutional players know that retail traders tend to buy when prices feel safe, like during sharp upward moves, and sell when prices start dropping. By fading the retail crowd, Smart money concept can profit as prices revert to more realistic levels.

The retail fade works because it leverages human psychology. When retail traders panic or get lured in by hype, Smart money concept uses this behavior to their advantage. To avoid falling into this trap, try to remain level-headed and understand that following the herd can often lead to losses. Instead, pay attention to price patterns and learn to identify where institutions might be positioning themselves.
By recognizing these tactics, from liquidity grabs to retail fades, you’ll start to uncover the hidden forces at play in the market. The more you understand about how big players operate, the better equipped you’ll be to align your moves with theirs and make trading decisions with confidence.
Key Concepts to Master the SMC Forex
Mastering the smart money concept trading strategy (SMC) is all about understanding how big players operate and move the market. To do this, you need to get familiar with a few key concepts that serve as the backbone of this approach. These ideas help you think beyond the surface-level price movements and really dig into what’s happening behind the scenes. The concepts of Order Flow, Market Structure Shift (MSS), and Break of Structure (BOS) are essential tools for tracking institutional activity and identifying profitable opportunities.

Order Flow
Think of the financial market like a massive auction. Buyers and sellers are constantly coming together to agree on prices. However, when institutional investors, or smart money, make their moves, their orders are so large that they leave behind noticeable footprints in the market. That’s where Order Flow comes into play.
Order Flow is simply the analysis of buying and selling activity to identify where the big players are pushing the market. For example, if you notice a sudden surge in buy orders that causes the price to rise sharply, there’s a good chance that institutions are stepping in. On the flip side, large clusters of sell orders can signal that smart money concept is offloading their positions.

Here’s why this is important for you as a trader. By identifying areas where order flow is strong, you can position yourself alongside these larger players rather than against them. For instance, if you notice large buy orders coming in at a specific price level, it might indicate strong support, and an opportunity to buy before the price climbs. Learning to read these subtle cues can give you an edge in timing your trades.
Market Structure Shift (MSS)
Picture this scenario. You’re watching a downturn; prices keep dropping, making lower lows. Suddenly, instead of continuing downward, the market stabilizes and starts climbing, creating higher highs. This change in the trend is an example of what traders call a Market Structure Shift or MSS.
MSS refers to a change in the overall trend of the market, from bearish (downward) to bullish (upward), or vice versa. Understanding MSS is vital because it helps you adapt your strategy to align with the current trend. If you’re still betting on falling prices after the market has shifted upward, you’re bound to lose money.

Spotting an MSS requires paying attention to the highs and lows in price action. When the market breaks a significant previous low in an uptrend or a previous high in a downtrend, it could signal a shift. For beginners, using a chart with clear support and resistance levels is a great way to spot these shifts. Once you train your eye to recognize when the market is shifting, you’ll be able to enter trades earlier and with greater confidence.
Break of Structure (BOS)
Traders often say, “The trend is your friend,” but how do you know when the trend is changing? That’s where the Break of Structure, or BOS, becomes an essential concept. Essentially, a BOS happens when the market crosses a key boundary in its current trend, confirming that a shift is taking place.
Here’s an example to make it clearer. Imagine the market is in a solid uptrend, creating higher highs and higher lows. If the price suddenly breaks below the most recent higher low, it could signify that the bullish trend is weakening and a bearish movement is starting. This break is what traders call the BOS.

For traders, spotting a BOS is like shining a flashlight on possible opportunities. When this happens, it signals areas where institutions might be entering or exiting positions. Being able to recognize and react to BOS can help you align your trades with the market’s new direction.
Change of Character (ChoCH)
Smart Money Concepts (SMC) revolve around understanding market movements by analyzing the actions of institutional traders, and Change of Character (ChoCH) is a critical tool within this framework. ChoCH signifies a potential market reversal, occurring when price breaks a significant structural level, such as a swing high or low, signaling weakness in the existing trend. A bullish ChoCH suggests a shift from a downtrend to an uptrend, while a bearish ChoCH indicates the opposite. By identifying these moments, traders can gain early insights into market momentum changes, aligning their strategies with institutional moves rather than working against them.

Traders can use ChoCH to refine their entries and exits, avoiding premature decisions by waiting for retests near structural break areas like order blocks or liquidity zones. Pairing ChoCH with other SMC tools enhances its effectiveness; for instance, liquidity sweeps often precede reversals, offering additional confirmation for trade setups. By mastering ChoCH, traders can better anticipate market transitions, positioning themselves to capitalize on these shifts and execute higher-probability trades in sync with the smart money.
Bringing It All Together
Understanding these concepts, Order Flow, Market Structure Shift (MSS), and Break of Structure (BOS) is like learning to read between the lines of the market’s movement. These tools help you identify where the big players are active, how trends are changing, and when it’s time to adjust your strategy. The more you practice spotting these patterns, the more they will become second nature, guiding you toward smarter, more confident trading decisions.
Significant Tools for SMC
To really master the smart money trading strategy (SMC), you need to understand the tools that help you see behind the curtain of price movements. These tools are like a roadmap, guiding you through the complex and often unpredictable market terrain. They give you insight into how institutional players operate, where they might be entering or exiting trades, and how you can align your moves with theirs. Whether it’s spotting areas of aggressive buying or identifying key zones where price may revisit, tools like Imbalance, Liquidity Pool, Institutional Candle, and Mitigation Zone are essential in building your trading confidence. Let’s break them down in detail.

Imbalance (Fair Value Gap)
Have you noticed when the market makes a sharp, almost explosive move in one direction, leaving behind a gap in price? That’s known as an imbalance or a fair value gap (FVG). This occurs when aggressive buying or selling overwhelms the market, creating a gap that hasn’t been filled by any opposite trades.
Picture this as a tug of war where one team is so strong that they pull the rope far ahead, leaving no chance for their opponents to counter. For example, imagine a bullish imbalance shows up when buyers are so aggressive that prices shoot up quickly, creating a gap in the price action. These gaps often act like magnets, as the market tends to revisit them to “fill” that space, ensuring a balance between buyers and sellers.

For traders, identifying imbalance is crucial because it signals areas where price might return. If you see a fair value gap on a chart, there’s a strong chance it will eventually act as a potential entry zone, especially for institutional players looking to complete unexecuted orders. For example, when you spot a sharp move upward, you might wait for the market to pull back and tap into that imbalance before continuing its original trend.

Liquidity Pool
Think of a liquidity pool as a stash of orders sitting quietly in the market, waiting to be triggered. These are areas where stop-loss orders tend to cluster, often just above resistance levels or below support. Institutions use these liquidity pools to their advantage, knowing there’s a wealth of orders they can tap into when they need liquidity for their trades.
Here’s how it works. Imagine many traders have placed sell-side stop-loss orders just below a well-established support level. Institutions intentionally push the price downward, breaking through the support, to trigger those stop-losses. The result? They now have enough liquidity to buy at a better price before the market reverses and heads back up.

For you as a trader, understanding liquidity pools can help you anticipate where price manipulation might occur. Instead of placing your stop-loss in predictable spots around support or resistance, consider using slightly less obvious levels. Watch for those sharp bursts through key lines, and instead of getting shaken out, position yourself to align with the reversal.
Institutional Candle
An institutional candle, sometimes referred to as a “smart money candle,” is a large candlestick on a chart that represents significant institutional activity. These candles stand out because they often show a sharp change in direction or leave a noticeable wick behind, suggesting that major players have entered or exited the market.

For example, a bearish institutional candle might appear after a strong uptrend, as institutions sell off their positions at higher prices. These candles often signal zones of interest, where institutions have taken actions that can influence future price movements. Spotting an institutional candle can give you an edge by identifying potential reversal points or areas where price may revisit.
To use these candles effectively, look for unusual spikes in volume or sharp shifts in price. These signs suggest that larger players are involved, and tracking these candles can help you align your trades with institutional direction.
Mitigation Zone
A mitigation zone is where institutions revisit a price level to fill unexecuted orders they couldn’t complete the first time around. These zones act as a kind of pit stop for price action, where smart money returns to “mitigate” or correct an imbalance in their orders.
Here’s an example. Imagine a large institution begins buying aggressively, but their order is so big that the price shoots upward before they can get all their trades filled. Now there’s unfinished business at the lower price levels. To complete their orders, they might manipulate the market to drive the price back down to that same zone. This creates an opportunity for savvy traders to anticipate a reversal and enter their own trades alongside the institutional trend.

How can you spot mitigation zones? Look for areas near imbalances or institutional candles where price returns sharply after a major move. These are critical because they signal levels where institutions are likely to step in again, making them prime spots for entries or exits.
Bringing It All Together
Mastering tools like Imbalance, Liquidity Pool, Institutional Candle, and Mitigation Zone isn’t about memorizing definitions; it’s about learning to recognize their patterns in real market conditions. Each of these tools tells a story about what’s happening behind the scenes, helping you make sense of price movements that might otherwise feel random. The more you practice spotting these tools and understanding their significance, the closer you’ll get to thinking like the big players and executing smarter, more confident trades.
Smart Money Concepts (SMC) and Order Blocks
Smart Money Concepts (SMC) give traders a deeper understanding of how institutional investors operate in the market. At the heart of these concepts lies the idea of order blocks, a key tool that can reveal where smart money is placing their trades and how they’re influencing price movements. For traders learning SMC, mastering order blocks is a game-changer.
What Are Order Blocks?
Order blocks are areas on a chart where institutional buying or selling activity took place. Banks, hedge funds, and other big players can’t execute their trades in one go without causing huge market shifts. Instead, they divide their orders into blocks and execute them at certain price levels over time. These levels often leave traces on the charts, making them valuable clues for retail traders.

Think of order blocks as footprints left by institutional traders. They show areas of significant activity that can act as support or resistance levels when price revisits them. Typically, you’ll find these blocks before a strong market move, such as a Break of Structure (BOS), where they represent the smart money’s intention.
Why Are Order Blocks Important in SMC?
Order blocks reveal areas where institutional traders are likely to re-enter or exit their positions. These levels act as magnets for price, drawing it back to “fill” unfinished business. By understanding and using order blocks, you can align your trades with the market’s bigger players instead of guessing or reacting late.

For example, imagine spotting a bullish order block on a chart. This would suggest that significant buying pressure occurred at that level, and when the price dips back into this zone, it’s likely to bounce upward. On the other hand, bearish order blocks signal areas where heavy selling pressure happened.
How to Identify Order Blocks on a Chart
Look for Big Moves
Order blocks are usually found right before strong price movements or trends. For example, if you see price shoot up or drop significantly, check the candles leading to that move. They often reveal the order block.

Focus on the Last Bullish or Bearish Candle
To identify a bullish order block, find the last bearish candle before the strong upward movement. Conversely, for a bearish order block, look for the last bullish candle before a significant downward move.
Mark the Candle Body and Wicks
Draw a box around the selected candle, including its full body and wicks. This zone serves as a potential order block, and future price movement may respect this area.

Wait for a Retest
Price often returns to these zones over time, creating opportunities for entries. Look for confirmation such as a bounce or rejection at the level before initiating a trade.
Practical Examples of Order Blocks in SMC Trading
Bullish Example
Imagine a market trending upward, with a strong move following a dip. You notice the price retraced before the uptrend continued, with a large green candle leading the move. The last red candle before this surge becomes your bullish order block. When the price returns to this level, a buy position here could align your trade with smart money strategies.

Bearish Example
Consider a market where price trends downward, and a consolidation phase is followed by a sharp drop. The final green candle before this downward move marks the bearish order block. If the price revisits this level later, it becomes a potential zone to set up a sell position.
How to Use Order Blocks to Set Up Trades
Define Your Risk-to-Reward (R:R) Ratio
Once you’ve identified an order block, place your stop-loss just above or below the block (depending on whether it’s bearish or bullish). This minimizes risk if the trade idea doesn’t work out.
Combine with Other SMC Tools
Use order blocks in conjunction with tools like liquidity sweeps or Break of Structure (BOS). For instance, if there’s a liquidity sweep followed by the price entering a bullish order block, it could signal a strong buying opportunity.
Wait for Confirmation
The price returning to an order block isn’t always enough for action. Look for signals such as candlestick patterns or volume spikes to validate the trade.

Building a Confluence-based Strategy
If you’ve been trading for a while, you’ve probably had moments where a setup seemed perfect, but it didn’t go as planned. That’s where confluence comes in. Confluence is like having multiple green lights before you cross a busy street. It’s when several factors align to back up your trade idea, giving you more confidence that the odds are in your favor.
Confluence Explained
Think of confluence as a way to stack the deck in your favor. Instead of relying on just one signal, you look for several elements that confirm each other. For example, say you notice a Break of Structure (BOS) indicating a potential trend change. That’s a strong signal, but what if you also identified a Market Structure Shift (MSS) and a nearby Liquidity Pool? When these factors line up, you’ve got confluence, which helps validate the trade setup.

Here’s an example to make this concept clearer. Imagine the market is in a downtrend, consistently making lower lows and lower highs. Suddenly, you see the price break above the most recent lower high (a BOS), signaling a possible trend reversal. Around the same area, you notice a Liquidity Pool where stop-losses might have been triggered and a Market Structure Shift marking a shift toward bullish momentum. When all three align, it strengthens your case for entering a buy trade.
By using multiple indicators or tools together, you’re not just guessing; you’re building a logical, evidence-based case for your trade. This doesn’t guarantee success, but it does increase the likelihood of being on the right side of the market.
Risk-to-Reward Ratio (R:R)
Now, even the best setups can fail. That’s why having a solid Risk-to-Reward Ratio (R:R) is essential. The R:R measures how much you’re willing to risk compared to how much you stand to gain. It’s the foundation of disciplined trading.

Here’s how it works. Imagine you’re entering a trade with the potential to make $300 while you’re risking $100. Your R:R in this case is 3:1 because you’re aiming to earn three times as much as you’re risking. A good R:R ensures that you don’t need to win every trade to stay profitable. For example, if your strategy gives you a win rate of 40%, having an R:R of at least 2:1 means you’ll still come out ahead over the long run.
Think of it like this. Trading is a bit like playing a game, and your R:R is the rulebook that keeps you from going broke. Even if you lose more trades than you win, a strong R:R ensures that your wins outweigh your losses. For instance, if you lost 6 trades, each costing you $100, but won 4 trades with each earning you $300, you’d still net a $600 profit.
Maintaining a disciplined R:R helps protect you from over-risking on uncertain trades or chasing losses. It encourages you to stick to your rules, even when the market feels unpredictable.

Bringing It All Together
Building a confluence-based strategy isn’t just about finding multiple reasons to take a trade; it’s also about making sure those trades are worth the risk. By combining elements like BOS, MSS, and Liquidity Pools, you increase the likelihood of success. And by sticking to a solid R:R, you ensure that even when the inevitable losses happen, your account stays intact.
The key is patience. Not every trade will present the perfect confluence, and that’s okay. The idea is to wait for those high-probability setups where everything aligns, so you can trade with confidence and discipline. Over time, this approach will set you apart as someone who thinks like smart money, not just as another retail trader chasing quick wins.

Phases in the Market
Markets might seem like they move randomly, but when you look closer, you’ll notice repeating patterns. These patterns, called phases, reflect the ways smart money operates within the market. Understanding these phases can give you an edge, as they reveal where big players are building or exiting positions and help you identify potential trading opportunities.
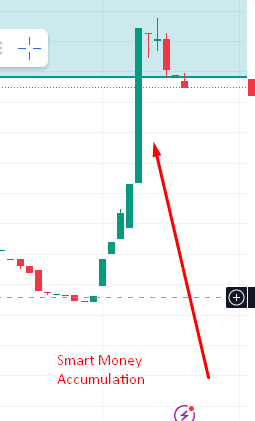
Accumulation/Distribution
The accumulation phase is like the “buying spree” for smart money. This is when institutional investors quietly build their positions without causing too much market movement. They don’t want to tip off retail traders by creating drastic price changes, so their buying happens gradually. You can often spot accumulation on a chart when the market moves sideways, stuck in a tight range. This phase is a sign that big players are preparing for an upward move.

The opposite is true for the distribution phase, where smart money begins unloading their positions. After a strong upward trend, they start selling off their assets, again in a gradual way to avoid triggering panic. You’ll likely notice the market moving sideways again, but this time, it could be a warning that prices are about to head down.
For traders, being able to spot accumulation and distribution phases on a chart can help you time your entry or exit. Look for areas of consolidation where the market is bouncing between support and resistance levels. For example, if the market has been in a downward trend but stalls and starts moving sideways, it’s often a sign of accumulation before the next bullish move. On the other hand, after an upward trend, if you see sideways movement, it could indicate distribution and a coming bearish shift.
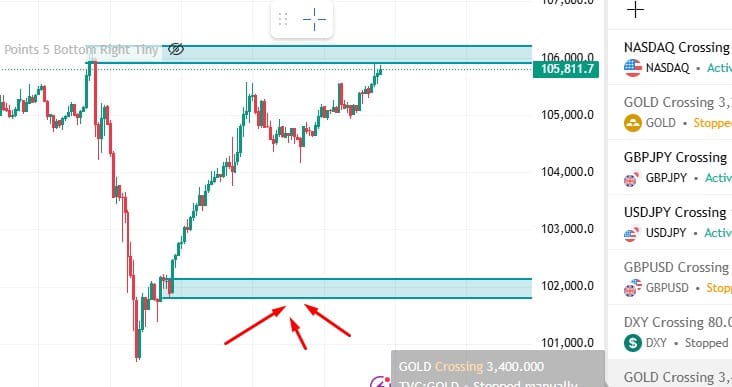
Sweep the Highs/Lows
Ever noticed the market suddenly spike above a resistance level only to crash right back down? Or break below support before reversing upward? This is what’s known as a liquidity sweep, or sweeping the highs/lows. It’s one of the most common tactics used by smart money to target liquidity.

Here’s how it works. Liquidity tends to pool around obvious levels, like recent highs (above resistance) and lows (below support). Retail traders often place their stop-loss orders in these areas. Smart money takes advantage of this by pushing the price into these zones to trigger those stops. Once the stops are cleared, they enter their positions in the opposite direction.
For example, imagine the price keeps testing a resistance level but can’t break through. Many retail traders start shorting with their stop-losses just above that resistance. Smart money then drives the price above the resistance to “sweep” those stop-losses, which adds more liquidity for them to sell. Once they’ve exited, the price typically returns to its original downward direction.
For traders, spotting sweeps comes down to watching key resistance and support levels. If you see a sharp spike above or below these levels followed by an immediate reversal, it’s likely a liquidity sweep. Learning to identify these moves can help you join smart money rather than get caught on the wrong side of the trade.

Putting It All Together
Understanding market phases like accumulation/distribution and sweeps is like learning the rhythm of the market. These patterns show you how smart money operates, giving you insights on when to enter or exit trades. By practicing how to spot these phases and moves on a chart, you’ll be better prepared to trade with confidence and align yourself with the market’s bigger players.
Practical Tips for Beginners
Starting to trade with smart money concepts might feel overwhelming, but don’t worry! With the right strategies and mindset, you can steadily build your skills and grow as a trader. Here are some practical steps to help you spot smart money behavior in live markets, along with common mistakes to sidestep.

Steps to Identify Smart Money Behavior
Observe Key Levels on the Chart
Smart money loves areas where liquidity is abundant, like near well-defined support and resistance levels. Pay close attention to these zones because they’re often targeted during institutional moves. For example, if you see price repeatedly testing a resistance level, there’s a good chance it might break through temporarily to trap traders before reversing.
Watch for Price Manipulation
Look for sharp price movements that seem out of place. These could be liquidity sweeps where the price spikes above a recent high or below a recent low, only to reverse quickly. This often signals that institutions are clearing stop-losses before making their actual move.
Pay Attention to Volume Spikes
Unusually large volume often indicates institutional activity. For instance, if you see a large bullish candle paired with a sudden volume increase after a period of low activity, it might be a sign of smart money accumulation.
Track Imbalances and Institutional Candles
Learn to identify imbalances or fair value gaps on the chart. These zones signal areas where aggressive buying or selling occurred. Keep an eye on them because prices frequently return to these spots, allowing institutions to finalize orders.
Be Patient
Smart money doesn’t rush, and neither should you. Wait for confirmation. For instance, if you’re anticipating a bearish move, wait for a Break of Structure (BOS) or rejection from a key level before committing to the trade.
Common Pitfalls to Avoid
Over-Leveraging Your Trades
It might be tempting to use high leverage to chase big profits, but this is one of the fastest ways to blow your account. Always use risk management and trade only what you can afford to lose. A good rule of thumb is to risk no more than 1-2% of your account per trade.

Chasing Trades
Jumping into the market late because you fear missing out can lead to losses. For example, if you see price sharply rising and you jump in without assessing the risk, you might get caught in a reversal. Stick to your plan and wait for the right setups.
Relying on One Indicator
Indicators can be helpful, but they shouldn’t drive your entire strategy. A moving average or RSI might confirm your idea, but never rely solely on them. Instead, understand the bigger picture using confluence from multiple tools like liquidity pools, BOS, and market structure.

Ignoring the Power of Patience
Most beginners feel they need to be in the market constantly to make money. However, the best trades often come from waiting for high-probability setups. Sitting on the sidelines is a skill in itself.
Failing to Manage Risk-to-Reward (R:R)
Don’t place trades with poor R:R. Even if the setup looks good, if the potential reward doesn’t outweigh the risk, it’s not worth taking. Aim for at least a 2:1 R:R to stay consistently profitable over time.
Conclusion
Smart money concepts (SMC) open the door to understanding how the big players operate and how traders can align their moves to benefit from these strategies. By focusing on elements like liquidity pools, market phases, and building confluence in your setups, you can uncover patterns that often go unnoticed. These tools and insights aren’t just about making trades; they’re about making informed, confident decisions.

Before applying these strategies to live markets, practice identifying them in a demo environment. Take your time to spot accumulation and distribution phases, recognize liquidity sweeps, and combine multiple signals for stronger setups. Mastery doesn’t happen overnight, and the learning curve may feel steep at times, but every chart you analyze and every lesson you learn is a step in the right direction.
Remember, patience and consistency are your greatest allies. The road to success with SMC involves learning from your mistakes, refining your approach, and staying disciplined. Trust in the process, keep honing your skills, and with effort and persistence, you’ll build the confidence and expertise to trade like the pros. You’ve got this!
Frequently Asked Questions

How to trade with smart money concept?
Focus on identifying institutional moves by spotting areas of liquidity, break of structure (BOS), and order blocks. Align trades with these signals.
What is the smart money concept roadmap?
The roadmap involves mastering order blocks, liquidity sweeps, break of structure (BOS), and Change of Character (ChoCH) to follow institutional activities.
How does the smart money concept indicator work?
It highlights key trading levels like order blocks, liquidity zones, and structural changes, helping traders make informed entry and exit decisions.
Is SMC trading profitable?
Yes, when applied correctly with a solid understanding, SMC can enhance profitability by aligning trades with market trends.

How to identify OB?
Order blocks are identified as zones where institutional buying or selling occurred, usually at the origin of a sharp price move.
Is SMC a good strategy?
Yes, SMC is effective as it emphasizes trading with institutional tendencies, offering refined and strategic trade setups.
What are the smart money rules?
Observe liquidity sweeps, focus on structural changes like BOS and ChoCH, and trade from key zones like order blocks and fair value gaps (FVGs).
What is the formula for smart money?
There isn’t a strict formula. It involves combining tools like liquidity zones, BOS, ChoCH, and order blocks to align with institutional flow.
What is the best concept of smart money?
The most impactful concept is understanding and trading from order blocks, as they reflect where large market players make moves.

Which timeframe is best for SMC trading?
Higher timeframes like 4-hour or daily charts are best for identifying key levels, while lower timeframes are ideal for confirming entries.
How to identify FVG in trading?
Fair value gaps (FVGs) are gaps in price action where no trades occurred, visible between candlestick wicks and bodies on a chart.
Is SMC good for scalping?
Yes, combining SMC principles like minor fair value gaps and liquidity sweeps on lower timeframes can work well for scalping.
What is ICT Smart Money Concept?
ICT, developed by Michael J. Huddleston, is an advanced trading methodology that focuses on institutional strategies using principles like BOS and FVGs.
What is SMC in Forex?
SMC in Forex involves using institutional trading concepts like liquidity grabs, BOS, and order blocks to trade currency pairs effectively.
Which is better, ICT or SMC?
Both offer valuable insights; ICT is more detailed and rules-driven, while SMC provides a broader framework. Choose based on your trading style.
Disclaimer:
TraderFactor or partners have prepared all the information. The information does not contain a record of TraderFactor or partner’s prices or an offer of or solicitation for a transaction in any financial instrument. No representation or warranty is given as to the accuracy or completeness of this information. Any material provided does not regard the specific investment objective and financial situation of any person who may read it. Past performance is not a reliable indicator of future performance.