
Are you looking to master forex trading? Look no further!
In this article, we will share with you 12 proven forex trading strategies and market forecasts that can help you become a successful trader.
Whether you prefer trend following, breakout trading, scalping, or range trading, we’ve got you covered.
With techniques like Fibonacci retracement, Bollinger Bands, and price action trading, you’ll gain valuable insights into the forex market.
Get ready to enhance your trading skills and make informed decisions with these strategies.
Key Takeaways
- Trend Following and Breakout Trading: Analyze market direction, trade with the trend, use technical analysis tools, wait for confirmation, and set stop-loss orders.
- Scalping and Range Trading: Make quick trades, focus on liquid currency pairs, use technical indicators, identify price levels, be disciplined, and avoid false breakouts.
- Fibonacci Retracement: Identify support and resistance levels, anticipate market retracements using Fibonacci ratios, and use Fibonacci retracement for entry and exit points.
- Moving Average Crossover and Indicator for Trend Reversal: Use moving averages to identify trend reversals, compare different periods, and validate with other indicators or patterns.
Trend Following
If you want to succeed in Forex trading, you should consider using a popular strategy called trend following. This strategy involves analyzing the direction of the market and trading in the same direction as the prevailing trend. By identifying and following trends, you can increase your chances of making profitable trades in the Forex market.
Trend following relies on the principle that trends tend to persist over time. It assumes that if a currency pair is moving in a particular direction, it’s likely to continue moving in that direction for a certain period. This strategy aims to capture the majority of a trend’s movement, allowing traders to profit from the overall direction of the market.
To implement trend following, you need to use technical analysis tools such as moving averages, trend lines, and indicators like the Relative Strength Index (RSI). These tools help you identify trends and determine entry and exit points for your trades. By following the trend, you can avoid making impulsive decisions based on short-term fluctuations and focus on the larger market movements.
One of the advantages of trend following is its simplicity. It doesn’t require complex calculations or extensive market knowledge. Instead, it relies on the basic principle of following the trend.
However, it’s important to note that trend following isn’t foolproof. It may not work in all market conditions, and there will be times when the market reverses unexpectedly. Therefore, it’s crucial to manage your risk and use proper money management techniques to protect your capital.
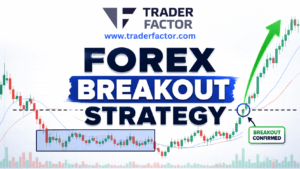
Breakout Trading
One key strategy for successful Forex trading is to utilize breakout trading. This strategy takes advantage of price movements that occur when the price of a currency pair breaks through a significant level of support or resistance. By identifying these breakout points, you can enter trades with the potential for high-profit opportunities.
Here are five important points to consider when using breakout trading:
- Identify key levels: Look for areas of support and resistance on the charts. These levels can act as barriers that, when broken, signal a potential breakout.
- Confirm the breakout: Wait for confirmation before entering a trade. Look for prices to close above or below the breakout level, ensuring that the move is genuine.
- Set stop-loss orders: Protect your capital by placing stop-loss orders below the breakout level. This will help limit potential losses if the breakout fails.
- Manage risk: Calculate your risk-reward ratio before entering a trade. Consider the potential reward compared to the amount of risk you’re willing to take.
- Follow the trend: Breakout trades are most effective when they align with the overall trend. Confirm the direction of the trend and focus on trading breakouts in that direction.

Scalping
To continue the discussion from breakout trading, another effective strategy in Forex trading is scalping, which involves making quick trades to capitalize on small price movements. Scalping is a popular strategy among traders who are looking for short-term gains and are willing to take on higher risks.
The main objective of scalping is to make small profits by executing multiple trades throughout the day. Traders who employ this strategy focus on finding opportunities in highly liquid currency pairs, such as the EUR/USD or GBP/USD, where small price movements are more frequent.
Scalping requires traders to closely monitor the market and take advantage of even the smallest price fluctuations. This strategy often involves using technical indicators, such as moving averages or Bollinger Bands, to identify potential entry and exit points. Traders must be able to make quick decisions and execute trades in a matter of seconds or minutes.
While scalping can be highly profitable, it’s also associated with higher transaction costs and increased exposure to market volatility. Traders must be disciplined and have a clear set of rules to manage their risk effectively.
It’s important to note that this strategy may not be suitable for all traders, as it requires a high level of skill and experience to execute successfully.

Range Trading
When range trading in Forex, you capitalize on price movements within a specific range by executing trades at support and resistance levels. This strategy is effective when the market is moving sideways and lacks a clear trend. Here are five key points to keep in mind when range trading:
- Identify the range: Look for price levels where the market has repeatedly reversed direction. These levels act as barriers, creating a range-bound market.
- Buy at support, sell at resistance: When the price reaches the bottom of the range (support), it’s a good time to buy. Conversely, when the price reaches the top of the range (resistance), it’s a good time to sell.
- Set stop-loss and take-profit levels: Place your stop-loss orders just outside the range to limit potential losses if the market breaks out. Take-profit orders can be set at the opposite end of the range to secure profits.
- Use oscillators to confirm trades: Oscillators like the Relative Strength Index (RSI) can help confirm overbought or oversold conditions within the range, indicating potential trade opportunities.
- Be patient and disciplined: Range trading requires patience and discipline. Stick to your strategy and wait for clear signals before executing trades. Avoid getting caught in false breakouts or choppy price movements.
Range trading can be a profitable strategy in Forex, but it requires careful analysis and adherence to the defined range. By following these guidelines, you can improve your chances of success in range trading.

Fibonacci Retracement
Now, let’s talk about the important concept of Fibonacci Retracement in trading.
This technique allows you to identify potential levels of support and resistance in the market by using Fibonacci ratios.
By applying these ratios to a price chart, you can anticipate where the market may retrace or pull back before continuing its trend.
Understanding Fibonacci Retracement can help you make more informed trading decisions and improve your overall market analysis.
Fibonacci in Trading
You can utilize Fibonacci retracement as a powerful tool in your trading strategy. Fibonacci levels are based on mathematical ratios that can help identify potential support and resistance levels in the market.
Here are five reasons why Fibonacci retracement is valuable for traders:
- It helps you identify key levels of support and resistance, which can be used for entry and exit points.
- It provides a framework for setting profit targets and stop-loss levels.
- It helps you identify potential trend reversals or continuation patterns.
- It can be used in conjunction with other technical indicators to confirm trading signals.
- It’s applicable to various timeframes, making it useful for both short-term and long-term traders.
Retracement for Market Analysis
Utilizing Fibonacci retracement as a tool for market analysis can provide valuable insights into potential support and resistance levels, enhancing your trading strategy. By applying this technique, you can identify key levels where prices may experience a retracement before continuing its trend.
Fibonacci retracement is based on the idea that markets tend to retrace a portion of their previous move before resuming their direction. Traders commonly use the Fibonacci retracement levels of 38.2%, 50%, and 61.8% to determine potential areas of support or resistance. These levels can act as turning points where prices may reverse or consolidate.
Moving Average Crossover
Moving Average Crossover is an important indicator in forex trading that can help you identify potential trend reversals. By comparing two moving averages of different time periods, it provides entry and exit signals for your trades.
Additionally, it’s beneficial to use multiple time frame analysis when applying this strategy to improve accuracy and make more informed trading decisions.
Indicator for Trend Reversal
The indicator that can be used for trend reversal is the crossover of moving averages. This occurs when a shorter-term moving average crosses above or below a longer-term moving average, indicating a potential change in the direction of the trend.
Here are five key points to consider about this indicator:
- Moving average crossovers can signal the start of a new trend or the reversal of an existing one.
- The crossover of a shorter-term moving average above a longer-term moving average suggests a bullish trend reversal.
- Conversely, the crossover of a shorter-term moving average below a longer-term moving average indicates a bearish trend reversal.
- Traders often use additional technical indicators or chart patterns to confirm the validity of the trend reversal signal.
- It’s essential to consider the timeframe and the specific currency pair being traded when using moving average crossovers as an indicator for trend reversal.
Entry and Exit Signals
To effectively identify entry and exit signals using the moving average crossover indicator, consider the following key factors.
First, pay attention to the crossover of two moving averages: a shorter-term moving average and a longer-term moving average. When the shorter-term moving average crosses above the longer-term moving average, it suggests a bullish signal and may be a good time to enter a long trade.
Conversely, when the shorter-term moving average crosses below the longer-term moving average, it indicates a bearish signal and may be a suitable time to enter a short trade.
Additionally, it’s essential to consider the market conditions and the overall trend before making any trading decisions based on the moving average crossover indicator.
Remember to always use proper risk management techniques and to validate signals with other technical analysis tools to increase the accuracy of your trades.

Multiple Time Frame Analysis
Consider using multiple time frame analysis to enhance the effectiveness of your trading strategy when using the moving average crossover indicator. This technique allows you to gain a broader perspective on market trends and make more informed decisions.
Here are five reasons why multiple time frame analysis can benefit your trading strategy:
- Confirmation: By analyzing different time frames, you can confirm the validity of your entry and exit signals, increasing your confidence in your trades.
- Trend identification: Multiple time frame analysis helps you identify the overall trend and avoid trading against the prevailing market direction.
- Precision: It allows you to pinpoint entry and exit levels with greater precision, improving your risk management and maximizing potential profits.
- Filtering out noise: By focusing on higher time frames, you can filter out short-term fluctuations and noise in the market, allowing for better decision-making.
- Trade timing: By using multiple time frames, you can identify optimal trade timing, increasing the probability of successful trades.

Support and Resistance
When trading in the Forex market, it’s crucial for you to identify the key levels of support and resistance that can significantly impact price movements. Support and resistance levels are areas on a price chart where the buying and selling pressure is expected to cause a pause in the current trend.
Support refers to a price level where buying interest is strong enough to prevent further price decline, while resistance refers to a price level where selling interest is strong enough to prevent further price increase.
Identifying support and resistance levels can provide you with valuable information about potential entry and exit points for your trades. By recognizing these levels, you can anticipate when a trend is likely to reverse or continue. When a price approaches a support level, it’s an opportunity to buy as the price is expected to bounce back up. Conversely, when a price approaches a resistance level, it’s an opportunity to sell as the price is expected to fall.
There are various methods to identify support and resistance levels, including trendlines, moving averages, and pivot points. These levels can be used in conjunction with other technical analysis tools to increase the probability of successful trades.

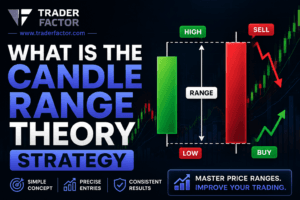
Candlestick Patterns
You should learn about the various candlestick patterns that can provide valuable insights into market trends and potential trading opportunities. Candlestick patterns are visual representations of price movement in a given time period, and they can help you make more informed trading decisions.
Here are five important candlestick patterns to be aware of:
- Doji: This pattern occurs when the opening and closing prices are virtually the same. It indicates indecision in the market and a potential reversal in the current trend.
- Hammer: A hammer pattern has a small body and a long lower shadow, resembling a hammer. It suggests a potential bullish reversal after a downtrend.
- Engulfing: An engulfing pattern occurs when a small candlestick is followed by a larger one that completely engulfs it. It indicates a potential reversal in the current trend.
- Morning Star: This pattern consists of three candlesticks – a large bearish candle, a small bearish or bullish candle, and a large bullish candle. It signals a potential bullish reversal after a downtrend.
- Shooting Star: A shooting star pattern has a small body and a long upper shadow, resembling a shooting star. It suggests a potential bearish reversal after an uptrend.
Bollinger Bands
Let’s talk about Bollinger Bands and how they can be a valuable tool in your forex trading strategy.
Bollinger Bands are a technical indicator that helps you identify potential price reversals and volatility in the market.
Bollinger Bands Explained
To understand Bollinger Bands and effectively incorporate them into your trading strategy, you need to analyze the volatility and price levels of a financial instrument. Bollinger Bands are a technical analysis tool consisting of a middle band, an upper band, and a lower band. These bands are based on a moving average and standard deviation of price.
Here’s what you need to know about Bollinger Bands:
- Middle Band: The middle band represents the moving average and acts as a support or resistance level.
- Upper Band: The upper band indicates overbought conditions and suggests a potential reversal or pullback.
- Lower Band: The lower band indicates oversold conditions and suggests a potential reversal or bounce.
- Width: The width between the upper and lower bands reflects the volatility of the financial instrument.
- Squeeze: When the bands contract, it implies low volatility and is often followed by a period of high volatility.
Using Bollinger Bands Effectively
Mastering the art of using Bollinger Bands effectively requires understanding their key parameters and incorporating them into your trading strategy.
Bollinger Bands consist of three lines: the middle band, which is a simple moving average, and the upper and lower bands, which are calculated by adding and subtracting a standard deviation from the middle band.
These bands provide valuable information about price volatility and potential reversal points.
When the price approaches the upper band, it may be overbought, indicating a possible reversal to the downside. Conversely, when the price approaches the lower band, it may be oversold, suggesting a potential reversal to the upside.
Traders often use Bollinger Bands in conjunction with other indicators to confirm signals and make more informed trading decisions.

Price Action Trading
When it comes to trading in the forex market, you can achieve success by incorporating price action trading strategies into your approach. Price action trading is a method that focuses on analyzing the movements of price on a chart, rather than relying solely on indicators or other technical tools. By observing and interpreting the price patterns and formations, you can make informed decisions about when to enter or exit a trade.
Here are five key points to remember when using price action trading:
- Candlestick patterns: Pay attention to the various candlestick patterns that form on the chart, such as doji, hammer, and engulfing patterns. These patterns can provide valuable insights into market sentiment and potential reversals.
- Support and resistance levels: Identify significant support and resistance levels on the chart. These levels can act as barriers for price movement and can help you determine potential entry and exit points.
- Trend analysis: Analyze the overall trend of the market to understand the general direction of price movement. Look for higher highs and higher lows in an uptrend, or lower highs and lower lows in a downtrend.
- Price rejection: Watch for instances where price repeatedly fails to break through a certain level, indicating a potential reversal or continuation of the trend.
- Risk management: Implement proper risk management techniques, such as setting stop-loss orders and managing position sizes, to protect your capital and minimize losses.

Fundamental Analysis
Incorporating fundamental analysis into your forex trading strategy is crucial for understanding the underlying factors that drive price movements in the market. Fundamental analysis involves evaluating economic, social, and political factors that can influence currency values. By analyzing these factors, you can gain insights into the overall health of an economy and make informed trading decisions.
One key aspect of fundamental analysis is examining economic indicators. These indicators provide valuable information about the state of an economy, such as GDP growth, inflation rates, and employment figures. By monitoring these indicators, you can identify trends and anticipate how they may impact currency values.
In addition to economic indicators, geopolitical events can also have a significant impact on the forex market. News related to political developments, trade agreements, and central bank decisions can all cause volatility in currency prices. Therefore, staying updated on global news and events is crucial for successful fundamental analysis.
Another important factor to consider is market sentiment. Market sentiment refers to the overall attitude of traders towards a particular currency. By understanding market sentiment, you can gauge whether traders are bullish or bearish on a currency, which can help you make more accurate predictions about future price movements.
Incorporating fundamental analysis into your forex trading strategy allows you to take a holistic approach to understanding the forex market. By considering economic indicators, geopolitical events, and market sentiment, you can make more informed trading decisions and increase your chances of success.

Technical Indicators
To develop a comprehensive forex trading strategy, it’s essential to utilize technical indicators that provide valuable insights into market trends and potential price movements. These indicators help you make informed decisions and increase your chances of success in the forex market.
Here are five key technical indicators that you should consider incorporating into your trading strategy:
- Moving averages: These indicators smooth out price data to identify trends and determine support and resistance levels.
- Relative Strength Index (RSI): This indicator measures the speed and change of price movements, indicating overbought or oversold conditions.
- Bollinger Bands: These bands consist of a moving average and two standard deviations, helping to identify price volatility and potential reversal points.
- MACD (Moving Average Convergence Divergence): This indicator measures the relationship between two moving averages, highlighting potential buy and sell signals.
- Fibonacci retracements: These levels are derived from the Fibonacci sequence and can help identify potential support and resistance levels.
Frequently Asked Questions

What Are the Best Timeframes to Use for Trend Following Strategies?
To effectively follow trends, you’ll want to use shorter timeframes for day trading, like 15 minutes or 1 hour. For longer-term trends, consider using daily or weekly timeframes. It all depends on your trading style and goals.
How Can Breakout Trading Be Used to Identify Potential Market Reversals?
To identify potential market reversals, breakout trading can be used. By looking for significant price movements beyond support or resistance levels, you can anticipate a change in market direction and make profitable trades.
What Are the Key Factors to Consider When Scalping in the Forex Market?
When scalping in the forex market, you need to consider key factors such as volatility, liquidity, and tight spreads. Additionally, focus on using short-term charts, setting precise entry and exit points, and managing risk effectively.

How Can Range Trading Be Adapted to Volatile Market Conditions?
To adapt range trading to volatile market conditions, you need to closely monitor price movements, set smaller profit targets, use tighter stop-loss orders, and be prepared for sudden changes in market direction.
What Are the Limitations of Using Fibonacci Retracement Levels in Forex Trading?
When using fibonacci retracement levels in forex trading, be aware of their limitations. They may not always accurately predict market trends and should be used in conjunction with other indicators for a more comprehensive analysis.
Conclusion
In conclusion, these 12 proven forex trading strategies and market forecasts provide a range of options for traders to consider. Whether you prefer trend following, breakout trading, scalping, range trading, or utilizing tools like Fibonacci retracement and Bollinger Bands, there’s something for everyone.
Price action trading, fundamental analysis, and technical indicators also offer valuable insights. By understanding and implementing these strategies, traders can enhance their chances of success in the forex market.
Disclaimer:
All information has been prepared by TraderFactor or partners. The information does not contain a record of TraderFactor or partner’s prices or an offer of or solicitation for a transaction in any financial instrument. No representation or warranty is given as to the accuracy or completeness of this information. Any material provided does not have regard to the specific investment objective and financial situation of any person who may read it. Past performance is not a reliable indicator of future performance.