
Learn how to trade the Hammer Candlestick Pattern like a pro. Discover bullish reversal signals, entry strategies, and trading tips.
Hammer Pattern Key Takeaways
- ✔ Appears after a downtrend
- ✔ Signals potential bullish reversal
- ✔ Long lower wick shows buyer strength
- ✔ Stronger with confirmation candle
- ✔ Best combined with support levels
Trade Hammer Patterns Like a Pro
Trade with NAGA Now →
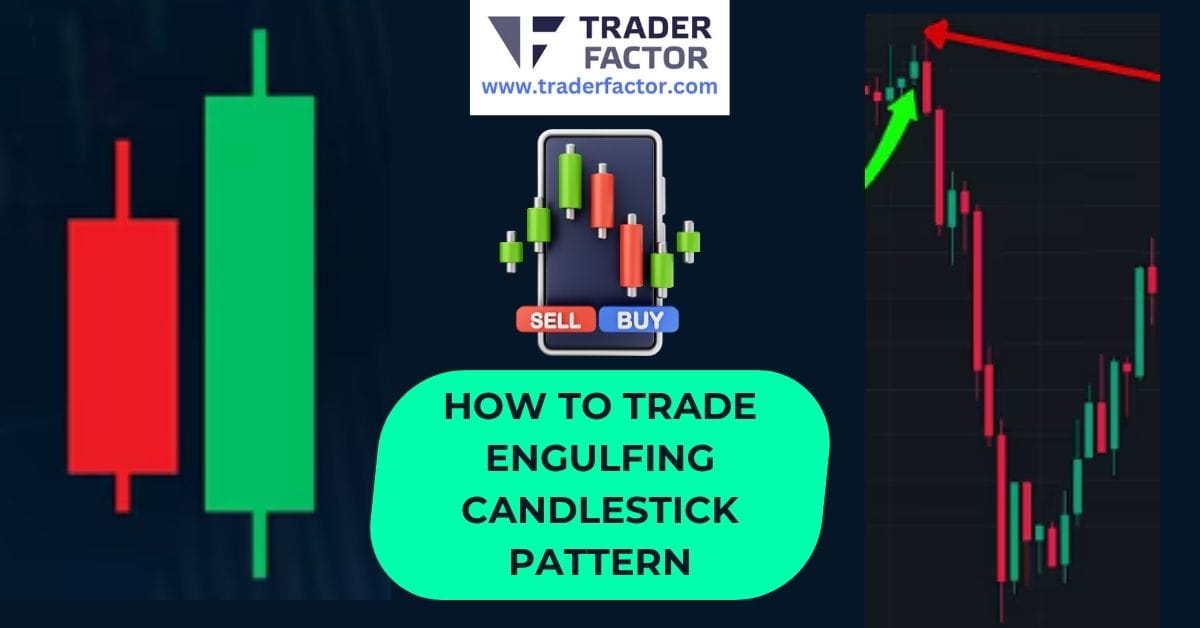
How To Trade Engulfing Candlestick Pattern: Beginners Guide
The engulfing candlestick pattern is a powerful two-candle reversal signal that technical traders use to identify potential turning points in the market. Understanding this formation allows you to spot moments of dramatic shifts in market sentiment, where momentum transfers from sellers to buyers or vice versa. For anyone involved in forex trading or who is a market enthusiast, learning how to trade the engulfing candle pattern is a crucial step toward interpreting price action more effectively. This guide will provide you with a comprehensive look into how to identify, interpret, and trade the engulfing candlestick pattern.
Understanding the Core of the Engulfing Candlestick Pattern
At its heart, the engulfing candlestick pattern tells a story of a battle between buyers and sellers where one side achieves a decisive victory. This pattern is formed by two consecutive candles. The first candle continues the current trend with a relatively small body. The second candle, however, opens at or near the previous close but then moves powerfully in the opposite direction, completely “engulfing” the body of the first candle. This powerful visual cue indicates that the momentum has shifted, and the previously dominant group has lost control. To effectively use this pattern, you must understand the psychology behind it; it’s a clear signal of rejection and a potential new trend beginning, making the engulfing candlestick pattern a favorite among price action traders.
What Defines an Engulfing Candlestick Pattern?
To properly identify and trade the engulfing candle pattern, you must recognize its specific criteria. The pattern consists of two candles.
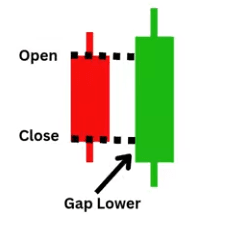
The first candle is smaller and reflects the current trend’s direction.
The second candle is larger, moves in the opposite direction, and its body must completely cover, or engulf, the body of the first candle. For a bullish engulfing pattern, a small bearish candle is followed by a large bullish candle.
Conversely, for a bearish engulfing pattern, a small bullish candle is followed by a large bearish one. The significance of the engulfing candlestick pattern is amplified when the second candle is substantially larger than the first, indicating a more forceful transfer of power.
The Psychology Behind the Engulfing Candlestick Pattern
The effectiveness of the engulfing candlestick pattern is rooted in market psychology. Imagine a market in a steady downtrend; sellers are in control, pushing prices lower. The first candle of the pattern is a small bearish candle, suggesting the trend is continuing. However, the second candle opens lower but then buyers step in with overwhelming force, driving the price up and closing above the previous candle’s open.
This action traps sellers who expected the downtrend to continue. This sudden and strong reversal, shown by the engulfing candlestick pattern, signals that sentiment has shifted, and buyers are now in control. This psychological shift is what makes the engulfing pattern a reliable indicator for traders.
Identifying the Types of Engulfing Candlestick Pattern
There are two primary types of the engulfing candlestick pattern that every trader should know: the bullish engulfing pattern and the bearish engulfing pattern. Each one signals a potential reversal, but in opposite directions. Recognizing the difference between these two is fundamental to using them in your trading strategy. The context in which these patterns appear—such as at the end of a clear trend and at a significant support or resistance level—greatly enhances their reliability. Correctly identifying these formations is the first step toward leveraging the power of the engulfing candlestick pattern in your analysis.
How to Identify a Bullish Engulfing Candle

A bullish engulfing pattern forms at the end of a downtrend and signals a potential upward reversal.
To identify a bullish engulfing candle, you look for a small bearish (red or black) candle followed by a larger bullish (green or white) candle whose body completely engulfs the body of the previous bearish candle.
This shows that despite the market opening lower, buying pressure was strong enough to not only reverse the initial losses but also to close above the previous candle’s high. Learning how to identify a bullish engulfing candle is a key skill, as this particular engulfing candlestick pattern often marks the bottom of a downward move.
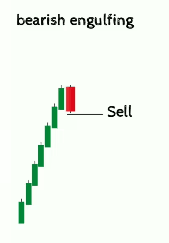
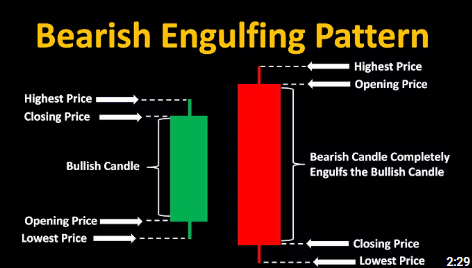
How to Identify a Bearish Engulfing Candle

Conversely, a bearish engulfing pattern appears at the end of an uptrend and indicates a potential downward reversal.
To identify a bearish engulfing candle, you should look for a small bullish candle followed by a large bearish candle that completely engulfs the body of the first. This formation shows that sellers have stepped in with significant force, overpowering the buyers and pushing the price down.
This shift in control suggests that the uptrend may be over. Properly identifying this engulfing candlestick pattern can give you an early signal to exit a long position or consider a new short entry.
Building an Engulfing Candle Strategy
Developing a robust engulfing candle strategy involves more than just spotting the pattern. It requires a systematic approach that includes confirmation, risk management, and an understanding of market context. A successful strategy will not rely on the pattern in isolation but will combine it with other technical analysis tools to increase the probability of a successful trade.
Whether you’re a beginner or an experienced trader, a well-defined engulfing candle strategy is essential for consistent results when trading the engulfing candlestick pattern. You may combine it with tools like the hammer candlestick or harami candlestick for confluence.
How to Trade Bullish Engulfing Patterns Effectively
To trade bullish engulfing patterns effectively, you should wait for confirmation. While the pattern itself is a strong signal, entering a trade immediately upon its formation can be risky. A common confirmation method is to wait for the next candle to close above the high of the bullish engulfing candle. This confirms that the buying momentum is continuing.
Another key aspect is placing your stop loss correctly, typically below the low of the engulfing candlestick pattern. For setting profit targets, you can look for previous resistance levels or use a fixed risk-to-reward ratio. This disciplined approach is crucial for how to trade bullish engulfing patterns effectively.
Bearish Engulfing Candlestick Strategy for Beginners
For beginners, a straightforward bearish engulfing candlestick strategy is essential. This strategy should focus on high-probability setups. Look for a bearish engulfing pattern to form at a clear resistance level after a sustained uptrend. Once the pattern is complete, you can seek confirmation from other indicators, such as a bearish crossover on a moving average or overbought readings on the RSI.
An entry could be placed below the low of the engulfing candle, with a stop loss just above its high to manage risk. This beginner-friendly bearish engulfing candlestick strategy helps filter out weaker signals and focuses on quality trades when analyzing the engulfing candlestick pattern.
The Role of Confirmation with the Engulfing Candlestick Pattern
Confirmation is a critical element when trading any chart pattern, and this is especially true for the engulfing candlestick pattern. Trading on the pattern alone can lead to false signals, as not every engulfing candle results in a major trend reversal. By seeking additional evidence that supports the reversal signal, you can significantly improve your trade accuracy. Confirmation can come in various forms, including subsequent price action, trading volume, and technical indicators. Integrating confirmation techniques into your trading plan is a professional approach to using the engulfing candlestick pattern.

How to Confirm Engulfing Patterns with Volume
One of the most effective ways to confirm an engulfing candlestick pattern is by analyzing trading volume. A valid reversal is often accompanied by a surge in volume on the day the engulfing candle forms. High volume indicates strong conviction behind the move and suggests that institutional traders may be participating. For a bullish engulfing pattern, a significant increase in volume adds weight to the idea that buyers are taking control. Similarly, for a bearish engulfing pattern, high volume reinforces the signal that sellers have overwhelmed the buyers. Using volume analysis is an excellent method for how to confirm engulfing patterns with volume.

Combining RSI with Engulfing Candlestick Patterns
Another powerful confirmation tool is the Relative Strength Index (RSI), a momentum oscillator. You can enhance your trading decisions by combining RSI with engulfing candlestick patterns. For instance, a bullish engulfing pattern that appears when the RSI is in oversold territory (typically below 30) is a much stronger buy signal. This alignment suggests that the downward momentum is exhausted, and a reversal is more likely. Conversely, a bearish engulfing pattern that forms when the RSI is overbought (above 70) provides a higher-probability sell signal. This combination helps filter out engulfing candlestick pattern signals that occur in the middle of a range and are less reliable.
Optimal Timeframes for the Engulfing Candlestick Pattern
Choosing the right timeframe is a crucial consideration for any trading strategy, and it is particularly important when trading the engulfing candlestick pattern. The reliability of this pattern can vary significantly depending on the chart’s timeframe. Generally, patterns that form on higher timeframes are considered more significant and reliable than those on lower timeframes. This is because they represent a larger shift in market sentiment over a longer period. Therefore, determining what timeframe is best for engulfing patterns is a key part of building your trading approach to the engulfing candlestick pattern.
Best Timeframes for Engulfing Candlestick Patterns
While the engulfing candlestick pattern can appear on any chart, the best timeframes for engulfing candlestick patterns are typically the daily, weekly, and 4-hour charts. On these higher timeframes, the pattern represents a more substantial and meaningful struggle between buyers and sellers, making the resulting signal more robust. A daily engulfing pattern, for example, encapsulates a full day of trading sentiment shifting, which carries more weight than a 5-minute pattern. Traders often use these higher timeframes to establish a directional bias and then may drop to a lower timeframe for a more precise entry.

What Timeframe Is Best for Engulfing Patterns in Day Trading?
For day traders who operate on shorter timeframes, the question of what timeframe is best for engulfing patterns requires a different perspective. While a 1-minute chart can be noisy, timeframes like the 15-minute, 30-minute, and 1-hour charts can offer reliable engulfing candlestick pattern signals for intraday trading. It is crucial for day traders to be even more stringent with their confirmation rules. Combining the pattern with session times, such as the London or New York open, can also increase its effectiveness, as these periods typically have higher volume and volatility.
Risk Management and the Engulfing Candlestick Pattern
Effective risk management is the cornerstone of successful trading, and it’s non-negotiable when dealing with the engulfing candlestick pattern.
No trading pattern is 100% accurate, and there will be times when an engulfing signal fails. Without a proper risk management plan, a single losing trade could wipe out a significant portion of your trading capital. This involves setting appropriate stop-loss orders, calculating position sizes correctly, and having a clear exit strategy for both winning and losing trades. Properly managing risk ensures your longevity as a trader using the engulfing candlestick pattern.
Risk Management for Engulfing Candlestick Trades
Proper risk management for engulfing candlestick trades begins with the placement of a stop-loss order. A logical place for a stop loss on a bullish engulfing setup is just below the low of the engulfing candle. For a bearish setup, the stop loss would go just above the high. This placement invalidates the trade setup if the market moves against you beyond the pattern’s range. Additionally, you should never risk more than a small percentage of your trading account (e.g., 1-2%) on a single trade. This discipline ensures that a string of losses won’t be catastrophic when trading the engulfing candlestick pattern.

The Success Rate of Bullish Engulfing and Realistic Expectations
It is important to have realistic expectations regarding the success rate of bullish engulfing patterns. While it is a reliable pattern, it is not foolproof. The win rate can vary based on market conditions, the timeframe used, and the trader’s skill in applying confirmation filters. Some studies suggest a success rate of around 60-75% when the pattern appears in the right context with proper confirmation. Understanding this helps you appreciate that losses are a normal part of trading the engulfing candlestick pattern. The key is to ensure that your winning trades are larger than your losing trades, achieving a positive overall expectancy.

Contextual Trading with the Engulfing Candlestick Pattern
Context is everything in trading. An engulfing candlestick pattern that appears in the middle of a choppy, directionless market is far less significant than one that forms at a key technical level. Contextual trading involves analyzing the broader market structure, identifying key support and resistance zones, and understanding the prevailing trend. By only taking trades where the engulfing pattern aligns with this broader context, you can dramatically improve your odds of success. This discerning approach separates professional traders from amateurs when using the engulfing candlestick pattern.
Engulfing Candlestick Patterns at Support Levels
When a bullish engulfing candlestick pattern forms at a significant support level, it becomes a high-probability buy signal. A support level is a price zone where buying interest has historically been strong enough to overcome selling pressure and push prices higher. The appearance of a bullish engulfing pattern at such a level provides a powerful confirmation that buyers are once again stepping in to defend that price area. This confluence of signals—a key level and a strong reversal pattern—is exactly what traders look for. It’s a prime example of using the engulfing candlestick pattern within a broader market context.

Comparing the Engulfing Pattern to the Inside Bar Strategy
The engulfing pattern and the inside bar strategy represent opposite market conditions. While the engulfing candlestick pattern shows a strong expansion of range and a decisive shift in momentum, an inside bar represents a contraction of volatility and a period of indecision. The inside bar’s range is completely contained within the prior bar’s range. Traders often look for a breakout from the inside bar as a signal of the next directional move. Understanding both patterns is useful; an engulfing pattern might signal the start of a new trend, while an inside bar often signals a consolidation before a continuation of the existing trend.
Advanced Techniques for Trading the Engulfing Candlestick Pattern
Once you have mastered the basics, you can explore more advanced techniques for trading the engulfing candlestick pattern. These methods can help you refine your entries, improve your timing, and find more trading opportunities. Advanced strategies often involve multi-timeframe analysis, combining the pattern with other candlestick formations, and using sophisticated entry techniques. Applying these advanced concepts can elevate your ability to profit from the engulfing candlestick pattern and give you an edge in the market.

Bullish Engulfing Pattern Trading Examples
To solidify your understanding, let’s consider a bullish engulfing pattern trading example. Imagine the EUR/USD pair is in a clear downtrend on the daily chart and approaches a well-established support level at 1.0500. On that level, a small bearish candle forms, followed by a large bullish candle that engulfs it, closing near its high. Volume on the engulfing day is significantly higher than average. This presents a strong buying opportunity. A trader might enter a long position once the next day’s price breaks the high of the engulfing candle, placing a stop loss below the low of the pattern, creating a practical application of the engulfing candlestick pattern.
Using TradingView to Spot the Engulfing Candlestick Pattern
Modern charting platforms like TradingView make it incredibly easy to find trading opportunities. You can use TradingView to spot the engulfing candlestick pattern in several ways. The platform has a built-in pattern recognition indicator that automatically highlights bullish and bearish engulfing patterns directly on your chart. Additionally, you can use the stock screener feature to scan thousands of markets across various timeframes for assets that are currently forming an engulfing pattern. This saves a tremendous amount of time and ensures you don’t miss potential setups, making TradingView an invaluable tool for trading the engulfing candlestick pattern.

The Engulfing Candlestick Pattern in Forex Trading
The engulfing candlestick pattern is particularly effective in the forex market due to its high liquidity and 24-hour nature. Forex pairs often trend strongly, providing clear opportunities for reversal signals like the engulfing pattern to appear at the end of swings. The principles of trading the pattern remain the same, but traders should be mindful of factors specific to forex, such as the impact of major economic news releases. For forex trading, the engulfing candlestick pattern can be a primary tool for identifying high-probability entry and exit points.
Applying the Engulfing Bar Strategy to Major Pairs
The engulfing bar strategy, another name for trading this pattern, works very well with major currency pairs like EUR/USD, GBP/USD, and USD/JPY. These pairs have high trading volumes, which generally leads to cleaner price action and more reliable chart patterns. When applying the engulfing bar strategy, focus on patterns that form on higher timeframes like the 4-hour and daily charts. For example, a bearish engulfing candlestick pattern at a key resistance level on the GBP/USD daily chart could signal a prime opportunity for a short trade, especially if it aligns with the broader market trend.

Engulfing Candlestick Patterns for Forex Trading Success
To achieve success with engulfing candlestick patterns for forex trading, discipline and patience are key. Avoid the temptation to trade every pattern you see. Instead, focus on A-grade setups where the pattern is clear, appears at a significant level, and is confirmed by other factors like volume or indicators. Keep a trading journal to track your engulfing pattern trades, noting the context, your entry and exit points, and the outcome. This process of review and refinement is essential for mastering the engulfing candlestick pattern and achieving long-term profitability in the forex market.
Final Tips and Considerations for the Engulfing Candlestick Pattern
As you integrate this pattern into your trading, there are several final engulfing candlestick pattern trading tips to keep in mind. Always wait for the candle to close before confirming the pattern. A pattern is not complete until the period ends. Also, be aware of the size of the engulfing candle; an exceptionally large candle might create a poor risk-to-reward ratio because the stop loss would have to be very wide. The engulfing candlestick pattern is a powerful tool, but it’s one piece of the puzzle. It should be used as part of a comprehensive trading plan that includes solid analysis, confirmation, and strict risk management.

Distinguishing from a Harami Candlestick
It’s important not to confuse the engulfing candlestick pattern with its opposite, the harami candlestick pattern. A Harami is a two-candle pattern where a small candle’s body is completely contained within the body of the previous, larger candle. While the engulfing pattern signals a strong, decisive reversal, the Harami indicates a loss of momentum and indecision. An engulfing pattern is an expansion of volatility, whereas a Harami is a contraction. Recognizing the distinct difference between these two patterns is vital for correctly interpreting the market’s message and applying the right strategy for the engulfing candlestick pattern.

What Happens After Bearish Engulfing?
After a bearish engulfing pattern forms, the expectation is for the price to move lower. This pattern indicates that sellers have taken control from buyers, and the preceding uptrend is likely to reverse or at least undergo a significant correction. Typically, traders will watch for the price to break below the low of the bearish engulfing candle as confirmation to enter a short position. The subsequent price action often involves a new downtrend or a period of consolidation before another leg down. Understanding what happens after bearish engulfing helps you anticipate the market’s next move after seeing the engulfing candlestick pattern.
Conclusion
In conclusion, the engulfing candlestick pattern is a vital tool for any trader looking to understand market reversals and shifts in momentum. By learning how to identify both bullish and bearish variations, you can gain valuable insight into price action. Remember that the pattern’s reliability is significantly increased when it appears at key support or resistance levels and is confirmed by other indicators like volume or RSI. A disciplined approach, incorporating a solid engulfing candle strategy and strict risk management, is essential. With practice and patience, the engulfing candlestick pattern can become a highly effective component of your trading arsenal.
Frequently Asked Questions

How to trade the engulfing candlestick pattern?
To trade the engulfing candlestick pattern, identify the pattern at a key support or resistance level. Wait for the engulfing candle to close, then seek confirmation from the next candle or an indicator like RSI before entering a trade with a defined stop loss.
What timeframe is best for engulfing?
Higher timeframes like the daily, weekly, and 4-hour charts are generally best for engulfing patterns as they provide more reliable signals. For day trading, the 15-minute to 1-hour timeframes can be effective when combined with other confirmation factors.
What is the 3 candle rule?
The 3-candle rule is often used for confirmation. After a reversal pattern like an engulfing candle, traders wait for a third candle that closes in the direction of the reversal to confirm the new trend’s strength before entering a trade.

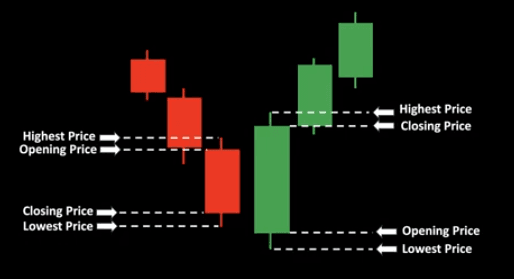
How to read candlestick pattern for beginners?
For beginners, start by understanding the basic components: the body shows the open and close prices, and the wicks show the high and low. A green/white candle means the price closed higher than it opened, while a red/black candle means it closed lower.
How to confirm an engulfing pattern?
Confirm an engulfing pattern by checking for increased volume on the engulfing candle. You can also wait for the next candle to close in the direction of the reversal or use indicators like RSI showing overbought/oversold conditions.
What happens after engulfing a candle?
After an engulfing candle, the market is expected to move in the direction of the engulfing candle. A bullish engulfing pattern suggests a potential uptrend, while a bearish engulfing pattern suggests a potential downtrend.

How to identify a bullish engulfing candle?
Identify a bullish engulfing candle by finding a small bearish candle followed by a larger bullish candle. The body of the bullish candle must completely envelop the body of the previous bearish candle, appearing at the bottom of a downtrend.
How accurate is the engulfing candlestick pattern?
The accuracy of the engulfing pattern can be high, often cited between 60-75%, but this depends heavily on market context. Its reliability increases significantly when it forms at key levels and is confirmed by other technical factors.
What is the engulfing bar strategy?
The engulfing bar strategy involves identifying an engulfing pattern and trading in its direction. This includes setting an entry after confirmation, placing a stop loss on the other side of the pattern, and establishing a clear profit target.

How to identify a bearish engulfing candle?
Identify a bearish engulfing candle by spotting a small bullish candle followed by a larger bearish candle at the top of an uptrend. The body of the bearish candle must completely engulf the body of the prior bullish candle.
What is the success rate of bullish engulfing?
The success rate of a bullish engulfing pattern is generally favorable but not guaranteed. When used with proper confirmation and in the right market context, its success rate can be quite high, but traders must manage risk for failed signals.
How many types of engulfing candlesticks are there?
There are two main types of engulfing candlesticks. The bullish engulfing pattern signals a potential move up, and the bearish engulfing pattern signals a potential move down.

What timeframe is best for engulfing patterns?
The best timeframes for engulfing patterns are higher ones like the daily and 4-hour charts, as they filter out market noise. However, they can be used on lower timeframes like the 1-hour or 15-minute with additional confirmation.
What is the win rate of engulfing?
The win rate of an engulfing pattern varies, but with proper strategy and confirmation, traders often aim for a win rate above 60%. Profitability depends on the risk-to-reward ratio, not just the win rate.
How to trade pin bar?
To trade a pin bar, identify a long-tailed candle at a key level, signaling a rejection of price. Enter in the direction of the rejection after the candle closes, with a stop loss placed beyond the end of the long tail.
How to identify a pullback candle?
A pullback candle is a candle that moves against the prevailing trend. For example, in a strong uptrend, one or more bearish candles would be considered pullback candles before the trend resumes.
What is the first candle strategy?
The first candle strategy often refers to trading based on the price action of the first candle of a new trading session. Traders look for breakouts from the range of this first candle to determine the intraday trend direction.
How to spot fake bearish engulfing?
Spot a fake bearish engulfing pattern if it forms in a choppy market without a clear uptrend. Low volume on the engulfing candle or a failure for the next candle to move lower also suggests it may be a false signal.
What is the strongest bullish pattern?
While “strongest” is subjective, many traders consider the bullish engulfing pattern, especially on a higher timeframe at a key support level with high volume, to be one of the strongest bullish reversal patterns.

What happens after bearish engulfing?
After a bearish engulfing pattern, the price is expected to decline as sellers have shown significant strength. This often marks the beginning of a new downtrend or a deep correction of the prior uptrend.
How to read a bullish engulfing pattern?
Read a bullish engulfing pattern as a strong signal that buying pressure has overwhelmed selling pressure. It indicates a potential bottom and the start of a new upward move.
How to know next candle green or red?
It is impossible to know with certainty whether the next candle will be green or red. Trading is based on probabilities, using patterns and indicators to forecast the most likely outcome.

Which time candle is best for day trading?
For day trading, many traders find the 5-minute, 15-minute, and 1-hour candles to be effective. The choice depends on the trader’s strategy and the volatility of the asset being traded.
What is the best indicator for a 5-minute trade?
For a 5-minute trade, many traders use a combination of indicators. Moving averages can help identify the trend, while oscillators like the RSI or Stochastics can help time entries and exits.
How reliable is an engulfing pattern?
An engulfing pattern is considered one of the more reliable candlestick patterns, especially on higher timeframes and with confirmation. However, no pattern is 100% reliable, and risk management is crucial.
What is the rarest candlestick pattern?
The Abandoned Baby is often considered one of the rarest candlestick patterns. It is a three-candle reversal pattern with a doji that gaps away from the candles on either side.
Which candle is best for intraday trading?
For intraday trading, candles on timeframes like the 5-minute, 15-minute, or 1-hour chart are commonly used. The best one depends on the trader’s specific strategy and the market’s volatility.
What timeframe do most day traders use?
Most day traders use a combination of timeframes, but the 5-minute and 15-minute charts are very popular for execution. They might also watch the 1-hour and 4-hour charts for higher-level context.
How do you know if a candlestick pattern is strong?
A candlestick pattern is considered strong if it has a large, decisive body, appears on a higher timeframe, forms at a key price level, and is accompanied by a significant increase in volume.
What is the engulfing technique?
The engulfing technique is a trading method based on the engulfing candlestick pattern. It involves identifying the pattern, confirming the signal, and executing a trade with proper risk management rules.
Disclaimer:
All information has been prepared by TraderFactor or partners. The information does not contain a record of TraderFactor or partner’s prices or an offer of or solicitation for a transaction in any financial instrument. No representation or warranty is given as to the accuracy or completeness of this information. Any material provided does not have regard to the specific investment objective and financial situation of any person who may read it. Past performance is not a reliable indicator of future performance.