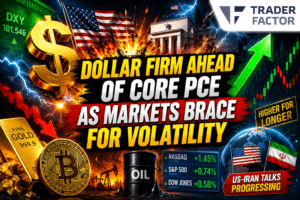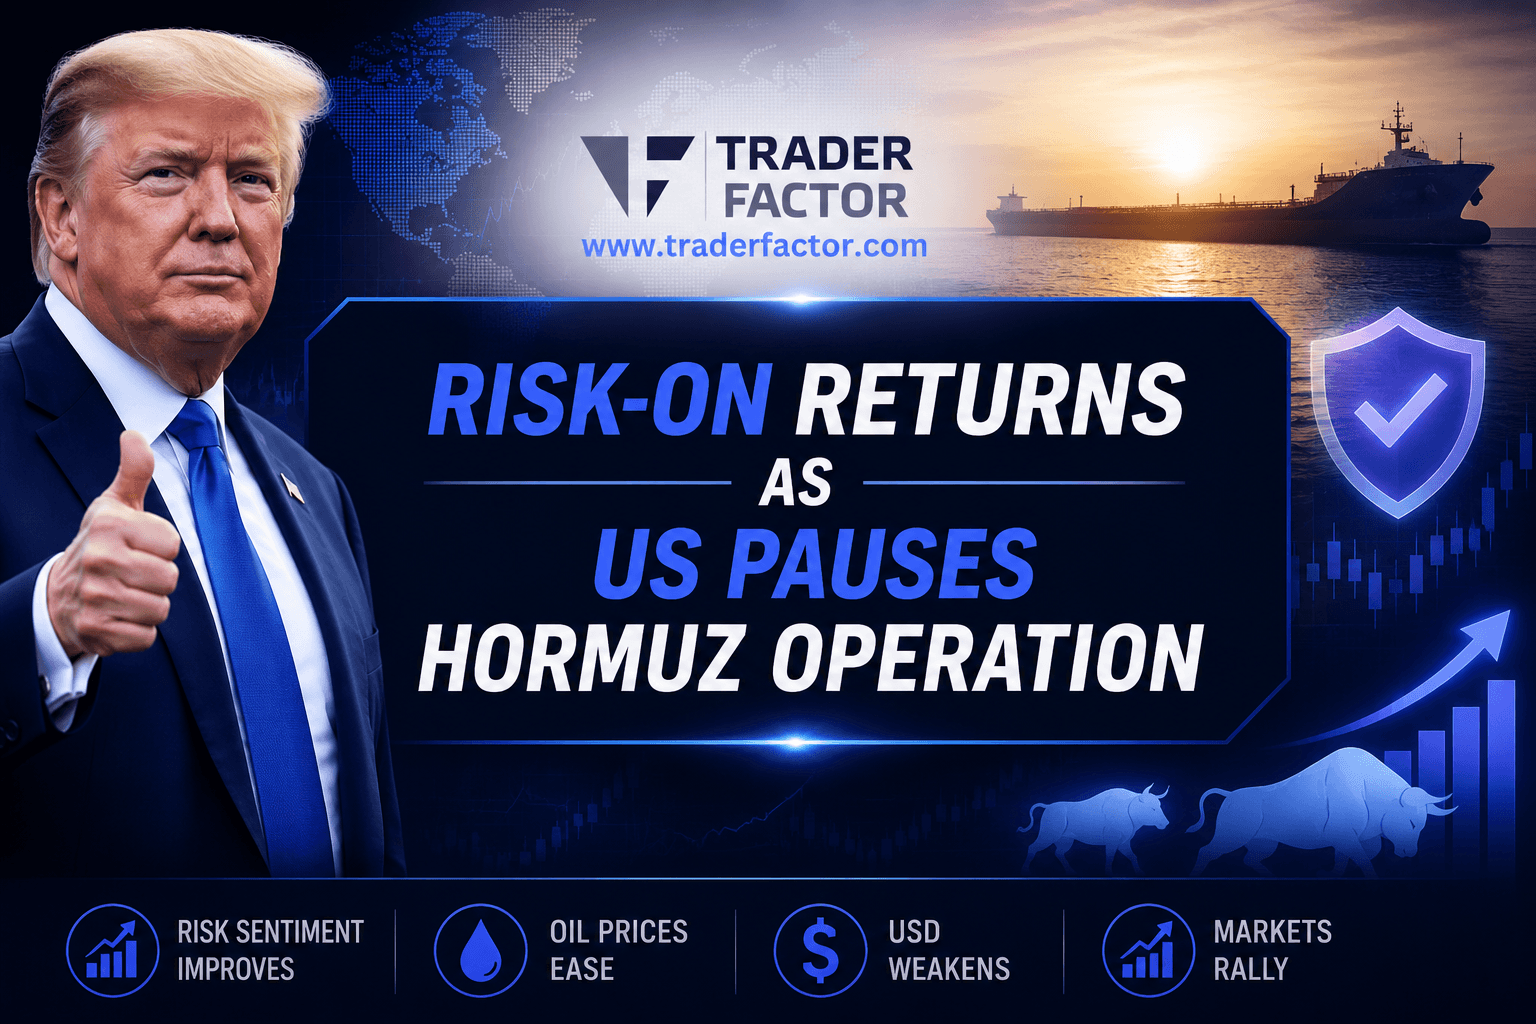

Risk-on returns as US pauses Hormuz operation. Oil drops, USD weakens, equities rally. Full outlook on FX, gold, equities and crypto market.
Positive Market Mood as US Pauses Hormuz Operation – Outlook on FX, Gold, Oil & Equities
Traderfactor Market Report- May 6, 2026
Markets are shifting from a geopolitical shock phase into a relief‑driven risk‑on environment after the US paused its Hormuz operation. The removal of immediate supply disruption risk has triggered repricing across key asset classes: oil is pulling back, equities are pushing higher, and the US dollar is weakening. However, this is not yet a stable trend environment. Price action is moving from headline‑driven volatility to more pattern‑based moves, with traders watching structure, momentum, and key levels.
Quick Answer
“What is driving the market after the US paused the Hormuz operation?”
Markets are in a short‑term risk‑on phase. Oil is correcting lower, the USD is weakening, and equities are trending higher. Current patterns favor continuation, but the next big move depends on signals from the Federal Reserve (FOMC).
Support and Resistance Levels

| Asset | Price | S2 | S1 | R1 | R2 | Bias |
|---|---|---|---|---|---|---|
| DXY | 98.099 | 97.20 | 97.50 | 98.80 | 99.30 | Bearish |
| Gold | 4651 | 4550 | 4600 | 4700 | 4800 | Neutral |
| EURUSD | 1.17312 | 1.1600 | 1.1650 | 1.1800 | 1.1900 | Bullish |
| GBPUSD | 1.35881 | 1.3450 | 1.3500 | 1.3650 | 1.3750 | Bullish |
| NZDUSD | 0.59450 | 0.5850 | 0.5900 | 0.6000 | 0.6050 | Bullish |
| AUDUSD | 0.72471 | 0.7150 | 0.7200 | 0.7300 | 0.7350 | Bullish |
| USDCAD | 1.35937 | 1.3500 | 1.3550 | 1.3650 | 1.3700 | Bearish |
| USDJPY | 156.254 | 154.50 | 155.00 | 158.00 | 160.00 | Bullish |
| USDCHF | 0.78040 | 0.7750 | 0.7780 | 0.7850 | 0.7900 | Bearish |
| BTCUSD | 81412 | 79000 | 80000 | 83000 | 85000 | Bullish |
| OIL | 96.955 | 92.00 | 94.00 | 100.00 | 105.00 | Bearish |
| NAS100 | 28231 | 27800 | 28000 | 28500 | 29000 | Bullish |
| US30 | 49418 | 48800 | 49000 | 50000 | 50500 | Bullish |
| SP500 | 7290 | 7200 | 7250 | 7350 | 7400 | Bullish |

Gold
“Why is current bias for Gold( XAUUSD)?”
Gold (XAUUSD) at around 4650 is currently sitting in a key equilibrium zone where both higher timeframe and lower timeframe structures are in transition. On the higher timeframe, the broader trend remains bullish, supported by the fact that price has maintained a strong long-term uptrend and continues to hold above major structural support around 4520–4450.
However, the recent price action shows signs of slowing momentum and distribution, with the market shifting from a clean trending phase into a broader consolidation range between roughly 4600 and 4750. This suggests that while buyers still control the macro structure, profit-taking and institutional rotation are increasingly active near the upper levels, especially around the 4700–4850 supply zone, where sellers have historically defended price aggressively.
The key levels to watch are 4620 on the downside and 4715 on the upside, as a break of either will likely determine the next directional expansion.
Oil
“Why is oil falling after the US paused the Hormuz operation?”
Oil is unwinding the geopolitical risk premium that built up during the crisis. The recent spike created a classic blow‑off top, where price shot up and then immediately fell back. Now oil is making lower highs, meaning sellers are stepping in. However, volatility remains high. This is a correction within a wider elevated range, not a full bearish reversal unless the downward structure strengthens decisively.
US Dollar Index (DXY)
“Why is the US dollar weakening?”
The DXY is making lower highs inside a short‑term downtrend, confirming that buyers have lost control. Momentum is rolling over, and the index is struggling to reclaim broken support levels. Unless a strong catalyst (like a hawkish Fed) appears, the dollar is likely to stay soft.

Euro (EURUSD)
“Why is the euro moving higher?”
The euro is in a clean upward trend, making higher highs and higher lows. Price is respecting bullish order flow with shallow pullbacks, which indicates strong demand. Momentum is intact, so continuation looks more likely than a reversal.
British Pound (GBPUSD)
“Why is the pound rallying so strongly?”
Sterling is in a strong bullish expansion phase. It’s moving impulsively with very small retracements, a sign of trend acceleration. That said, it is becoming extended, so a short‑term pullback is possible before the next leg up.
Australian Dollar (AUDUSD)
“Why is the Aussie dollar breaking higher?”
The Australian dollar has broken out of a consolidation zone and resumed its uptrend. Price has held above previous resistance, confirming bullish intent. With risk sentiment improving, the Aussie is likely to continue higher.

New Zealand Dollar (NZDUSD)
“Why is the kiwi outperforming?”
The kiwi is similar to the Aussie but with even stronger momentum, helped by solid local fundamentals (unemployment data beat expectations). Price is testing upper boundaries and looks ready to either break out or consolidate briefly before another push up.
Canadian Dollar (USDCAD)
“Why is the Canadian dollar gaining despite lower oil?”
USDCAD is forming a bearish structure with consistent lower highs. Even though oil pulled back, the pair is still under pressure because the risk environment favors the loonie. Momentum is shifting downward, suggesting this could be the start of a new trend rather than a temporary dip.
Japanese Yen (USDJPY)
“Why is USDJPY still climbing?”
USDJPY remains in one of the strongest uptrends in the market. Price continues to make higher highs with strong impulsive moves. There are no major reversal signals yet, though the trend is extended, so a brief pause or shallow pullback is possible.
Swiss Franc (USDCHF)
“Why is the Swiss franc weakening?”
USDCHF is clearly bearish. Price is trading below key levels with very weak retracements, meaning sellers are in control. This aligns with the broader dollar weakness and falling demand for safe havens.

Bitcoin
“Why is Bitcoin holding above $80,000?”
Bitcoin is maintaining a strong bullish trend, holding above important psychological levels. The structure shows continuation after a period of consolidation, with solid support. Volatility has compressed, which often signals a big move ahead – likely tied to overall risk sentiment.
Equities (NAS100, US30, S&P 500)
“Why are stocks rallying after the Hormuz pause?”
Equities are in a trend continuation phase, supported by better sentiment.
- NAS100: Strong bullish momentum with acceleration, led by tech stocks.
- US30: A steady uptrend that looks like institutional buying.
- S&P 500: Broad strength with consistent higher lows – a healthy trend, not a speculative spike.

Geopolitical Developments
- The US signaled an end to the offensive phase.
- The Hormuz operation has been paused amid ongoing negotiations.
- Markets have removed the worst‑case oil disruption scenario.
- There is a clear shift from panic pricing to risk normalization.
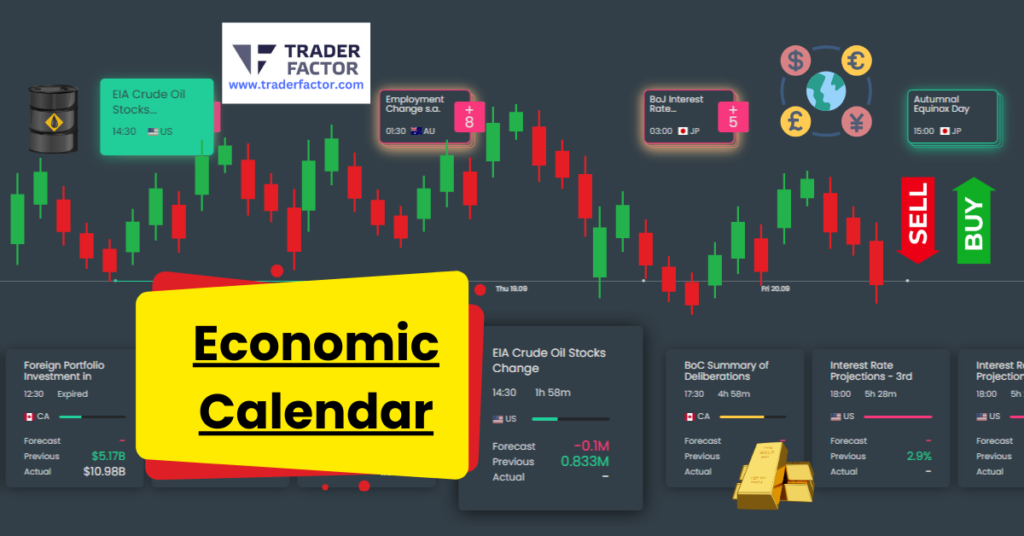
Economic Calendar & Key Events
- New Zealand unemployment beat expectations, reinforcing NZD strength.
- FOMC speeches are coming up and will be critical for the dollar.
Markets will react to:
- Hawkish tone → USD rebound, pressure on risk assets
- Dovish tone → continuation of the current risk‑on move
Final Outlook
This is not just a relief bounce. It is a transition from shock to structure.
- Markets are moving from emotion‑driven behavior to pattern‑based moves.
- Risk assets show clean continuation patterns.
- The US dollar is structurally weaker in the short term.
- Oil is correcting, not collapsing.
Key insight: If momentum holds through FOMC commentary, the risk‑on move can extend. If not, expect sharp reversals because geopolitical conditions remain fragile.
Short‑term outlook: Controlled risk‑on, but highly sensitive to headlines and central bank signals.
Author Details:
Phyllis Wangui
Senior Market Analyst, TraderFactor
Phyllis Wangui is a seasoned financial markets analyst with over a decade of experience in forex and CFD brokerage evaluation. Specializing in regulatory compliance and risk assessment, she leads the TraderFactor reviews team in delivering transparent, data-driven broker breakdowns that help retail traders navigate complex offshore and Tier-1 trading environments.
Reviewed by Alex Kanyi
Head of Compliance | TraderFactor
“This report is for general information only. Trading involves significant risk. Seek independent advice before acting on any content.”
[Subscribe to the TraderFactor Newsletter]
Last Updated: May 2026
Disclaimer:
All information has been prepared by TraderFactor or partners. The information does not contain a record of TraderFactor or partner’s prices or an offer of or solicitation for a transaction in any financial instrument. No representation or warranty is given as to the accuracy or completeness of this information. Any material provided does not have regard to the specific investment objective and financial situation of any person who may read it. Past performance is not a reliable indicator of future performance.