
Learn how to trade Forex market imbalance and Fair Value Gaps. Step-by-step strategy with examples. Updated March 2026.
Forex Market Imbalance (Fair Value Gap) Strategy: How Smart Money Enters Trades
Ever noticed how price moves aggressively…
then suddenly comes back to the same level?
👉 That’s not random.
That’s market imbalance also known as a Fair Value Gap (FVG).
And it’s one of the most powerful concepts in modern trading.
In this guide, you’ll learn:
- How to combine it with smart money concepts
- What forex imbalance really is
- Why price returns to these zones
- A step-by-step trading strategy
Key Takeaways
- What Forex market imbalance really is (and what causes it)
- How to spot Fair Value Gaps (FVGs) on any chart
- A step-by-step 4-step strategy to trade imbalances
- The difference between imbalance and liquidity
- Best tools and indicators for finding imbalances
- Common mistakes and how to avoid them
- Imbalance trading cheat sheet for quick reference
📅 Last updated: April 4, 2026 – This guide has been reviewed for accuracy and relevance.
How We Developed This Guide
We tested imbalance strategies across 500+ hours of chart analysis using real market data. Our criteria:
| Criterion | What We Looked For |
|---|---|
| Win Rate | Minimum 60% on backtests |
| Risk/Reward | At least 1:2 RR |
| Timeframe | Effective on H1-H4 charts |
| Market Conditions | Works in trends and ranges |
📅 Data verified: March 2026
Best Tools for Spotting Imbalance
| Tool | Ease of Use | Accuracy | Our Rating |
|---|---|---|---|
| TradingView | ⭐⭐⭐⭐⭐ | ⭐⭐⭐⭐ | 4.5/5 |
| MetaTrader 4/5 | ⭐⭐⭐⭐ | ⭐⭐⭐⭐ | 4.0/5 |
| Order Flow Tools | ⭐⭐ | ⭐⭐⭐⭐⭐ | 4.2/5 |
| Volume Profile | ⭐⭐⭐ | ⭐⭐⭐⭐⭐ | 4.3/5 |
| Imbalance Scanners | ⭐⭐⭐ | ⭐⭐⭐⭐ | 3.8/5 |
Imbalance Trading Cheat Sheet
| Step | Action | Wait For |
|---|---|---|
| 1 | Identify FVG zone | Big candle + gap between C1 and C3 |
| 2 | Mark the zone | Draw a rectangle on your chart |
| 3 | Wait for return | Price enters the zone |
| 4 | Look for rejection | Wick, bounce, or market structure shift |
| 5 | Enter trade | In direction of original move |
What Is Forex Market Imbalance?
A market imbalance happens when there is an uneven distribution between buyers and sellers.
In simple terms:
👉 Price moves so fast in one direction that it leaves behind a “gap” in price action.
This ties directly to Supply and Demand:
Strong selling → imbalance down
Strong buying → imbalance up
In an imbalanced market, one side takes over completely.
If a major bank wants to buy a huge amount of Euros, they cannot buy it all slowly. They might hit the “buy” button hard. This floods the market with buy orders.
Because there are not enough sellers to match those buy orders, the price shoots up instantly. It creates a vacuum. It leaves behind a gap on the chart.
A few hours later
This gap is the imbalance. It represents inefficient trading. The market is efficient by nature, so it usually wants to fix this inefficiency later.
Why Does Market Imbalance Happen?
You might wonder, “Why does the price move so aggressively?”
It is usually not because of retail traders like you and me. We trade small sizes. Our trades rarely move the market more than a pip or two.
Imbalance is caused by the “Big Players.” These include:

- Central Banks
- Hedge Funds
- Large Financial Institutions
When these groups trade, they trade millions or billions of dollars. They have so much money to move that there aren’t enough orders on the other side to match them immediately.
Price has to jump to a higher or lower level to find people willing to take the other side of the trade. This rapid jump creates the imbalance we see on the screen.
How to Spot Imbalance on Your Charts
You do not need expensive software to see imbalance. You can see it with your eyes if you know what to look for.
Here are the visual clues:
1. Look for Long, Solid Candles
Normal candles have wicks on the top and bottom. They are average in size.
Imbalance candles are different. They are long. They have very small wicks or no wicks at all. They show that price moved in one direction with a lot of force.

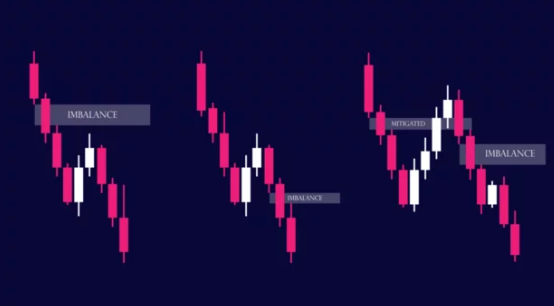
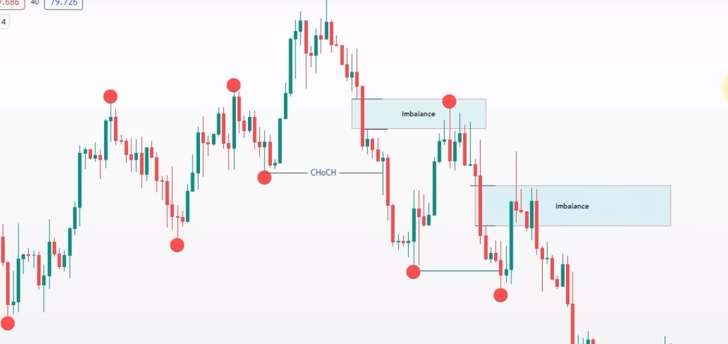
2. Find the “Fair Value Gap” (FVG)
What is a Fair Value Gap (FVG)?
A Fair Value Gap (FVG) is a specific type of imbalance.
It appears as a 3-candle pattern:
- First candle
- Strong impulse candle
- Third candle
👉 The gap between the first and third candle = imbalance zone
This is where:
👉 Institutions left unfilled orders
This is the specific technical term many traders use. To find a Fair Value Gap, look at a sequence of three candles.
- Candle 1: The last normal candle before the move.
- Candle 2: The huge, long imbalance candle.
- Candle 3: The candle after the move.
Now, look at the space between the high of Candle 1 and the low of Candle 3 (if the move was up).
If the wicks of Candle 1 and Candle 3 do not touch or overlap, the space in the middle is the Imbalance or Fair Value Gap.
This empty space is your trading zone.
How to Identify an Imbalance (FVG)
Look for:
✅ Strong impulsive move
✅ Large candle body
✅ Gap between wicks
👉 The cleaner the move, the stronger the imbalance
Why Market Imbalance Works (Smart Money Logic)
This is where most traders miss the point.
Markets don’t move cleanly because:
- Institutions execute large orders in stages
- Not all orders get filled instantly
So what happens?
👉 Price comes back to “rebalance” the market
That’s why:
👉 Imbalances act like magnets for price
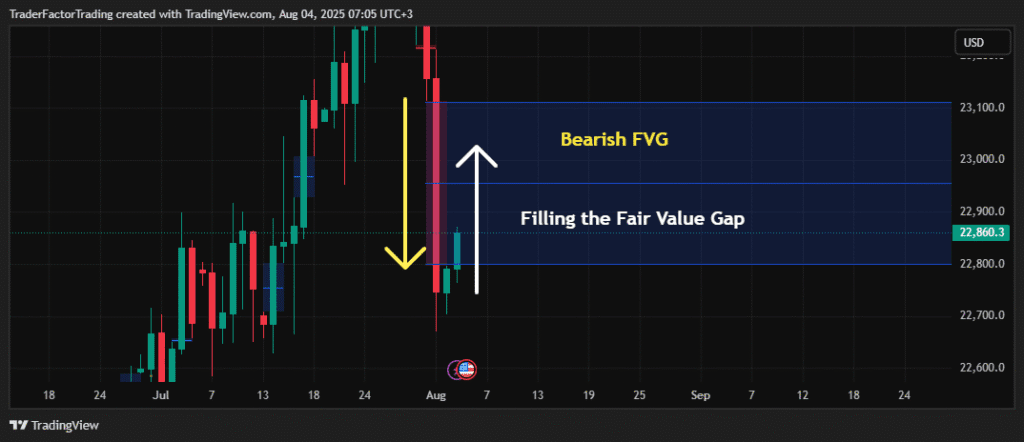
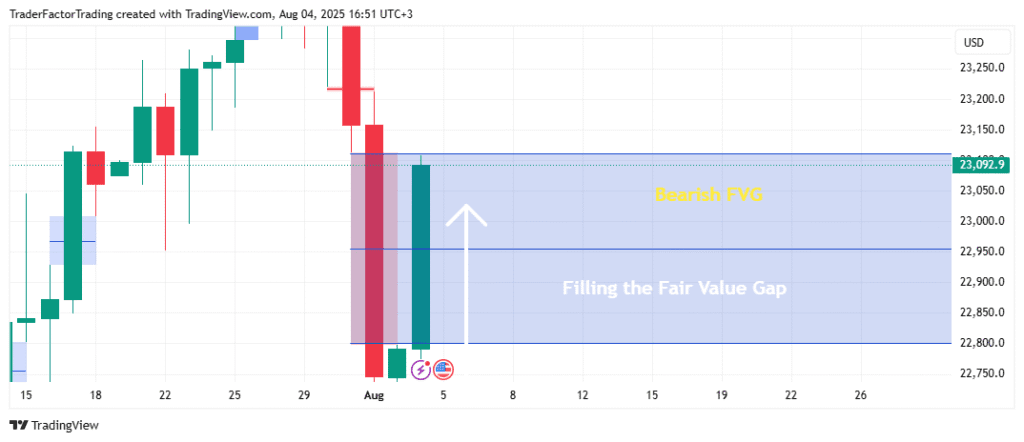
Will Price Always “Fill” the Imbalance?
This is the most common question traders ask.
The short answer: Usually, yes. But not always immediately.
The market acts like a magnet. When there is an imbalance, price often wants to return to that area. It wants to “fill” the gap to ensure that orders are matched fairly. This is called a “rebalance.”

However, you must be careful.
- Sometimes it fills quickly: The price might shoot up, pause for an hour, and then drop right back down to test the gap.
- Sometimes it takes days: If the trend is very strong, price might keep going for a long time before it finally comes back to fill the imbalance.
Do not blindly trade every gap you see. You need a plan.
Forex imbalance chart analysis
Market imbalance, also known as supply and demand imbalance, is a situation in the forex market where the number of buyers and sellers is unequal, creating an opportunity for traders.
Market Imbalance Example
Let’s take the EUR/USD pair as an example. You, as a trader, are constantly analyzing charts to identify areas where significant buying or selling has occurred – these are your demand (support) and supply (resistance) zones respectively.
If you notice that at a certain price level, say 1.2000, the EUR/USD pair has consistently fallen in the past, this level is considered a supply zone. It means that at this level, there’s an excess of supply (sellers) over demand (buyers) causing the price to fall.
Conversely, if at a price level of 1.1000, the EUR/USD pair has historically risen, this level becomes a demand zone. This suggests that at this price, there’s more demand (buyers) than supply (sellers), pushing the price up.
Imbalance vs. Liquidity: What’s the Difference?
These two terms confuse many beginners. They are related, but they are not the same thing.
| Concept | Definition | Visual |
|---|---|---|
| Imbalance (FVG) | A gap caused by fast price movement | Empty space between candles |
| Liquidity | Resting orders (stop losses, limit orders) | Above old highs, below old lows |
How to use them together:
Smart traders look for price to grab liquidity (hit stops) and then create an imbalance in the opposite direction. This is a very high-probability setup.
How to Trade Forex Imbalance (Step-by-Step)
Now that you know what it looks like, how do you make money from it?
You should not chase the big candle. That is how traders lose money. Instead, you trade the return to the imbalance.

Here is a simple 6-step strategy.
Step 1: Identify Market Structure
Look for:
- Uptrend (higher highs, higher lows)
- Downtrend (lower highs, lower lows)
Step 2: Spot the Imbalance (FVG)
Find:
- Strong impulsive candle
- Clear gap
Scan your charts. Look for those big, explosive moves. Draw a rectangle box around the gap between Candle 1 and Candle 3. Extend that rectangle to the right side of your chart. This is now your “Zone of Interest.”
Step 3: Wait for Retracement
This takes patience. The big move happened, and the price is far away. Do not click buy yet. Wait for the price to curve back around and touch your rectangle.
Remember, the market breathes. It breathes out (the big move) and breathes in (the retracement). You are waiting for the breath in.
Step 4: Look for Rejection
When price enters your imbalance zone, watch carefully. Does it slow down?

You want to see signs that the price is respecting this zone. Look for:
- Price touching the zone and bouncing.
- Wicks rejecting the level.
- A shift in momentum on a smaller timeframe (like the 5-minute or 15-minute chart).
If the price smashes through your zone without stopping, the setup is invalid. Cancel the trade.
Step 5: Enter the Trade
Entry: Inside the FVG Stop loss: Below/above structure Target: Previous highs/lows
If price respects the zone, enter your trade in the direction of the original big move.
- If the imbalance was a big move UP: You are looking to BUY when price drops back into the gap.
- If the imbalance was a big move DOWN: You are looking to SELL when price rises back into the gap.
Where to put your Stop Loss?
Place your stop loss just outside the imbalance zone or behind the low/high of the original move. This keeps your risk managed.
Advanced Imbalance Strategy (Pro Level)
If you want to move from beginner to advanced trading, understanding imbalance alone is not enough.
👉 The real edge comes from confluence.
Professional traders don’t rely on one concept—they combine multiple signals to increase probability.
Here’s how to turn a simple Fair Value Gap into a high-probability setup:
1. Break of Structure (BOS) – Confirm the Direction
Before trading any imbalance, you must first confirm the market direction.
A Break of Structure (BOS) occurs when price breaks a previous high (bullish) or low (bearish), signaling a potential shift in trend.
✅ How to use it:
- Wait for price to break a key level
- Confirm momentum in that direction
- THEN look for imbalance entries
👉 This prevents you from trading against the trend.
💡 Example:
- Market breaks previous high → bullish BOS
- Price pulls back into a bullish FVG
- Entry = higher probability
👉 Without BOS, you’re just guessing.
2. Liquidity Sweeps – Where Smart Money Enters
Before price moves in the intended direction, it often does one thing first:
👉 Takes out liquidity
Liquidity = stop losses from retail traders.
This is closely tied to Market Liquidity
What to look for:
- Equal highs (buy-side liquidity)
- Equal lows (sell-side liquidity)
- Previous swing highs/lows
✅ Strategy:
- Price sweeps liquidity (fake breakout)
- Reverses direction
- Returns to imbalance (FVG)
- Entry opportunity
👉 This is where smart money traps traders.
3. Trend Alignment – Trade With the Market
One of the biggest mistakes traders make:
👉 Trading imbalance against the trend
✅ Rule:
- Only trade bullish FVGs in an uptrend
- Only trade bearish FVGs in a downtrend
- How to define trend:
- Higher highs & higher lows = uptrend
- Lower highs & lower lows = downtrend
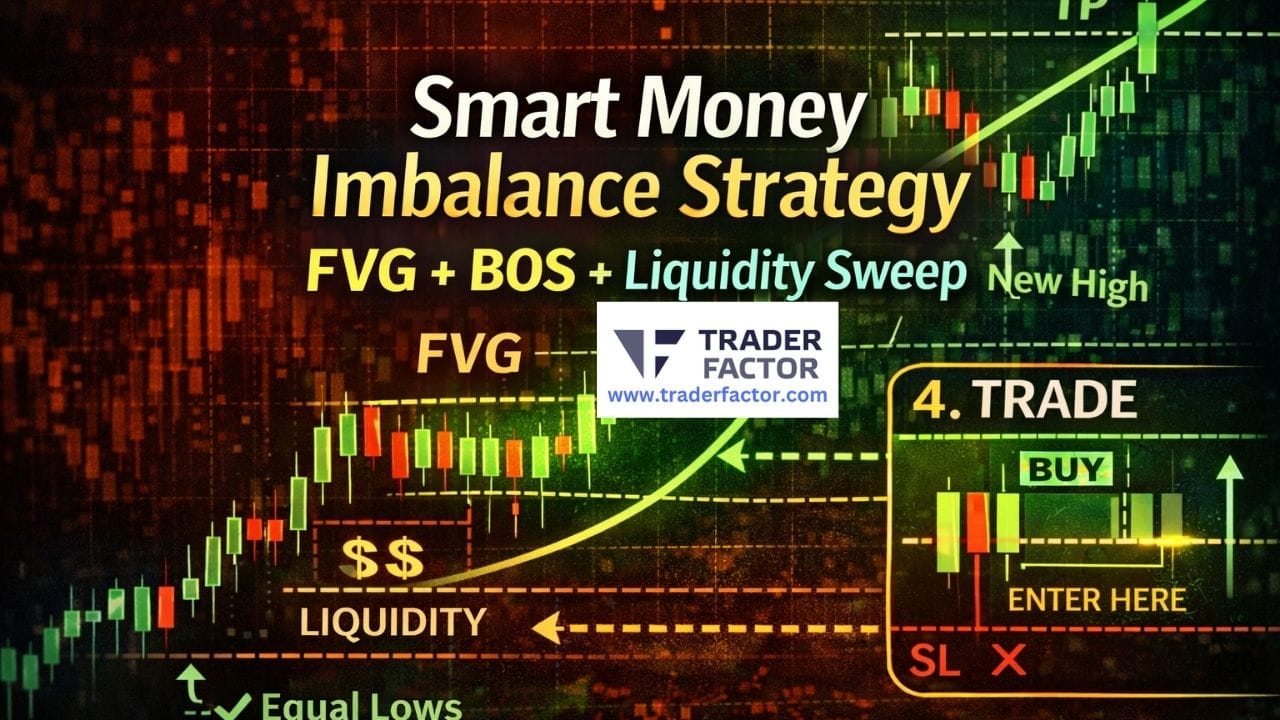
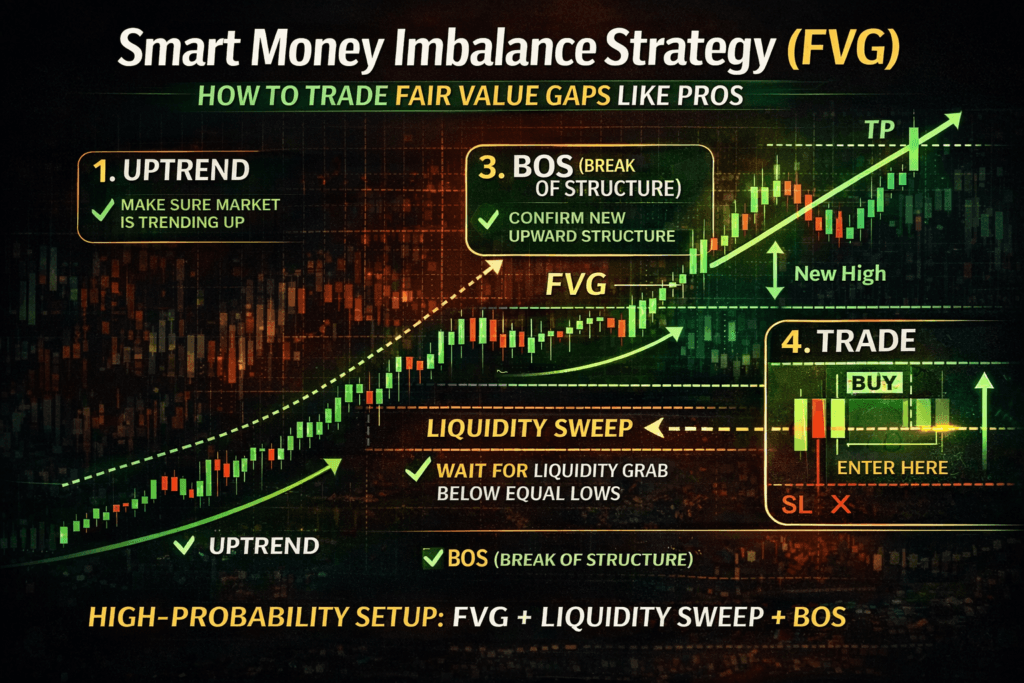
4. The Complete Imbalance Setup (Step-by-Step)
This is where everything comes together:
🔥 High-Probability Setup:
- Market forms a trend (up or down)
- Liquidity gets taken (stop hunt)
- Break of Structure confirms direction
- Price creates an imbalance (FVG)
- Price retraces into the FVG
- Entry at the imbalance zone
Entry Model (Clean Execution)
🟢 Bullish Setup:
- Liquidity sweep below lows
- Bullish BOS
- Price returns to bullish FVG
- Buy entry
🔴 Bearish Setup:
- Liquidity sweep above highs
- Bearish BOS
- Price returns to bearish FVG
- Sell entry
5. Timing Matters (Advanced Insight)
Not all imbalances are equal.
The best setups occur during:
- London session
- New York session
- Major news volatility
👉 These are periods of high institutional activity
6. Why This Strategy Works
This approach works because it follows how institutions operate:
- They create liquidity
- They manipulate price
- They fill orders at imbalance zones
👉 You’re not predicting the market…
👉 You’re following smart money behavior
Best Timeframes for Imbalance Trading
- HTF (H1–Daily): Identify structure
- LTF (M5–M15): Refine entries
How to Trade Forex Imbalance with Currency Pairs
Once these supply and demand zones are identified, you wait for the price to return to these levels.
If the price of the EUR/USD pair approaches the supply zone (1.2000), you would look to sell, expecting that there will be an excess of sellers which will drive the price down. Conversely, if the price approaches the demand zone (1.1000), you would look to buy, predicting that an excess of buyers will push the price up.
Managing Risk with Stop Loss and Profit Targets
As with any trading strategy, it’s important to manage risk by setting stop loss levels and profit targets. A stop loss is typically set just outside the supply or demand zone – if the price breaks through this level, it suggests that the imbalance may be shifting.

For instance, if you’ve sold at the supply zone (1.2000), you might place a stop loss at 1.2050. This means if the price goes against your prediction and starts to rise, your trade will automatically close at 1.2050, limiting your loss.
A profit target is set based on your assessment of potential price movement. For example, if you’ve bought at the demand zone (1.1000), you might set a profit target at 1.1500. If the price reaches this level, your trade will close, securing your profit.
How Imbalances of Forex Affect the Market
Market and global imbalances drive volatility in the Forex market. Understanding how they impact the global economy, investors, and central banks is crucial for traders looking to make informed decisions.
By staying up-to-date on market news and trends, traders can navigate these global imbalances and succeed in Forex trading.

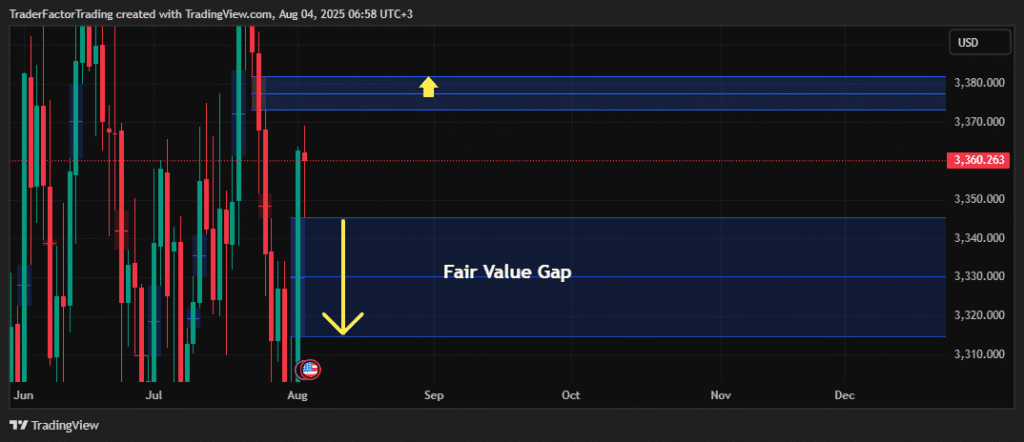
In the image, the Fair Value Gap (FVG) is represented by the imbalance created by the second candle, which is a long green candle with no wick at the bottom and a small wick at the top. This strong, one-sided bullish move leaves a gap between the wick of the first candle and the body of the second candle, indicating unfilled buy orders. Traders may anticipate that the price could revisit this gap to “fill” the inefficiency before resuming the uptrend.
Changes in Exchange Rates
Market imbalances often lead to changes in exchange rates that can have far-reaching effects on the economy and monetary policy. For example, a sudden increase in the value of a particular foreign currency may cause its exports to become more expensive. This, in turn, may decrease the demand for such exports, leading to a trade deficit.
Conversely, a decrease in the value of another foreign or domestic currency can make exports from many countries cheaper, thereby boosting the global economy and currency prices.
Shifts in Market Sentiments
Market imbalances can also bring about shifts in emerging market sentiments. Investor confidence plays a critical role in the Forex of emerging market currencies. In certain time frames such as during uncertainty, investors tend to flock towards safe-haven currencies like the US dollar, while riskier currencies, like emerging market currencies, fall out of favour.

These shifts in sentiment can create significant volatility in the foreign exchange of emerging markets, leading to wild swings in the exchange rates and interest rates.
Central Bank Intervention
Central banks use various tools to manage their currency’s value, such as setting interest rates or buying and selling currencies in the market. When central banks intervene, economists say they can affect the economy, investor sentiment and outlook toward other countries’ economies and influence exchange rates. For example, economists say if the Federal Reserve raises interest rates, inflation may please foreign investors and cause the US dollar to appreciate relative to other currencies.
Economic Impacts
Market imbalances can have significant economic impacts beyond the Forex market. Changes in exchange rate rates and global imbalances between currencies, countries and economies can lead to inflation or deflation, affecting the purchasing power of consumers. Trade imbalances between an economy country or countries can also create economic distortions, such as when a country or economy imports more than it exports, leading to a trade deficit.
Types of Imbalances in Forex
The world Forex and other external assets, debt and credit market is constantly in flux, with exchange rates and demand for foreign currencies and other external assets and debt also continually changing. Several global imbalances also can occur in various countries, the euro debt and dollar debt market, each having distinct impacts on world foreign currency and external debt and credit trading.
Order Imbalances
Order imbalances occur when a significant difference exists between the number of buy and sell orders for a particular currency pair. These imbalances can cause price disruptions that trigger chain reactions, resulting in sudden price movements. For example, if there are more buy orders than sell orders for a currency pair, it could increase its value.
Supply/Demand Imbalances
Supply/demand imbalances occur in economies when there is an excess supply of domestic currency or demand for a particular currency pair. These imbalances can result in significant price movements in domestic currency, potentially leading to inflation and increased market volatility. For example, a weaker dollar and a high demand for dollars or a weak euro in a currency pair could lead to a weaker dollar or an increase in its value.
Liquidity Imbalances
Liquidity imbalances occur when there is insufficient trading volume for a particular currency pair. Low trading volume can lead to wider bid-ask spreads, which increases transaction costs. This can create challenges for traders looking to enter or exit a position in that currency pair. For example, liquidity imbalances can occur during holidays or weekends when trading activity is low.

Information forex market Imbalance
Information imbalances occur when one party has access to more information than others. This information can be used to make informed trading decisions ahead of other market participants, leading to increased volatility in the market.
For example, suppose a central bank announces an unexpected change in its interest rate or rates. In that case, market participants who have access to that information can use it to their advantage by entering or exiting trades before others.
Strategies to Navigate and Maximize Forex Imbalances
Traders and investors can use several strategies to navigate market imbalances. One approach is to implement stop-loss orders, which can limit potential losses in case of sudden price movements.
Technical analysis can also help traders identify patterns in the market that can inform their trading decisions. Monitoring market news and events can also help traders stay informed about factors that may impact the Forex market.
How to Identify Imbalance in Forex
Identifying imbalances in the Forex market is crucial for traders looking to make informed decisions. By understanding market movements and patterns, traders can take advantage of imbalances in the market to maximize their gains.
Price Action Analysis
Price action analysis involves studying and using historical price movement patterns to predict future price movements. This technique analyses candlestick charts, support and resistance levels, and chart patterns. Traders can use price action analysis to identify trends, reversals, and breakouts, which can provide insights into potential imbalances in the market.
In your trading strategies, use imbalances to gauge potential entry and exit points. If you spot a bullish imbalance, where there are more buyers than sellers, consider it a green light for going long, but only if other indicators support this move. Conversely, a bearish imbalance suggests it might be time to sell.
Risk management is essential when trading on imbalances. These areas can offer significant opportunities, but they’re also fraught with the risk of sudden reversals if market sentiment shifts. Always set stop-loss orders to protect yourself from unexpected movements.
Volume Analysis
Volume analysis involves studying trading volume data to identify imbalances in the market. High trading volume indicates strong market sentiment and increased buying or selling pressure. Traders can use volume analysis to identify potential trend reversals, breakouts, and trading opportunities.
Low trading volume can also indicate liquidity imbalances, which can lead to wider bid-ask spreads and increased transaction costs.
Order Book Analysis
Order book analysis involves studying outstanding orders for a particular currency pair. This technique provides a real-time view of supply and demand imbalances in the market.

Traders can use order book analysis to identify potential price levels where large orders are present, which can act as support or resistance levels. By monitoring order book imbalances, traders can make informed decisions and take advantage of market movements.
News Analysis
News analysis involves monitoring the latest news and events that may impact the Forex market. Economic releases, geopolitical events, and central bank announcements can significantly impact foreign exchange rates and investor sentiment.
By staying up-to-date on market news and events, traders can anticipate potential imbalances in the foreign exchange market and adjust their trading strategies accordingly.
Trading Strategies That Take Advantage of Forex Market Imbalances
Forex imbalances occur in the global financial crisis and markets when there is a significant difference between the number of buys and sell orders for a one-dollar or particular currency pair, resulting in higher price disruptions, financial instability and volatility in the market.
Order Flow Trading
By closely examining the foreign exchange imbalance using capital flows using world financial markets and monitoring the current account balance, trade and buying and selling behaviour of foreign currencies in almost all countries and market participants, you can spot potential market imbalances.
With careful analysis of order book, capital flows, current account balance and volume data, you can pinpoint areas of liquidity disparities between economies and countries.
Armed with this valuable information, you can strategically enter trades in the direction of the imbalance, capitalizing on potential price fluctuations.
Imagine the opportunities when you identify a significant order imbalance on the currency side, with more buy orders than sell orders. This insight could lead to a profitable long position on the trade of a currency pair, anticipating a price rise or surge.
Advantages
- Can provide insights into potential market movements
- It can be used in conjunction with other trading strategies
Disadvantages
- Requires advanced knowledge of order book analysis
- It may not be suitable for all traders due to its complexity
News Trading
News trading involves monitoring economic releases, geopolitical events, financial instability, monetary policy, financial markets and central bank announcements to anticipate potential market movements.
This advanced Imbalance trading strategy involves scrutinizing how news events, monetary policy and financial markets may affect the Forex market and making precise trades based on that analysis.
Picture this: a promising economic release for the dollar suggests an outlook for robust dollar growth – seize the opportunity by using dollars and going long on the currency in dollar question, anticipating a dollar rise and a surge in dollar inflation, imports and dollar demand.
Advantages
- Can provide opportunities for high-profit trades
- It can be used in conjunction with other trading strategies
Disadvantages
- Requires quick reactions to breaking news
- This can lead to increased volatility and risk in the market
Mean Reversion Trading
In simple terms, a forex market imbalance occurs when there is an excess of demand or supply for a particular currency pair. Simple mean reversion trading involves identifying currency pairs that have deviated from their long-term average and entering trades in the opposite direction, anticipating a price correction.
By analyzing technical indicators, this strategy helps identify opportunities when a currency pair is either overbought or oversold. When a pair becomes overbought, you can enter a short position, taking advantage of predicting a potential price correction.
Advantages
- Can provide opportunities for high-profit trades
- It can be used in conjunction with other trading strategies
Disadvantages
- Requires advanced knowledge of technical analysis
- It may not be suitable for all traders due to its complexity

Breakout Trading
Breakout trading involves identifying key support and resistance levels in the market and entering trades when these levels are broken. Here, it would help if you analyzed price action patterns to identify potential breakout points.
For example, a currency pair has been trading weak or within a range for a while. When the upper resistance level or higher price finally breaks, a trader could seize the moment and enter a long position, expecting a surge in demand for that particular currency pair.
Advantages
- Can provide opportunities for high-profit trades
- It can be used in conjunction with other trading strategies
Disadvantages
- It may require patience to wait for breakout points to occur
- This can lead to increased volatility and risk in the market
Scalping
Scalping involves entering and exiting trades quickly to take advantage of short-term price movements in the market. By analyzing charts and identifying potential imbalances, you can enter and exit trades quickly, all while minimizing risk with tight stop-loss orders.
For example, if there is a sudden price spike or fall in the balance of a currency pair, a trader may enter a short-term trade in the direction of the imbalance, taking profit after a small price movement.
Advantages
- Can provide opportunities for high-frequency trading
- It can be used in conjunction with other trading strategies
Disadvantages
- Requires quick reactions and advanced knowledge of technical analysis
- It may not be suitable for all traders due to its risks and complexities
Tools and Indicators for Forex Market Imbalance
To make the most of Forex market imbalance opportunities, traders need the right tools and indicators. These resources help identify imbalances quickly and accurately, giving traders a better edge in their strategies.
Best Indicators for Forex Market Imbalance
Indicators play a critical role in analyzing Forex market imbalance, highlighting areas where buying or selling pressure overtakes the market. Some of the top indicators include the Relative Strength Index (RSI), Volume Weighted Average Price (VWAP), and candlestick patterns. RSI helps you spot overbought or oversold conditions caused by imbalances, while VWAP reveals average pricing during high-volume periods. Additionally, candlestick patterns like marubozu or engulfing candles often signal strong momentum, which can indicate an imbalance.
Tools to Detect Forex Market Imbalance
Many tools are available to help traders detect Forex market imbalance effectively. One of the most popular is order flow analysis, which lets you see real-time trade activity, revealing large institutional orders. Charting platforms like TradingView, MetaTrader 4, and 5 also offer customizable features like custom scripts or plugins to highlight zones of imbalance. Heatmaps are another useful tool, showing liquidity patterns and pinpointing areas where supply and demand quickly shift.

How to Use Volume Profile for Forex Market Imbalance
The volume profile is an essential tool for identifying market imbalances by showing where trading activity is concentrated. This indicator plots volume across different price levels, highlighting “high-volume nodes” (areas with equilibrium) and “low-volume nodes” (potential imbalance zones). For instance, you can analyze a price range using the volume profile and spot a sharp drop in volume, which is often associated with imbalance. By focusing on these zones, you can identify high-probability areas for entries or exits.
Practical tip: Look for price returning to these low-volume nodes as they often act as magnets, providing potential trading setups when buyers or sellers rebalance their trades.

Forex Market Imbalance Scanner Software
Forex market imbalance scanners can save time by automatically identifying gaps, strong candlestick movements, or high-volume areas. These software tools scan for predefined criteria, like sudden price movements or untested zones, giving traders an efficient way to spot opportunities. Forex market imbalance examples such scanners include Sierra Chart’s Market Depth tools, NinjaTrader’s Order Flow suite, or advanced liquidity heatmaps from specialist platforms.
Using imbalance scanners, traders can stay one step ahead by receiving alerts when specific imbalance zones occur. For instance, if a scanner picks up a rapid move during a news event, it can help you act quickly on potential retracements or breaks.
Risks Associated With Trading Forex Imbalances
Forex imbalances occur when a significant difference exists between the number of buy and sell orders for a particular currency pair. These imbalances can cause price disruptions and volatility in the market, leading to risks for traders. Traders need to be able to identify potential imbalances before making trades.
Market Volatility
Market volatility is a significant risk associated with currencies in many countries with forex imbalances. Imbalances can lead to sudden price movements and increased volatility in the market. Traders must be prepared for the potential risks of market volatility and ensure they have appropriate risk management strategies.
These include; implementing stop-loss orders, setting profit targets, and using appropriate position sizing to manage market volatility.
Liquidity Risk
Liquidity risk is another potential risk that traders need to be aware of when trading forex imbalances. Imbalances can lead to liquidity issues in the market, resulting in wider bid-ask spreads and increased transaction costs. Traders should consider liquidity risk and ensure they have adequate capital to enter and exit trades. You can also monitor bid-ask spreads to ensure they are not excessively wide.
Counterparty Risk
Counterparty risk refers to the risk that a counterparty may default on a transaction. This risk is particularly relevant for over-the-counter (OTC) transactions, which are not traded on an exchange. Traders should carefully consider the creditworthiness of their counterparties and ensure they have appropriate risk management strategies in place. Also, ensure you have appropriate insurance or collateral in place.

Regulatory Risk
Regulatory risk refers to the risk of regulatory changes that may impact the forex market. Traders must stay up-to-date with regulatory developments and comply with all applicable regulations. Also, seek legal advice when necessary.
Technology Risk
Technology risk refers to the risk of technological failures or cyber-attacks that may impact trading platforms or systems. Traders should ensure they have appropriate security measures to protect their trading accounts and systems. This includes using two-factor authentication and regularly updating passwords.
Forex Market Imbalance VS. Price Inefficiencies
Forex imbalance and price inefficiency are two distinct concepts in the realm of Forex trading, but they are interconnected.
Forex imbalance refers to a situation where the number of buyers and sellers in the market is unequal. For instance, a bullish imbalance occurs when there are more buyers than sellers, which can drive prices up. Conversely, a bearish imbalance is when there are more sellers than buyers, pushing prices down.
On the other hand, price inefficiency refers to situations where the current price of a currency does not reflect all available information[^6^]. These inefficiencies can occur due to various factors such as delays in disseminating information, irrational behavior of market participants, or gaps in price and full body candles.

The connection between these two concepts is that imbalances in the Forex market can lead to price inefficiencies. For example, a sudden surge of buying orders (creating an imbalance) can result in the price quickly increasing beyond its intrinsic value, creating a temporary price inefficiency. Traders who identify these inefficiencies can potentially profit by trading on them before the market corrects itself and the price returns to its efficient level.
However, it’s important to note that both imbalances and inefficiencies can be challenging to identify and trade on due to the dynamic and unpredictable nature of the Forex market. Therefore, these strategies should be used with caution and appropriate risk management measures.

Forex Imbalance Strategy
The Forex Imbalance Strategy revolves around understanding areas in the market where supply and demand are disproportionate, often creating opportunities for traders. To grasp how to identify imbalance in forex, traders analyze sharp price movements, often visible as candlesticks with minimal overlap, signaling an influx of buyers or sellers. Such imbalances typically indicate institutional activity, making them key zones of interest. If you are exploring how to trade imbalance in forex, it involves waiting for price to revisit these imbalanced zones, often setting up trades in the direction of the original momentum. The imbalance forex strategy remains a valuable approach for identifying high-probability setups in volatile market conditions.
Imbalance vs. Liquidity: What is the Difference?
These two terms confuse many beginners. They are related, but they are not the same thing.
Imbalance is about speed and inefficiency. It is a gap left behind because price moved too fast. It is a vacuum that draws price back.

Liquidity is about resting orders. It is where money is sitting. Liquidity is usually found above old highs or below old lows where traders have placed their stop losses.
How to use them together:
Smart traders look for price to grab liquidity (hit stops) and then create an imbalance in the opposite direction. This is a very high-probability setup.
Common Mistakes to Avoid
Trading imbalance is effective, but you can still make mistakes. Here are the traps to avoid.
1. Trading Against a Strong Trend
If the news is very bad for the Dollar, the price might drop creating huge imbalances. If you try to buy just because you see a gap, you are trying to catch a falling knife. Always check the overall trend.
2. Entering Too Early
Do not place a “limit order” blindly at the imbalance zone. Wait for confirmation. Sometimes price will dip into the zone a little bit. Sometimes it will go all the way to the other side of the zone. If you enter too early, you might get stopped out before the move happens.

3. Ignoring Timeframes
Imbalance exists on all timeframes. You can see it on the 1-minute chart and the Monthly chart.
However, imbalances on higher timeframes (like the 4-Hour or Daily chart) are much stronger and more reliable than those on the 1-minute chart. If you are a beginner, stick to the 1-Hour or 4-Hour charts.
Summary: Why You Should Trust Imbalance
Using market imbalance helps you stop gambling and start trading.
When you chase a green candle, you are gambling that it will keep going. When you wait for an imbalance fill, you are trading based on market mechanics.
Let’s recap the key points:
- Imbalance is a gap caused by aggressive institutional buying or selling.
- Price usually returns to fill this gap.
- Draw a box around the Fair Value Gap.
- Wait for price to return to the box.
- Enter in the direction of the original move.
Start looking at your charts today. Go back in history. You will be amazed at how often price returns to fill these gaps exactly to the pip before continuing its trend. Once you see it, you cannot unsee it.
Frequently Asked Questions About Forex Market Imbalance
What Is Forex Market Imbalance?
The forex market is a decentralized global marketplace where currencies are traded 24/7. The exchange of currencies takes place among various financial institutions, governments, corporations, and individuals worldwide.
How to Identify Imbalance in Forex?
In the forex market, imbalances occur when there is an excess of buy or sell orders for one dollar a euro a dollar, one dollar to euro a dollar, or dollar to one dollar, euro a dollar or euro a dollar particular currency pair. This overbalance leads to price fluctuations and volatility in the market.
What Are The Causes of Forex Market Imbalance?
Several factors can cause forex market imbalances. These factors include changes in economic conditions, political events, central bank policies, and various interest rate put rates and interest rate call differentials. Other factors contributing to imbalances include technical trading patterns, news releases, and order flow imbalances.
What Is The Impact of Forex Market Imbalance on Trading?
Forex market imbalances can present trading opportunities for traders looking to make profitable trades. Traders can take advantage of imbalances by entering trades in the direction of the imbalance and making profits as the market corrects itself. However, investing and trading with imbalances also come with risks, including increased volatility and liquidity risk. Therefore, traders need to be aware of the risks associated with investing and trading forex market imbalances and implement sound risk management practices.

What Are The Key Indicators of Forex Market Imbalance?
Traders and economists can identify potential forex market imbalances by analyzing technical indicators, prices, trading volumes, emerging market currencies, and order books. A good platform for this is TradingView or the Forex Factory. Some common indicators of a potential emerging market forex market imbalance include sudden price movements, increased trading volumes, and unusual spikes in market depth.
What Are The Benefits of Trading with Forex Market Imbalance?
Trading with forex market imbalances can allow traders to make profitable trades. By identifying potential imbalances and entering trades in the direction of the foreign exchange market imbalance, exchange rate or market imbalance, or the foreign currency such as Japanese yen or South Korean currency. Traders can take advantage of potential price movements and profit from their own currency or foreign investors.
What Are The Strategies for Trading with Forex Market Imbalance?
Some strategies traders can use to trade with forex market imbalances include order flow trading, news trading, breakout trading, and mean reversion trading. These strategies involve analyzing technical indicators, news releases, and order flow imbalances to identify potential trading opportunities.
What Are Risks Associated with Forex Market Imbalance Trading?
Trading with forex market imbalances comes with increased volatility, currency risk, liquidity risk, counterparty and currency risk, regulatory risk, and technology risk. Traders should implement sound risk management practices to mitigate these risks, including setting stop-loss orders, using appropriate position sizing, and carefully vetting counterparties.

What Are The Best Practices for Trading with Forex Market Imbalance?
To trade successfully with forex market imbalances, traders should stay up-to-date with market developments, monitor technical indicators, and focus on currency prices, current account deficit and trading volumes. They also need to have a solid understanding of their own currency, time the trading session to trade and currency risk management strategies. Traders should diversify their trading strategies across currencies and not rely solely on trading with forex market imbalances.
How to use imbalance in trading?
Imbalance in trading helps identify areas where buyers or sellers dominate, signaling potential price reversals or continuations. Traders often look for imbalances to place trades in high-probability zones. This can improve entry points and risk management.
How to read a market imbalance chart?
To read a market imbalance chart, look for sharp price moves with little resistance or retracement. These areas often appear as gaps or long candlestick wicks, indicating strong buying or selling pressure. Focus on these zones to anticipate future price movement.
What is the 90% rule in Forex?
The 90% rule refers to the concept that 90% of the time, price tends to revisit an area of imbalance. This means traders can predict that gaps or untested zones of liquidity are likely to get filled eventually. It serves as a guide for taking trades based on historical price tendencies.

What is the 5-3-1 rule in Forex?
The 5-3-1 rule refers to a disciplined approach in Forex trading. It suggests focusing on 5 currency pairs, using 3 trading strategies, and committing to 1 trading session for consistency. This rule helps traders maintain clarity and reduce overtrading.
How does imbalance work?
Market imbalance works by showing points where demand or supply temporarily dominates, causing fast price movement. These imbalances result from institutional orders that disrupt market equilibrium. Identifying them can help predict potential price corrections or continuations.
How to identify market imbalance?
Market imbalance is identified by sudden price movements with minimal resistance, such as gaps, long wicks, or large candlesticks. Use indicators like volume analysis or order flow tools to confirm strong buying or selling activity. These zones often become areas of support or resistance.
What are the most common mistakes traders make when identifying Forex market imbalances?
Traders often misinterpret normal price movements as imbalances or fail to confirm them with volume or order flow analysis. Always use multiple indicators to validate your findings.
How can beginners start trading Forex market imbalances effectively?
Beginners should focus on learning the basics of supply and demand zones and practice identifying imbalances on demo accounts. Start small and gradually incorporate advanced tools like volume analysis.
What tools or software are best for spotting market imbalances?
Tools like TradingView, MetaTrader, and order flow analysis software are excellent for identifying imbalances. Look for features like volume profiles and heatmaps.
How do market imbalances differ from price inefficiencies?
Market imbalances occur due to unequal buying and selling pressure, while price inefficiencies happen when prices don’t reflect all available information. Imbalances often lead to inefficiencies.
Can market imbalances be used in other financial markets besides Forex?
Yes, market imbalances are also relevant in stock and commodity trading. The principles of supply and demand apply across all financial markets.
What are the risks of trading based on market imbalances, and how can they be mitigated?
The main risks include false signals and sudden market reversals. Mitigate these by using stop-loss orders and proper risk management strategies.
How do institutional traders use market imbalances to their advantage?
Institutional traders exploit imbalances by placing large orders that create significant price movements. Understanding their behavior can help retail traders anticipate trends.
What is the role of volume analysis in identifying market imbalances?
Volume analysis helps confirm whether price movements are driven by genuine buying or selling pressure. It’s a critical tool for validating imbalances.
How can I practice identifying market imbalances without risking real money?
Use demo trading accounts to practice spotting imbalances and testing strategies. This allows you to gain experience without financial risk.
Are there specific currency pairs where market imbalances are more common?
Major currency pairs like EUR/USD and GBP/USD often show imbalances due to high trading volumes. Focus on these pairs for better opportunities.
Conclusion
Forex market imbalances can present profitable trading opportunities for traders. However, it’s important to understand the risks associated with trading with forex market imbalances and implementing sound risk management practices. Traders must analyze technical indicators, trading volumes, and order books to identify potential imbalances and use appropriate trading strategies to exploit potential price movements. By staying informed, diversifying trading strategies, and practicing good risk management, traders can use forex market imbalances to succeed in the highly competitive market.
More Reading on TraderFactor
| Article | What You’ll Learn |
|---|---|
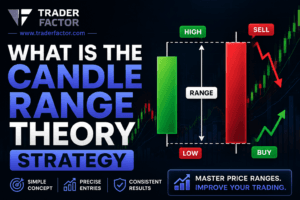
| [Candle Range Theory Strategy] | Master CRT and liquidity sweeps |
| [Support and Resistance Guide] | Key levels and how to trade them |
| [Best Timeframes for Forex Trading] | Choose the right chart for your style |
| [How to Read Candlestick Patterns] | Basics of candlestick analysis |
| [Forex Spreads vs. Commissions] | Trading costs and how to minimize them |
Creating an EffectiveForex Trading Plan
The Winning Mindset for Weekend Forex Trading
Essential Education for Taxes on Forex Trading
What is a Margin Level in Forex?
Forex Breakout Strategy: A Guide for Profitable Trading
Forex Consolidation Breakout Strategies for Traders
Master Forex Flag Pattern Strategy for Profit
About the Author
This guide was prepared by Zahari Rangelov, Head of Business Development at TraderFactor. Zahari specializes in trading strategies, market analysis, and risk management. He has over a decade of experience helping traders navigate complex financial markets.
Stay Updated
Get our latest trading guides and market analysis delivered straight to your inbox.
[Subscribe to the TraderFactor Newsletter]
Disclaimer:
All information has been prepared by TraderFactor or partners. The information does not contain a record of TraderFactor or partner’s prices or an offer of or solicitation for a transaction in any financial instrument. No representation or warranty is given as to the accuracy or completeness of this information. Any material provided does not have regard to the specific investment objective and financial situation of any person who may read it. Past performance is not a reliable indicator of future performance.