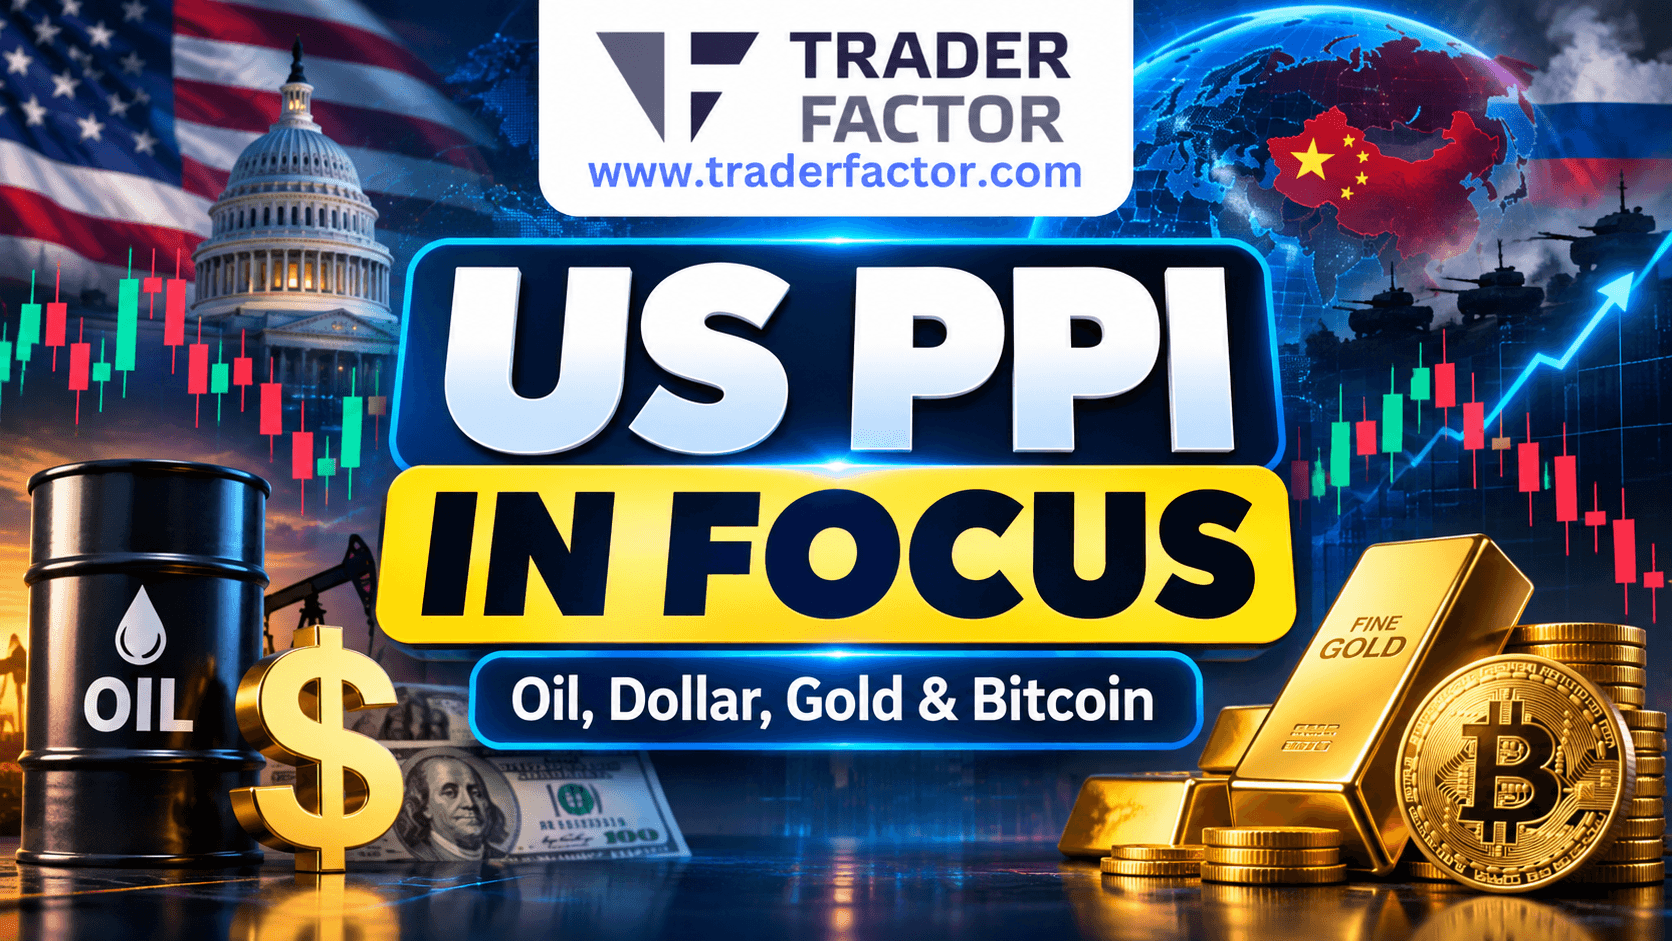

Forex Market Today: US PPI in Focus as Iran War Keeps Inflation Fears Elevated
Forex, Gold, Stocks, Crypto & Oil Market Analysis – September 10, 2026
US Producer Price Index data takes center stage in Forex Market Today as traders prepare for the first major US inflation test before Friday’s CPI report.
The Dollar remains below the psychological 99 level, while gold has recovered above $4,400 and Bitcoin remains close to $78,000.
Oil remains another major driver. Brent has traded above $100 as the US-Iran conflict and disruptions around key Middle East energy routes continue to fuel inflation concerns.
President Donald Trump has meanwhile suggested that talks with Iran could still happen and predicted that the conflict would end after the US midterm elections.
However, no ceasefire has been announced, leaving markets vulnerable to fresh geopolitical headlines.
📌 Key Takeaways
- US PPI is today’s main event:
Headline producer inflation is expected to rise around 0.4% MoM after remaining unchanged previously. - Core PPI:
Core producer inflation is expected around 0.3% MoM and approximately 4.6% YoY. - CPI comes next:
Friday’s US CPI remains the week’s biggest inflation test. - ECB decision:
Markets expect another 25-basis-point interest-rate increase today. - Dollar:
DXY remains below 99 as traders wait for inflation confirmation. - Gold:
XAU/USD has recovered around the $4,400 region ahead of PPI. - Oil:
Middle East tensions remain intense, with Brent trading above $100 and WTI elevated. - Iran war:
Trump says talks could still happen and predicts the conflict will end after the US elections. - Bitcoin:
BTC remains close to $78,000 as Fed expectations keep crypto cautious. - Stocks:
Higher oil prices and Treasury yields continue to pressure risk sentiment.
🇨🇾 Zahari Rangelov to Take the Stage at Wiki Finance Expo Cyprus 2026
TraderFactor’s Head of International BD will represent TraderFactor as a key speaker at Wiki Finance Expo Cyprus 2026.
⚡ Quick Answer
US PPI is today’s major market catalyst.
Producer inflation is expected to accelerate after remaining flat in July, potentially strengthening expectations that the Federal Reserve may raise rates at its September meeting.
At the same time, Brent oil above $100 is reinforcing inflation concerns as the Iran war continues to threaten Middle East energy supplies.
A hotter PPI could support the Dollar and Treasury yields, while softer inflation could support gold, stocks, Bitcoin and non-US currencies.
Current Market Prices
The following are approximate early-session market levels. Prices can change quickly and may differ slightly between brokers, futures contracts and data feeds.
Support and Resistance Snapshot
| Asset | Current Price | Support | Resistance | Bias |
|---|---|---|---|---|
| DXY | 98.70 | 98.50 / 97.70 | 99.00 / 99.50 | Bearish |
| Gold | 4,400 | 4,362 / 4,344 | 4,427 / 4,491 | Neutral-Bullish |
| EUR/USD | 1.1635 | 1.1609 / 1.1579 | 1.1698 / 1.1786 | Mild Bullish |
| GBP/USD | 1.3540 | 1.3472 / 1.3444 | 1.3600 / 1.3672 | Bullish |
| NZD/USD | 0.5845 | 0.5843 / 0.5820 | 0.5906 / 0.5950 | Neutral |
| AUD/USD | 0.7215 | 0.7165 / 0.7080 | 0.7250 / 0.7300 | Neutral-Bullish |
| USD/CAD | 1.3800 | 1.3750 / 1.3640 | 1.3820 / 1.3920 | Neutral |
| USD/JPY | 153.50 | 153.00 / 152.00 | 155.20 / 155.30 | Bearish |
| USD/CHF | 0.8080 | 0.8077 / 0.8028 | 0.8107 / 0.8156 | Neutral |
| BTC/USD | 78,200 | 77,500 / 75,200 | 80,000 / 82,000 | Neutral |
| WTI | 93.90 | 93.00 / 91.70 | 95.00 / 98.50 | Bullish |
| NAS100 | 29,473 | 29,200 / 29,000 | 29,700 / 30,000 | Neutral |
| US30 | 52,535 | 52,000 / 51,500 | 53,000 / 53,500 | Neutral-Bearish |
| S&P 500 | 7,655 | 7,600 / 7,500 | 7,700 / 7,800 | Neutral-Bearish |
Market Analysis
Currencies / Forex
US Dollar Index – DXY
The US Dollar Index remains below 99 as traders hesitate to build large positions before today’s Producer Price Index report.
Strong August employment data continues to support the possibility of another Federal Reserve rate hike. However, the Dollar has struggled to translate those expectations into a sustained rally.
PPI could change that.
A hotter producer inflation number could push Treasury yields higher and revive demand for the Greenback ahead of Friday’s CPI.
DXY remains vulnerable while below approximately 99.00–99.50. Support around 98.50 is important, with a deeper break potentially exposing the 97.70 region.
EUR/USD
EUR/USD trades around 1.1635 ahead of an unusually important session for the Euro.
The European Central Bank announces its monetary-policy decision today, with markets expecting another 25-basis-point increase.
At the same time, US PPI could significantly influence the Dollar side of the pair.
This creates the possibility of two separate volatility events in EUR/USD within a relatively short period.
Support sits around 1.1609 followed by 1.1579. Resistance remains around 1.1698, with a break potentially exposing the wider 1.1780 region.
GBP/USD
GBP/USD trades around 1.3540 and remains relatively constructive after extending its recent recovery.
Sterling is benefiting from a softer Dollar, although rising oil prices remain a potential problem for the UK inflation outlook.
The pair must also navigate today’s US PPI before Friday brings both UK GDP and US CPI.
Initial support sits around 1.3472–1.3469. Resistance begins near 1.3600, followed by approximately 1.3672.
NZD/USD
NZD/USD trades around 0.5845.
The Kiwi is receiving some support from the softer US Dollar, but risk appetite remains fragile because of the Middle East conflict and high energy prices.
The pair remains close to the 100-day moving average around 0.5843.
Failure to defend this region could expose 0.5820. On the upside, approximately 0.5906 remains an important resistance level.
AUD/USD
AUD/USD trades around 0.7215.
Expectations that the Reserve Bank of Australia may need to remain relatively hawkish continue to support the Australian Dollar.
However, elevated oil prices and geopolitical risk are limiting enthusiasm for risk-sensitive currencies.
Support sits around 0.7165, while 0.7250 is the first important upside hurdle. A break above that region would bring 0.7300 into focus.
USD/CAD
USD/CAD remains close to 1.3800.
The Canadian Dollar continues to receive fundamental support from high crude prices because Canada is a major oil exporter.
However, Fed rate-hike expectations and geopolitical demand for the US Dollar are preventing USD/CAD from falling aggressively.
This leaves 1.3800 as an important battleground.
Resistance sits around 1.3820 followed by 1.3920. Support is found around 1.3750 before the wider 1.3640 region.
USD/JPY
USD/JPY trades around 153.50 and remains close to seven-month lows.
The Japanese Yen continues to benefit from aggressive expectations that the Bank of Japan will raise rates at its September meeting.
US PPI provides today’s main risk from the Dollar side.
A hot inflation reading could trigger a USD/JPY rebound, but the broader technical structure remains weak while price stays below approximately 155.20–155.30.
A break below 153.00 could expose the 152.00 region.
USD/CHF
USD/CHF remains around 0.8080 as the Swiss Franc benefits from broad Dollar softness and cautious market sentiment.
The pair is less directional than USD/JPY but remains highly sensitive to changes in Treasury yields and Federal Reserve expectations.
Support sits around 0.8077 followed by 0.8028.
Resistance appears around 0.8107 and 0.8156.
Gold
XAU/USD
Gold has recovered around the $4,400 region as the US Dollar remains relatively soft ahead of inflation data.
Geopolitical uncertainty is also providing safe-haven demand.
However, the same Middle East tensions that support gold are pushing oil prices higher. That increases inflation fears and may encourage the Federal Reserve to remain hawkish.
Gold therefore remains caught between safe-haven demand and higher interest-rate expectations.
Immediate resistance sits around $4,425–$4,427. A sustained break could expose approximately $4,490–$4,500.
Support sits around $4,362–$4,344.
Oil
WTI Crude Oil
WTI remains elevated around the mid-$90 region depending on the contract and pricing feed, while Brent has traded above the psychologically important $100 level.
Middle East supply concerns remain the primary driver.
The US-Iran conflict, attacks involving energy infrastructure and restricted shipping around the Strait of Hormuz continue to keep a substantial geopolitical premium in crude prices.
Oil is now directly connected to today’s PPI story.
Iran War
→
Oil Prices Rise
→
Producer Costs Increase
→
Inflation Risk Rises
→
Fed Expectations Change
WTI remains constructive while above approximately $93.00 and the wider $91.70 area.
Resistance around $95 is important, followed by the $98.50 region. A sustained geopolitical escalation could eventually bring the psychological $100 WTI level into focus.
Crypto / Bitcoin
Bitcoin – BTC/USD
Bitcoin trades around $78,000–$78,300 as crypto traders remain cautious ahead of US inflation data.
BTC continues to react to changing expectations for Federal Reserve policy, Treasury yields and global liquidity.
A hotter PPI could increase rate-hike expectations and place pressure on Bitcoin.
A softer PPI could weaken the Dollar and yields, potentially allowing BTC to challenge $80,000 again.
Support sits around $77,500 followed by approximately $75,200.
Resistance remains around $80,000, followed by the wider $82,000 region.
Stocks / Equities
NASDAQ 100 – NAS100
Nasdaq 100 futures trade around 29,470 as investors wait for inflation data.
Technology shares remain particularly sensitive to Treasury yields.
A hot PPI report could reinforce expectations for tighter monetary policy, potentially pushing bond yields higher and putting pressure on growth stocks.
Support sits around 29,200 followed by 29,000.
Resistance remains near 29,700 before the major 30,000 psychological level.
Dow Jones – US30
Dow futures trade around 52,535 following another difficult session for US equities.
The index remains sensitive to higher oil prices, elevated borrowing costs and uncertainty surrounding the Federal Reserve.
Support around 52,000 is important.
Resistance sits near 53,000 followed by approximately 53,500.
S&P 500
S&P 500 futures trade around 7,655.
Investors are balancing resilient US economic activity against renewed inflation concerns.
Rising oil prices are particularly important because another energy-driven inflation wave could reduce the Federal Reserve’s flexibility.
Support sits around 7,600 followed by 7,500.
Resistance is located around 7,700 followed by 7,800.
Geopolitics: Trump Says Iran Talks Possible
The US-Iran war remains one of the biggest sources of market uncertainty.
President Donald Trump has said that talks with Iran could happen while also predicting that the conflict would end after the US midterm elections.
However, traders should distinguish political comments from an actual peace agreement.
There is currently no confirmed ceasefire, and military activity continues to create risks for regional energy infrastructure and shipping.
That uncertainty is helping keep Brent oil above $100 and Treasury yields elevated.
Any genuine diplomatic breakthrough could quickly remove part of the geopolitical premium from oil.
On the other hand, renewed attacks could send crude higher again.
⚠ What Traders Should Watch
- Any confirmation of US-Iran negotiations
- Fresh attacks on tankers or energy facilities
- Strait of Hormuz shipping conditions
- Iranian retaliation against US regional assets
- Oil’s reaction above $100 Brent
Economic Calendar – Thursday, September 10
🔥 US Producer Price Index – PPI
Today’s main event is the August US Producer Price Index.
The report is scheduled for 8:30 a.m. Eastern Time — 3:30 p.m. Kenyan time.
Producer prices measure inflation from the perspective of businesses and sellers before many costs reach consumers.
Current consensus estimates point toward:
- Headline PPI MoM: around 0.4% vs 0.0% previously
- Core PPI MoM: around 0.3% vs 0.2% previously
- Headline PPI YoY: roughly 5.2%–5.3% vs 4.7% previously
- Core PPI YoY: around 4.6% vs 4.2% previously
The expected acceleration makes today’s report particularly important.
🔥 HOTTER-THAN-EXPECTED PPI
Could increase Fed rate-hike expectations, strengthen the US Dollar and Treasury yields, while putting pressure on gold, Bitcoin and rate-sensitive equities.
⚖ PPI NEAR EXPECTATIONS
Could produce a short-lived reaction as traders quickly shift their attention toward Friday’s more important CPI report.
📈 SOFTER-THAN-EXPECTED PPI
Could reduce expectations for a September Fed hike, weaken the Dollar and potentially support gold, stocks, Bitcoin and major currencies against the Greenback.
ECB Interest Rate Decision
The European Central Bank also announces monetary policy today.
Markets broadly expect another 25-basis-point rate increase.
The main refinancing rate is expected to rise from approximately 2.40% to 2.65%, while the deposit facility rate is expected to rise from 2.25% to 2.50%.
EUR/USD traders should pay particular attention to President Christine Lagarde’s guidance following the decision.
A hawkish message could support the Euro, while cautious guidance could cause traders to question how many additional rate increases remain.
US Initial Jobless Claims
Weekly Initial Jobless Claims are also due alongside PPI.
Claims are expected around 205K compared with approximately 206K previously.
Another relatively low reading would reinforce the view that the US labour market remains resilient.
US Existing Home Sales
Existing Home Sales are expected around 3.98 million compared with approximately 4.06 million previously.
Housing data is unlikely to overshadow PPI but can provide additional information about the impact of elevated borrowing costs on the US economy.
US Wholesale Inventories
Wholesale inventory figures are also scheduled during the US session.
The release is a secondary event but can provide additional information about business demand and inventory accumulation.
EIA Crude Oil Inventories
Oil traders should also monitor US inventory data.
With Middle East supply concerns already driving crude, an unexpectedly large inventory draw could add further support to oil prices.
A large build could temporarily cool the rally.
Friday – US CPI Becomes the Next Big Test
Once PPI is released, attention will move almost immediately toward Friday’s Consumer Price Index.
Annual headline CPI is expected around 3.4%.
Core annual inflation is expected around 2.4%.
The report arrives just days before the Federal Reserve’s September 15–16 FOMC meeting.
That makes today’s PPI and tomorrow’s CPI some of the final major inflation information available before policymakers announce their next interest-rate decision.
🎯 TraderFactor Trading Focus
PPI can produce sharp volatility at release time.
Instead of predicting the number, consider allowing price to take liquidity first.
Look for buy-side or sell-side liquidity sweeps, CHoCH, Market Structure Shift, BOS, strong displacement, Fair Value Gaps and retests before considering a setup.
📅 Track Today’s Market Events
FOLLOW PPI, CPI, ECB & MARKET-MOVING NEWS
Check high-impact events before entering your trades and monitor live market movements throughout the session.
Final Outlook
US PPI is today’s most important scheduled macro catalyst.
The report could provide the first clear indication of whether US inflation pressures accelerated again during August.
That matters because strong employment data has already given the Federal Reserve more flexibility to concentrate on inflation.
At the same time, the renewed surge in global oil prices is increasing concerns that energy costs could keep inflation elevated.
Today’s market therefore revolves around three major forces:
- US PPI and Fed expectations
- ECB interest-rate policy
- Iran war headlines and oil prices
Trump’s suggestion that talks with Iran remain possible offers some hope of eventual de-escalation.
But without a confirmed ceasefire, oil and wider financial markets remain highly sensitive to breaking headlines.
Today’s PPI could provide the first major move.
Friday’s CPI may decide whether that move continues or reverses.
Current Market Bias
DXY:
Bearish below 99.00–99.50
Gold:
Neutral-bullish while above $4,344
EUR/USD:
Mild bullish above 1.1579
GBP/USD:
Bullish above 1.3470
NZD/USD:
Neutral around 0.5843 support
AUD/USD:
Neutral-bullish above 0.7165
USD/CAD:
Neutral as Dollar strength competes with high oil prices
USD/JPY:
Bearish below 155.20–155.30
USD/CHF:
Neutral
Bitcoin:
Neutral below $80,000
WTI:
Bullish while geopolitical supply risk remains elevated
NAS100:
Neutral ahead of PPI
US30:
Neutral-bearish below 53,000
S&P 500:
Neutral-bearish below 7,700
Frequently Asked Questions
What is PPI?
PPI meaning is Producer Price Index. The PPI measures the average change in prices received by domestic producers for goods and services. Traders monitor PPI because rising producer costs can signal increasing inflation pressures.
When is US PPI today?
The August 2026 US Producer Price Index is scheduled for Thursday, September 10 at 8:30 a.m. Eastern Time.
What time is PPI news today in Kenyan time?
For traders in Kenya, today’s US PPI release is scheduled for approximately 3:30 p.m. East Africa Time. Volatility can increase sharply around the release, particularly in USD pairs, gold and US indices.
What is the US PPI forecast for August 2026?
Current market forecasts expect headline PPI to increase around 0.4% month-on-month, with core PPI around 0.3%. Annual headline forecasts are clustered around 5.2%–5.3%, while core PPI is expected near 4.6%.
What happens if PPI is higher than expected?
A hotter-than-expected PPI can increase expectations that the Federal Reserve will maintain or tighten monetary policy. This can support the US Dollar and Treasury yields while creating pressure on gold, Bitcoin and interest-rate-sensitive stocks.
How does PPI affect forex?
PPI news forex traders watch can influence currency prices through interest-rate expectations. Higher US producer inflation may support the Dollar if markets expect tighter Federal Reserve policy, while softer PPI can weaken the Greenback.
What is the difference between PPI and CPI?
PPI vs CPI measures inflation at different stages. PPI focuses on prices received by producers, while CPI measures prices paid by consumers. Both reports can influence Federal Reserve policy and financial markets.
Why is PPI important before the Federal Reserve meeting?
Today’s PPI and Friday’s CPI are among the final major inflation releases before the September 15–16 FOMC meeting. Strong inflation could increase expectations for a rate hike, while softer figures could support a hold.
How do higher oil prices affect PPI and CPI?
Higher oil prices can raise fuel, transport, manufacturing and distribution costs. Those costs can first appear in producer prices and may eventually reach consumers, increasing broader inflation risks.
What time is US CPI tomorrow in Kenya?
The August US CPI report is scheduled for Friday, September 11 at 8:30 a.m. Eastern Time, which is approximately 3:30 p.m. Kenyan time.
Risk Disclaimer:
This Forex Market Today report is for educational and informational purposes only and does not constitute financial advice. Financial markets can become extremely volatile around economic data and geopolitical events. Always conduct your own analysis and use appropriate risk management.
| 🚀 Top-Rated Forex Broker Reviews Compare brokers, spreads, leverage, platforms & trading conditions. | ||
|---|---|---|
| 🔥 IronFX Trading Conditions | ⭐ PU Prime Spreads & Platforms | 📈 NAGA Social Trading |
| ⚡ TMGM Execution Speed | 💹 M4 Markets Account Types | 💼 RS Prime Broker Overview |
| 👑 OneRoyal Regulation & Safety | 🎯 Skilling Platform Review | 📊 DeltaStock Broker Features |
| 🚀 Eightcap Trading Experience | 🧪 Alchemy Markets Broker Analysis | ✅ ActivTrades Expert Review |
| 💰 VS Capital Broker Rating | ⚖️ High Leverage Compare Leverage | 📉 Low Spreads Trading Costs |
| Compare Broker Features, Costs, Regulation, Platforms & Leverage Explore our independent broker reviews before choosing your next trading account. | ||
📚 Master Forex Trading with TraderFactor
Build your trading edge with expert guides covering Smart Money Concepts (SMC), liquidity, market structure, price action and professional risk management.
📈 CHoCH & BOS Trading GuideLearn how Smart Money traders identify trend reversals using Change of Character and Break of Structure. | 💧 Identify LiquidityUnderstand where institutional traders hunt liquidity before major market moves. |
🎯 Liquidity Sweep StrategyMaster one of the most powerful Smart Money Concepts used before major reversals. | ⚖ Buy Side vs Sell Side LiquidityUnderstand where institutions target stop-losses and how liquidity drives price. |
🏦 Smart Money Concepts (SMC)Complete beginner’s guide to institutional trading and market structure. | 🚨 Avoid Liquidity GrabsLearn to recognize fake breakouts before they trap retail traders. |
📊 Forex Breakout StrategyDiscover how to trade high-probability breakout opportunities with confidence. | ⚡ Market Imbalance GuideUnderstand Fair Value Gaps and institutional imbalances like a professional trader. |
🛡 Protect Your Trading CapitalDiscover why Negative Balance Protection is essential for every forex trader and how it helps safeguard your account during periods of extreme market volatility. | |
About the Author
Phyllis Wangui
Senior Market Analyst, TraderFactor
Phyllis Wangui is a seasoned financial markets analyst with over a decade of experience in forex and CFD brokerage evaluation. Specializing in regulatory compliance and risk assessment, she leads the TraderFactor reviews team in delivering transparent, data-driven broker breakdowns that help retail traders navigate complex offshore and Tier-1 trading environments.

Reviewed by Alex Kanyi
Head of Compliance | TraderFactor
“This report is for general information only. Trading involves significant risk. Seek independent advice before acting on any content.”
Subscribe to the TraderFactor Newsletters
Last Updated: September 2026
Disclaimer:
All information has been prepared by TraderFactor or partners. The information does not contain a record of TraderFactor or partner’s prices or an offer of or solicitation for a transaction in any financial instrument. No representation or warranty is given as to the accuracy or completeness of this information. Any material provided does not have regard to the specific investment objective and financial situation of any person who may read it. Past performance is not a reliable indicator of future performance.