The EMA indicator in Forex, or Exponential Moving Average, is a key tool you can use to analyze price trends and momentum in the rapidly changing foreign exchange market. Unlike the simple moving average, the EMA focuses more on recent price data, making it quicker to respond to market shifts. This responsiveness makes it especially useful when you need to make well-informed decisions in fast-paced trading environments. By understanding how the EMA works and applying it effectively, you can identify possible entry and exit points, spot trends, and fine-tune your trading strategies. This guide will help you explore it in depth.
Table of Contents
ToggleEMA Indicator in Forex Overview
The EMA indicator in Forex is a vital tool that helps you track price trends and make informed trading decisions. This guide offers a comprehensive look at how the Exponential Moving Average (EMA) works, how it differs from other moving averages, and how you can use it to enhance your trading strategy. You’ll learn how to calculate EMA, set it up effectively, and interpret its signals to identify opportunities in the forex market. Whether you’re curious about different EMA timelines or want to explore strategies like the 8, 13, 21 EMA approach, this guide provides all the essentials you need.
Using EMA in a Forex Trading Strategy
Using the EMA indicator in Forex trading is all about identifying trends and making informed decisions. As part of any robust Forex moving average strategy, the Exponential Moving Average (EMA) helps emphasize recent price movements, giving you a clearer view of current trends. Unlike other moving averages, EMA places more weight on recent data, making it highly responsive in a fast-changing market. Whether you’re a day trader or a swing trader, incorporating EMA into your strategy helps you spot potential entry and exit points. To fully grasp its potential, you can explore resources like a Forex moving average Strategy PDF for step-by-step guidance on how to use EMA in trading effectively.
Different Types of EMA Indicators
When exploring the different types of EMA forex indicators, you’ll notice that each serves a specific function in Forex trading. The most common ones include the standard EMA, double EMA (DEMA), and triple EMA (TEMA). The standard EMA reacts swiftly to price changes, making it useful for quick trend analysis. DEMA and TEMA go further by reducing lag, offering smoother curves and more accurate readings during volatile market conditions. You can apply these variations depending on your trading style and goals. By understanding how to use moving average in Forex, you can select the right EMA type to enhance your strategies and optimize your trade decisions.
What is the Standard EMA?
The standard EMA forms the foundation of many trading strategies by placing greater emphasis on recent price data. This weighting ensures that your indicator adapts quickly to current market trends, making it crucial for short-term traders. It works best when analyzing sudden price movements or confirming trend reversals. For example, during volatile sessions, the standard EMA helps you detect momentum shifts, whether upward or downward. Its simplicity and responsiveness to quick changes make it one of the most commonly used tools for traders figuring out how to use moving average in Forex effectively.
What is a Double EMA (DEMA)?
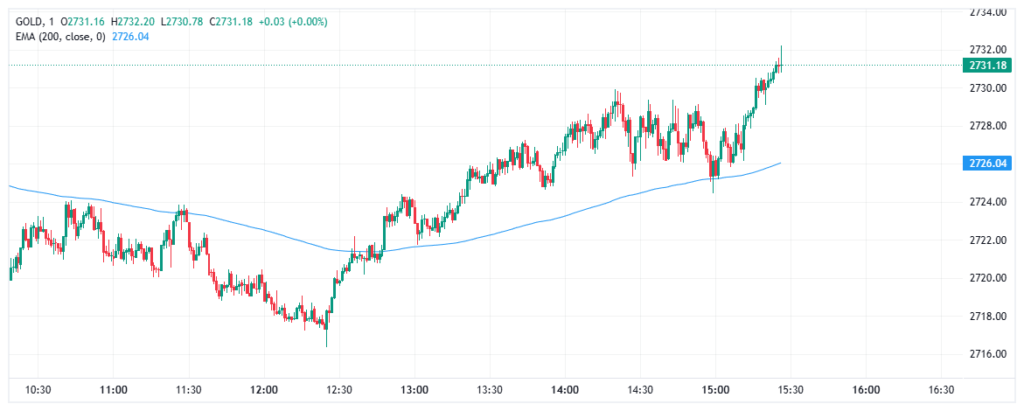
The Double EMA takes things further by tackling one major drawback of the standard EMA—lag. It uses a more complex calculation that reduces the delay between price movements and indicator signals, offering a faster response. This makes DEMA particularly helpful in high-volatility Forex markets where you need to act quickly. For instance, if a sudden breakout occurs, DEMA allows you to identify entry points faster than the standard EMA. It’s a great choice if you’re focusing on intraday trading and want to refine your ability to catch price trends early.

What is a Triple EMA (TEMA)?
The Triple EMA (TEMA) goes even beyond DEMA by virtually eliminating lag, providing an ultra-smooth line that reacts to price changes almost immediately. It’s ideal for confirming trends while filtering out market noise, which is a common issue when the market moves erratically. By combining three exponential calculations, TEMA offers a clearer picture of true market direction without false signals. For traders aiming to understand how to use moving average in Forex with maximum efficiency, TEMA can be especially useful in longer-term strategies, where precision and accuracy are key.

When Should You Use Each Type of EMA?
Choosing the right type of EMA depends heavily on your trading goals and the market environment. If you’re a beginner trying to understand how to use moving average in Forex, the standard EMA is a great place to start. It provides a basic yet effective tool for identifying trends and understanding price movements. For traders operating in fast-paced, high-volatility markets, DEMA is ideal as it reduces lag, enabling you to react more quickly to sudden market changes. This feature suits intraday or scalping strategies where timing is critical.
On the other hand, TEMA is best for those with long-term goals who need to remove noise from their analysis. Its smoothness helps focus on broader trends, making it valuable for swing or position trading. Knowing when to apply each EMA type ensures that your strategy aligns with market conditions and trading objectives.
How to Calculate Exponential Moving Average (EMA)
To calculate the Exponential Moving Average (EMA), you follow a formula that gives more importance to recent price data, making it more responsive to current trends. Here’s how you can do it step by step:
Calculate the Simple Moving Average (SMA):
Start with an SMA to establish a baseline for the first EMA calculation.
Determine the Multiplier:
Use the formula Multiplier = [2 ÷ (time periods + 1)]. For example, a 10-day EMA would have a multiplier of 0.1818.
Compute the EMA
Apply the weighted multiplier to the most recent price, then combine it with the prior EMA value for an updated result.
How to Set Up EMA Indicator
Setting up the EMA indicator on your trading platform is straightforward. Begin by opening your preferred platform, such as MetaTrader or TradingView. Search for “Exponential Moving Average” in the indicators section and select your desired time frame or period, like the 8, 13, 21 EMA strategy.
For example, you might use shorter periods for day trading and longer ones for swing trading. Adjust the settings based on your strategy, such as changing the color or line thickness for better visualization. Once done, integrate EMA with other tools to refine your Forex moving average strategy. Mastering the setup is the first step in leveraging EMA effectively.

Choosing the Right Trading Platform for EMA
Your first step is to select the right trading platform for setting up the EMA indicator. Platforms like MetaTrader and TradingView are highly popular due to their ease of use and detailed features. MetaTrader offers robust charting tools and built-in support for custom indicators, while TradingView stands out with its cloud-based accessibility and user-friendly interface.
Once you’ve chosen the platform that suits you, proceed to open the charts of the currency pair you wish to analyze. This decision is key in ensuring a smooth setup and effective implementation of your Forex moving average strategy.
Selecting Time Frames for EMA
Choosing the correct time frame for your EMA is critical to aligning it with your trading goals. Shorter time frames, such as 5 or 10 periods, are more suitable for day traders looking to capture quick opportunities. For swing traders or those with a long-term focus, EMAs set to 50 periods or more provide a clearer view of larger trends.
The popular 8, 13, 21 EMA strategy combines short-, medium-, and long-term analysis to offer a balanced approach. Experimenting with different time frames on your chart can help you identify which setup works best for your trading style.
Adjusting EMA Settings for Better Visualization
Once you’ve added the EMA to your chart, it’s important to customize its appearance for better readability. Most platforms allow you to adjust settings such as the color, thickness, and style of the EMA line. For instance, you might choose a bold line in red for shorter-term EMAs and a thinner one in blue for longer-term settings.
This distinction makes it easier to analyze crossover events and price interactions. Additionally, consider saving your settings as a template if your platform allows, so you don’t need to reconfigure them before every session.
Integrating EMA with Other Indicators
To enhance your Forex moving average strategy, it’s a good idea to pair EMA with complementary indicators. For example, you can combine EMA with the Relative Strength Index (RSI) to confirm potential trend reversals or use Bollinger Bands for better insights on market volatility.
Setting up multiple indicators might feel complex at first, but many trading platforms make it easy to layer them onto the same chart. This integration gives you a comprehensive perspective, allowing you to make well-informed decisions when trading Forex pairs.

Testing and Refining Your EMA Setup
Once your EMA indicator is set up, it’s essential to test it on a demo account. Use this opportunity to fine-tune your settings, experiment with different time frames, and practice combining EMA with other tools. Pay attention to how your chosen setup performs in various market conditions, such as during high volatility versus low liquidity periods.
This testing phase ensures that your EMA is well-suited for your strategy, whether you’re focusing on day trading or long-term positions. Over time, these refinements will help you develop a more effective and reliable approach to Forex trading.
How to Use EMA on Forex
How to Interpret EMA Signals
Trend Direction
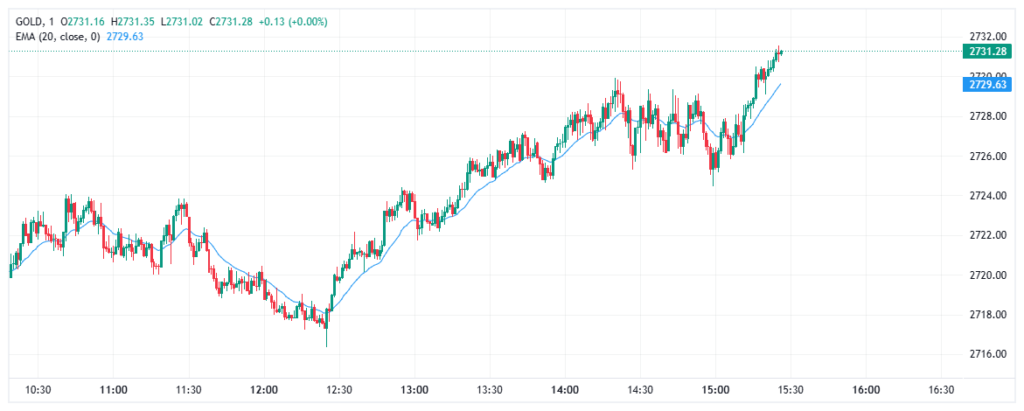
The slope of an EMA line can provide crucial insights into a market’s direction.
Upward Slope
When the EMA line is sloping upwards, it indicates that prices are generally trending higher, signaling a bullish market. A consistently rising EMA suggests the momentum is strong, and buyers dominate the market. This is a good opportunity to look for buying setups, particularly when the price stays above the EMA for an extended period.
Downward Slope
A downward-sloping EMA indicates a bearish trend, with prices moving lower over time. This reflects selling pressure in the market, and traders might consider looking for selling opportunities. If the price consistently remains below the EMA, it reinforces the idea that sellers are in control.

Keep an eye on the steepness of the slope; a steeper line often means stronger, more decisive momentum. Flatter slopes suggest consolidation or slower price movement, which may lead to trend reversals.
Crossovers
Crossovers between the price and the EMA provide valuable trading signals.
Price Crossing Above the EMA
When the price moves above a key EMA level, it may indicate a potential buying opportunity. This crossover suggests a shift in market sentiment to a bullish bias, particularly if supported by rising volume. The success of this signal improves when it aligns with other indicators like RSI, confirming upward momentum.
Price Crossing Below the EMA
When the price falls below the EMA, it may serve as a signal for selling or shorting the asset. This indicates bearish momentum, especially in combination with declining volume and other bearish signals like a divergence in momentum indicators. Traders must confirm this with additional tools to avoid false sell signals during volatile markets.
EMA Combinations

Using multiple EMAs helps visualize and analyze short-, medium-, and long-term trends simultaneously. This approach provides a broader context, offering traders more reliable insights for decision-making. Here’s how it works:
8, 13, 21 EMA Strategy
This strategy employs three different EMA lines to capture multiple timeframes. The 8-period EMA tracks short-term price changes, the 13-period EMA focuses on medium trends, and the 21-period EMA examines longer-term trends. Together, these lines help filter out noise and identify clearer buying or selling signals.
Bullish Signal
When the shorter EMA (8) crosses above the medium (13) and long-term (21) EMAs, it suggests strengthening upward momentum.
Bearish Signal
When the shorter EMA crosses below the longer ones, it indicates growing bearish pressure.
Golden and Death Crosses
Traders often look for a “Golden Cross,” where a shorter EMA (e.g., 50) crosses above a much longer EMA (e.g., 200), indicating a major upward trend. Conversely, a “Death Cross” happens when the shorter EMA crosses below the longer one, signaling potential bearish movement.

By layering EMAs and observing their interactions, you can identify shifts in market sentiment and anticipate potential trend changes. Combining these insights with other data, such as volume or support/resistance levels, makes your trading strategy even more robust.
How to Use EMA Crossovers in Forex
EMA crossovers are a powerful trading technique. When a short-term EMA, such as an 8-period, crosses above a longer-term EMA, like the 21-period, it can signal a bullish trend, indicating a potential buy opportunity. Conversely, a bearish crossover happens when the shorter EMA moves below the longer EMA, suggesting a possible sell signal. The Best EMA crossover strategy for day trading often uses this method to identify quick market shifts and capitalize on them. Practicing this strategy with your chosen EMA timeframes will enhance your ability to spot valuable entry and exit points.
What are the Most Common EMA Timelines?
- The 8-period EMA is a shorter timeline that is highly responsive to price movements, making it ideal for volatile or intraday trading.
- The 13-period EMA acts as a medium-term indicator, providing more stability while still reacting to recent market changes.
- The 21-period EMA is suited for trend-following strategies, offering a broader view of market direction with reduced sensitivity to short-term fluctuations.
- Combining these timelines in the 8, 13, 21 EMA strategy helps you analyze market conditions from multiple perspectives, identifying potential entry and exit signals.
- Experimenting with different timeframes allows you to tailor the setup to your trading style while emphasizing EMA’s adaptability and precision, core aspects of EMA Forex meaning.
Popular EMA Strategies
Mastering EMA trading strategies can help both novice and seasoned traders identify profitable opportunities across various market conditions. Here’s a detailed breakdown of the most effective EMA strategies and how to use them:
8, 13, 21 EMA Strategy
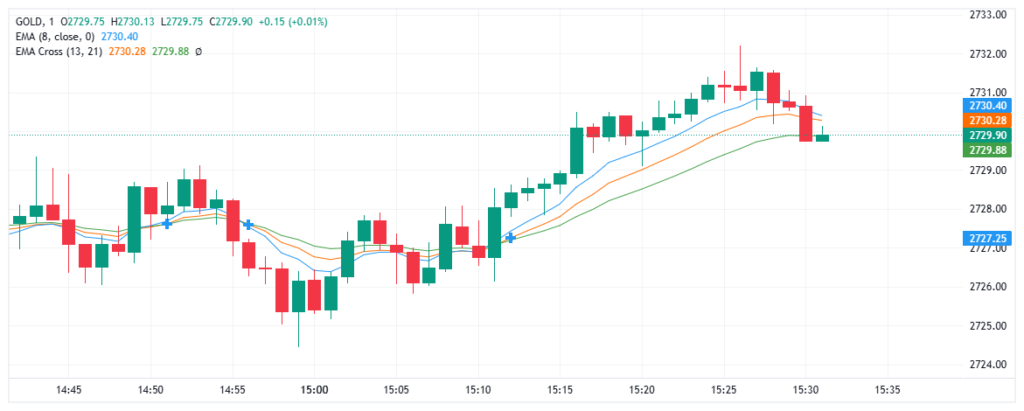
This strategy uses three EMAs to analyze short-, medium-, and long-term trends simultaneously. It’s particularly useful for trending markets, where identifying the direction and strength of the trend is key. Each EMA serves a distinct purpose:
- 8 EMA: Captures short-term price momentum.
- 13 EMA: Accounts for medium-term market moves.
- 21 EMA: Reflects the overarching trend.
How It Works:
- Bullish Signal: When the 8 EMA crosses above the 13 EMA and, shortly after, both cross above the 21 EMA, this indicates that buyers are dominating, and the market is in an upward trend. Look for entry opportunities around pullbacks near the EMAs.
- Bearish Signal: Conversely, when the 8 EMA crosses below the 13 and 21 EMAs, it signals selling pressure and a potential downward trend. This creates opportunities for short positions.

Tips for Implementation:
- Market Conditions: Use this strategy in markets exhibiting clear trends. Avoid sideways market conditions, as signals may be unreliable.
- Entry/Exit Points: Look for price pulling back to the EMAs in a trending market before entering a trade to ensure a better price and reduced risk. Exit trades when crossovers suggest a potential trend reversal.
- Complementary Indicators: Pair with the Relative Strength Index (RSI) to confirm the strength of the trend or potential reversals. Higher volume near the crossovers adds further validity.
9/20 EMA Strategy
This strategy focuses on two key EMAs—a 9-period EMA for short-term trends and a 20-period EMA for medium trends. It’s a simple and effective approach for swing traders and day traders alike.

How It Works:
- Bullish Signal: The 9 EMA crossing above the 20 EMA indicates upward momentum. Look for confirmation with candlestick patterns, like bullish engulfing candles, or bullish divergences in RSI or MACD.
- Bearish Signal: The 9 EMA crossing below the 20 EMA highlights potential downward price movement. This can signal a good entry for short positions.
Best Market Conditions:
- Works well in strong trending markets, especially after significant news events or economic reports, which often drive sustained moves.
- Avoid in highly volatile, choppy conditions, as false crossovers may lead to whipsaws.

Practical Tips:
- Stop Loss Placement: Place stop-loss orders just below the most recent swing low for long positions or above the swing high for short trades.
- Exit Strategy: Exit positions when the price moves too far from the EMAs, indicating overextension, or when the crossovers reverse direction.
- Add-ons: Combine with pivot points to identify key support or resistance levels for more precise entry and exit decisions.
5 EMA Scalping Strategy
Scalping is a fast-paced strategy aimed at profiting from short-term price movements. The 5 EMA focuses on tracking rapid changes in market direction, making it ideal for this approach.
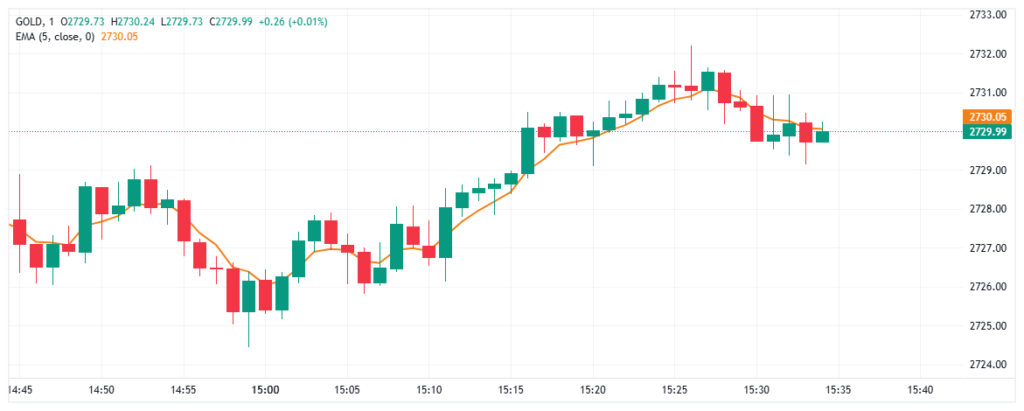
How It Works:
- Bullish Signal: Enter a long trade when the price crosses above the 5 EMA and sustains above it for a few bars.
- Bearish Signal: Enter a short trade when the price crosses below the 5 EMA and stays below for several bars.
Best Market Conditions:
- This strategy excels in highly liquid and volatile markets, such as Forex pairs like EUR/USD or USD/JPY during peak trading hours.
- Avoid during low liquidity times, as spreads may reduce profitability.
Practical Tips:
- Timeframes: Use this strategy on shorter timeframes, such as 1-minute, 5-minute, or 15-minute charts.
- Momentum Indicators: Combine with the Stochastic Oscillator or MACD for added confirmation of overbought or oversold conditions.
- Quick Stops and Targets: Set tight stop-loss and take-profit levels, typically aiming for a risk-reward ratio of 1:2. Scalping requires quick decisions, so stick to your plan to avoid letting trades run against you.
- Avoid Overtrading: Stick to a handful of high-quality setups each day, rather than constantly hunting for trades.
Comparing EMA and SMA
While both EMA and SMA calculate average price data over a selected time period, they differ significantly in how they weigh prices. Understanding these distinctions is crucial for selecting the appropriate indicator for your trading strategy.
How EMA Calculates Moving Averages
The Exponential Moving Average (EMA) prioritizes recent price movements by placing more weight on the latest data points. This feature makes EMA highly sensitive to market changes, allowing it to reflect trends faster. For instance, in volatile Forex markets, where quick reversals occur often, you might find EMA more effective. By reacting swiftly to price shifts, this indicator helps you identify emerging trends or potential entry and exit points faster than other moving averages. However, keep in mind this sensitivity could also lead to more false signals in choppy markets.
How SMA Distributes Weight Equally
The Simple Moving Average (SMA) takes a different approach by assigning equal weight to all data points in the selected time frame. This even distribution provides a smoother line that is less prone to reacting to sudden price spikes or fluctuations. SMA works well in stable or long-term market conditions, where trending patterns are steady and consistent. If your Forex strategy focuses on filtering out noise to concentrate on a broader trend, SMA might be the better tool for you. However, its slower responsiveness may cause delays in reflecting market reversals.

Sensitivity to Market Changes
EMA’s sensitivity to recent prices makes it a go-to choice for short-term traders, particularly in fast-moving Forex markets. This quick adaptation allows you to act on trend changes almost immediately, which is crucial for day trading or scalping strategies. On the other hand, SMA, with its more linear approach, is better suited for traders who prefer to analyze historical data over a longer time horizon. It helps you avoid overreacting to minor fluctuations, making it ideal for swing or position trading.
Choosing Between EMA and SMA
The choice between EMA and SMA often depends on your trading objectives and the conditions of the market you’re dealing with. If you’re operating in highly volatile Forex markets or utilizing a strategy that benefits from tracking swift changes, EMA can give you a competitive edge. However, if your focus lies in identifying long-term trends and building a more conservative strategy, the SMA’s steadiness might align better with your goals. Each indicator complements specific trading styles, so understanding their differences ensures you make more informed decisions.
Practical Application in Forex Markets
To decide which moving average to use, consider the time frame and market environment you trade in. For example, day traders may lean on EMA for its ability to signal quick reversals, while long-term investors might find SMA more practical for detecting sustained trends. You can also combine both indicators in your analysis to gain a comprehensive view of the market. For instance, using an EMA for short-term signals and an SMA for long-term trends can provide balanced insights for more strategic trading.
Pros and Cons of the EMA Indicator
Advantages of EMA:
- Offers strong responsiveness to current price changes, helping you quickly identify trends.
- Can be effectively paired with other technical indicators to enhance your Forex trading strategy.
- Ideal for fast-paced environments, such as volatile Forex markets, where rapid decision-making is crucial.

Disadvantages of EMA:
- Its high sensitivity to recent data might generate false signals, especially in choppy or unstable markets.
- May pose challenges for beginners due to the potential for overreacting to short-term price fluctuations.
- Requires careful balancing of its strengths and limitations for effective implementation in trading strategies.
Tips to Optimize EMA Strategy

- Identify the EMA settings that best match your trading style. For example, the 8, 13, 21 EMA strategy combines short, medium, and long-term perspectives effectively.
- Pair EMA with other tools like the Relative Strength Index (RSI) to confirm trends and improve decision-making.
- Avoid relying solely on EMA by integrating additional data such as price action and volume analysis into your strategy.
- Test your strategy in demo accounts to evaluate its effectiveness without risking real capital.
- Review resources like a Forex moving average strategy PDF for further insights and practical guidance.
- Dedicate time and consistent effort to refine your approach, gradually unlocking EMA’s full potential for your trading.
Common Mistakes to Avoid

When using EMA in trading, certain mistakes can hinder your effectiveness and lead to poor decisions. Here’s how to avoid them and refine your strategy:
Overcomplicating the Chart
Using too many EMAs with overlapping periods can clutter your chart and cause confusion. This often results in conflicting signals that make it harder to identify clear opportunities.
Solution:
Stick to a maximum of two or three EMAs with distinct timeframes, such as short-term (8 or 13), medium-term (21), and long-term (50 or 200). Simplicity helps you focus on actionable insights, keeping your analysis clean and effective. Avoid combining EMAs unnecessarily with every available indicator—prioritize the ones that complement your strategy.
Ignoring Market Conditions
EMAs are primarily trend-following indicators, which means they perform best in trending markets. However, in sideways or choppy markets, they become less reliable and can generate false signals, leading to losses.

Solution:
Before relying on EMA-based strategies, assess current market conditions by identifying whether the market is trending or consolidating. Use additional tools such as Bollinger Bands or Average True Range (ATR) to gauge volatility. If you notice a range-bound market, consider waiting for a breakout before leveraging EMAs as part of your strategy.
Focusing Solely on Crossovers
Relying entirely on EMA crossovers to make trade decisions can be risky, as crossovers alone may not account for broader market dynamics. Over-dependence on them can lead to false entries or exits during periods of high volatility or market unpredictability.
Solution:
Always confirm EMA crossover signals with other indicators or methods. For instance:
- Use the Relative Strength Index (RSI) to check whether the market is overbought or oversold.
- Assess trading volume—higher volume during a crossover gives the signal more credibility.
- Incorporate price action analysis, such as identifying key support and resistance levels, to validate the signal.
Diversifying your analysis tools reduces the risk of acting on unreliable signals.

Additional Tips to Avoid Mistakes
- Lagging Nature of EMA: Remember, EMA lags behind market prices because it’s based on historical data. Be cautious and use it to confirm trends rather than predict them.
- Overtrading: Avoid entering multiple trades based on minor EMA signals, as this can lead to overtrading. Only act on strong, well-validated signals.
- Failing to Backtest: Many traders skip the step of backtesting their EMA strategies, leading to poor performance. Always test your approach on historical data before deploying it in live markets.
Frequently Asked Questions

What is the EMA indicator in Forex strategy?
The EMA (Exponential Moving Average) is a technical indicator used in Forex trading to analyze price trends. It places a higher weight on recent prices, making it more responsive to market changes. This responsiveness helps traders identify trends and potential entry or exit points.
How to use EMA indicator Forex?
You can use the EMA to track price trends and identify areas of support or resistance. Combine it with other tools like RSI or stochastic indicators for confirmation. Adjust your EMA settings based on your trading strategy, whether short-term or long-term.
Which EMA indicator to use?
The choice of EMA depends on your trading goals and timeframe. For instance, shorter EMAs like the 8-period are suited for scalping, while longer ones like the 50 or 200 EMA are better for trend-following strategies. Many traders combine different EMAs for a balanced analysis.
What is the formula of EMA indicator?
The EMA formula calculates the weighted average of prices, giving more significance to recent data. It uses a multiplier based on the selected period to smooth price movements. This multiplier accelerates its responsiveness compared to a simple moving average.

How to use 20 EMA indicator?
The 20 EMA is commonly used to track short- to medium-term trends. You can place it on your chart to monitor areas where the price may pull back before continuing its trend. Look for crossovers with other EMAs to confirm entry or exit points.
Which EMA is best for Forex?
The “best” EMA will depend on your trading style. Shorter EMAs, such as the 8 or 13-period, are great for quick trades, while longer ones like the 50 or 200 EMA excel in identifying long-term trends. Experiment with combinations like the 8, 13, 21 EMA strategy to refine your analysis.
What is the best timeframe for EMA?
The best timeframe varies depending on your trading preferences. For day trading, shorter timeframes like the 1-minute or 5-minute charts work well. Swing traders may prefer daily or 4-hour charts for a broader view of the trend.
How is EMA used for prediction?
EMA helps predict price movements by highlighting trends and detecting reversals more quickly. When prices stay above or below the EMA, it signals potential continuation or reversal. However, no indicator guarantees accuracy, so use it alongside other tools.

Which EMA is best for scalping?
Shorter EMAs like the 8-period or 5-period are ideal for scalping due to their high responsiveness. They quickly reflect recent price movements, allowing you to act on small, rapid changes in the market. Pair them with additional indicators for confirmation.
What is the 5 EMA strategy?
The 5 EMA strategy uses a very short EMA to identify rapid price changes in day trading. It is often combined with other EMAs for crossovers to confirm entry or exit points. This strategy is effective in fast-moving markets with high volatility.
Which indicator is best for trading?
No single indicator is universally the best, but the EMA is among the most popular for trend analysis. Other commonly used indicators include RSI and Bollinger Bands for momentum and volatility. A combination of indicators often provides better insights.
How do you read an EMA?
You read an EMA by observing its slope and its relationship to price action. An upward-sloping EMA indicates a bullish trend, while a downward slope suggests a bearish trend. Crossovers between EMAs or the price can signal potential trading opportunities.

How do you solve EMA?
To calculate an EMA, start with the simple moving average (SMA) of the initial period. Then, apply the EMA multiplier formula to adjust weights toward recent prices. Charting platforms typically calculate it automatically for you.
What is a 9/20 strategy?
The 9/20 strategy involves using the 9 EMA and 20 EMA to track short- and medium-term trends. When the 9 EMA crosses above the 20 EMA, it signals a potential buy opportunity. A crossover in the opposite direction might indicate a sell signal.
What is the 9 and 21 EMA strategy?
The 9 and 21 EMA strategy identifies short-term trend shifts by observing the crossover between these EMAs. A bullish signal arises when the 9 EMA crosses above the 21 EMA, and a bearish signal occurs when it drops below. Use this strategy alongside other tools for confirmation.
What is the 8-13-21-55 EMA strategy?
This strategy uses four EMAs to analyze trends across multiple time horizons. The shorter EMAs, such as 8 and 13, help detect immediate price changes, while 21 and 55 provide medium- and longer-term perspectives. This comprehensive approach helps filter signals and reduce noise.
How to read EMA indicator?
To read an EMA indicator, focus on its slope and crossovers with price or other EMAs. A rising EMA suggests increasing momentum, whereas a falling EMA indicates weakening momentum. Combine this analysis with market context for better accuracy.
Conclusion
Understanding and using the EMA indicator in Forex trading gives you a significant edge in identifying trends and making informed decisions. From learning how to calculate the EMA to optimizing strategies like the Best EMA crossover strategy for day trading or the 8, 13, 21 EMA approach, this tool enhances your market analysis. Practicing regularly will make EMA an essential part of your success.
Disclaimer:
All information has been prepared by TraderFactor or partners. The information does not contain a record of TraderFactor or partner’s prices or an offer of or solicitation for a transaction in any financial instrument. No representation or warranty is given as to the accuracy or completeness of this information. Any material provided does not have regard to the specific investment objective and financial situation of any person who may read it. Past performance is not a reliable indicator of future performance.

