
Learn how to use Fibonacci retracement in forex trading with real XAUUSD examples, proven strategies, and the golden zone setup. Start trading smarter today.
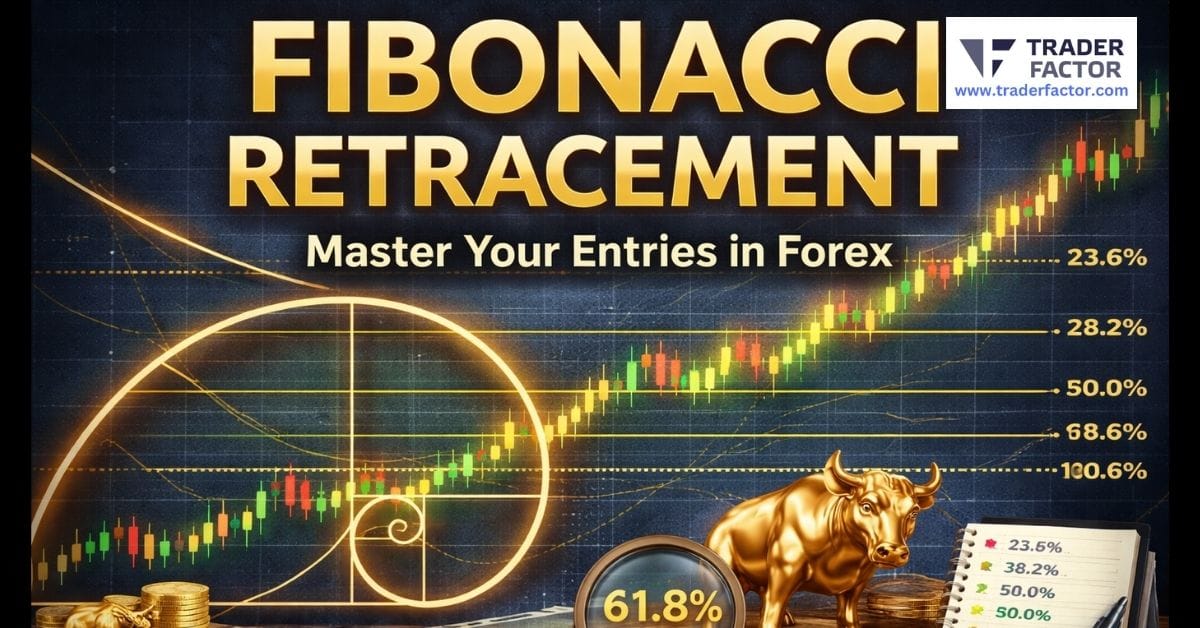
Fibonacci Retracement Forex Strategy: How to Trade Like a Pro (2026 Guide)
If you’ve ever wondered how professional traders consistently find perfect entry points, the answer often comes down to one tool:
👉 Fibonacci retracement
Used by institutional traders, hedge funds, and smart money, Fibonacci helps you identify:
- Where price will likely reverse
- Where to enter trades with precision
- Where to place stop losses and take profits
In this complete guide, you’ll learn:
How to combine Fibonacci with other indicators
- How Fibonacci retracement works (simple explanation)
- The most important Fibonacci levels in forex
- A proven Fibonacci trading strategy (with rules)
- Common mistakes that destroy beginner traders
What Is Fibonacci Retracement in Forex?
Fibonacci retracement is a technical analysis tool used to identify potential reversal levels in a trending market.
It works by measuring how far price pulls back before continuing in the original direction.
Key Idea:
Markets don’t move in straight lines. They move in:
- Impulses (trend moves)
- Retracements (pullbacks)
Fibonacci helps you trade the pullback, not chase the market.
The Most Important Fibonacci Levels
These are the levels every trader watches:
| Level | Meaning |
|---|---|
| 23.6% | Weak pullback |
| 38.2% | Moderate retracement |
| 50% | Psychological level (very important) |
| 61.8% | Golden ratio (strong reversal zone) |
| 78.6% | Deep retracement |

The Golden Zone (Where Smart Money Enters)
The most important area is:
👉 50% – 61.8% (Golden Zone)
This is where:
- Banks accumulate positions
- Smart money enters trades
- Retail traders often get trapped
Fibonacci Retracement Trading Strategy (Pro Setup)
This is where most guides fail — they explain theory but don’t give you a real strategy.
Here’s a simple but powerful system:
Entry Rules
- Market must be trending
- Price pulls back into 50% – 61.8% zone
- Confirm with:
- Support/resistance
- Trendline
- RSI or MACD
Stop Loss
- Below 78.6% level (for buys)
- Above 78.6% level (for sells)
Take Profit
- TP1: Previous high/low
- TP2: Fibonacci extension (1.618 level)
Example Setup
- EUR/USD in uptrend
- Price retraces to 61.8%
- RSI shows oversold
👉 BUY
Try This Strategy Yourself
👉 Start practicing Fibonacci on a live chart using platforms like:
- TradingView
- MetaTrader 4 (MT4)
- MetaTrader 5 (MT5)

🔥 Recommended Brokers for Beginners
- Low spreads
- Fast execution
- Demo accounts available
👉 Open a free demo account and test this strategy risk-free
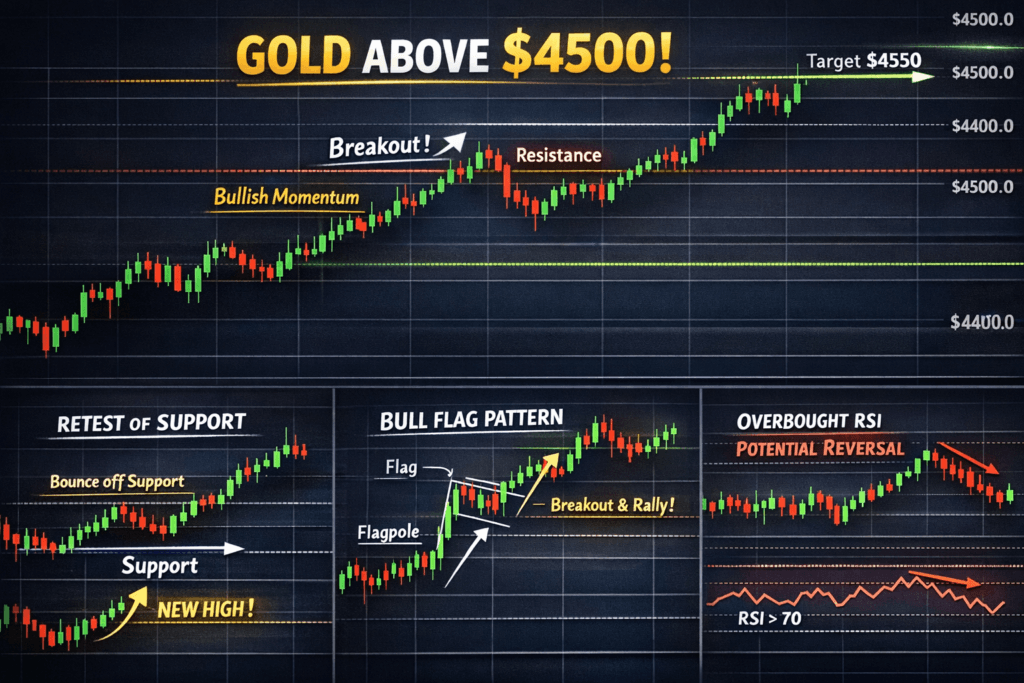
Real XAUUSD Fibonacci Retracement Examples (Add This Section)
Example: Bullish Fibonacci Retracement (Gold Uptrend)
Market Context
- Strong bullish move (impulse)
- Clear higher highs & higher lows
- Price enters retracement phase
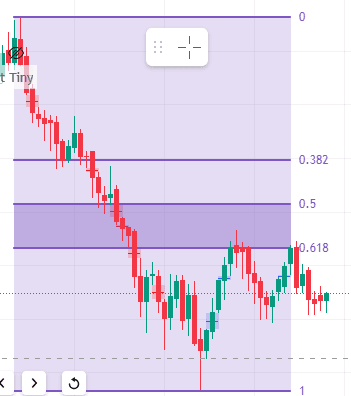
📍 Fibonacci Setup
- Swing Low → Swing High
- Retracement hits 61.8% level
👉 This is the golden zone
🎯 Trade Execution
- Entry: 50–61.8% zone
- Stop Loss: Below 78.6%
- Take Profit: Previous high → extension
📈 What Happened?
Price respected the retracement and continued upward — a classic continuation setup.
👉 In many real XAUUSD cases, price reacts strongly at 50% or 61.8% before continuing trend
Step-by-Step Guide to Fibonacci Retracement
Learning how to apply Fibonacci retracement isn’t as hard as it might seem. Here’s a simplified step-by-step guide to help you get started.
Step 1 is identifying a clear movement in price
Look for a strong uptrend or downtrend on your chart.
For example, if you’re analyzing a forex pair like XAUUSD, you might notice the price has fallen significantly over a few hours or days.
Step 2 is drawing the retracement tool

Select the Fibonacci retracement tool on your trading platform.
Place the starting point (usually the lowest price in the trend) and the ending point (the highest price) if the trend is upward.
If it’s a downtrend, you do the reverse.
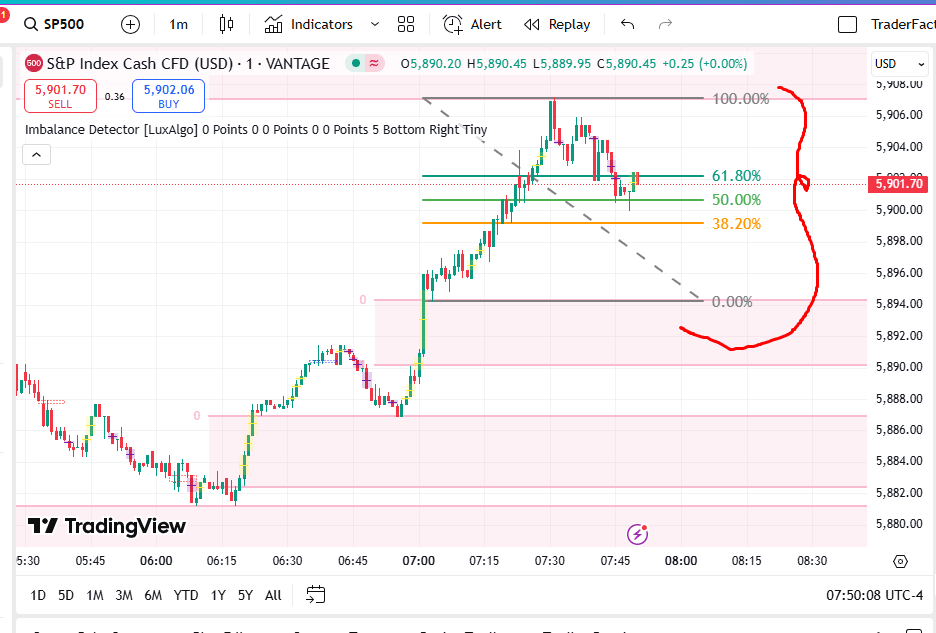
Step 3 is reading the levels

The platform will automatically generate retracement levels, typically 23.6%, 38.2%, 50%, and 61.8%.
Watch how the price behaves near these levels.
For example, if it pauses or reverses at 50%, that could signal a continuation of the original trend.
Step 4 is making your move
Use the retracement levels as guidelines when plotting entry or exit points. Combine this information with other indicators or signals to make stronger decisions.
Best Fibonacci Retracement Tools for Stock Trading
When choosing Fibonacci retracement tools for stock trading, the right platform makes all the difference. Stock traders need tools that are not only accurate but also easy to use. TradingView, for example, is a favorite among traders because of its clean interface and powerful features. It allows you to quickly plot Fibonacci levels on charts, adjust them if needed, and even customize the settings for specific trading styles.
Another great option is ThinkorSwim, which caters particularly to stock traders. Along with its advanced charting setup, it provides robust tools for marking retracement levels and seeing how prices interact with them over time. No matter which software you pick, the tool’s accuracy and user-friendliness should be top priorities. Many platforms even include backtesting options, so you can test how Fibonacci retracement levels worked historically. Once you find a tool that suits your trading needs, you’ll see how much easier analyzing stock price movements can become.

Fibonacci Retracement Indicator for MT4
The Fibonacci retracement indicator for MT4 is a solid choice for traders who favor forex or CFDs. MT4, short for MetaTrader 4, is a go-to platform for its precision and robust indicators. The retracement tool is straightforward, making it accessible even for beginners. You simply add the indicator to your chart, and from there, it’s easy to plot the Fibonacci levels based on price movements.
One of the standout features of the MT4 platform is its flexibility. You can switch between different time frames, from one-minute to daily charts, all while using the retracement tool effectively. For example, if the EUR/USD currency pair jumps from 1.1000 to 1.1500, you can use the tool to gauge where it might retrace. If it dips to the 50% retracement level (1.1250) and shows signs of reversing, it could be a good buying opportunity, depending on your strategy. MT4 also supports custom modifications, so you can adjust the Fibonacci levels based on personal trading preferences.
Fibonacci Retracement Tool for TradingView
The Fibonacci retracement tool for TradingView is widely regarded as one of the best tools out there. What makes it so popular? First off, its ease of use. TradingView has an intuitive drag-and-drop feature for plotting Fibonacci levels. You can simply select the retracement tool, click on the starting point of a price movement, and drag it to the end point. The Fibonacci lines are drawn automatically, showing you potential support and resistance levels.

Another great aspect is its visual clarity. If you’re analyzing a stock chart, TradingView’s clean layout ensures that retracement levels are prominent but not overwhelming. Also, it offers advanced customizability—whether you want to change colors, adjust line styles, or zoom in on specific retracement levels, the options are all there. For beginners, the platform’s built-in tutorials and community chat features can help speed up the learning process. With TradingView, you’re not just getting a Fibonacci retracement tool—you’re getting a complete charting experience that evolves with your skills.
How to Draw Fibonacci Retracement on a Chart
Start by identifying a noticeable price movement. For instance, if you’re analyzing an upward trend in a stock, find the lowest point where the trend began and the highest point it reached. These will serve as your anchor points for the retracement tool.
Next, open your trading platform, tools like TradingView, MT4, or ThinkorSwim make this task easy. Select the Fibonacci retracement tool, then click on the low point of the trend (if it’s an uptrend) and drag it to the high point. If the trend is downward, just reverse the process. The retracement levels, such as 23.6%, 38.2%, 50%, and 61.8%, will automatically appear on the chart.

These levels act as potential zones where the price might stall, reverse, or continue its current trend. For example, if a stock climbs from $100 to $150 and retraces to $125 (the 50% level), this could be a signal that buyers are stepping in again. Drawing Fibonacci retracement on a chart is something you’ll get better at with practice, and it’s worth revisiting past price movements to see how reliably the levels have held.
Fibonacci Retracement in Forex, Crypto, and Stocks
Forex trading is all about navigating swings in currency prices, and Fibonacci retracement is a tool that makes this process much easier. Whether you’re day trading or taking a longer approach, retracement levels show where a currency pair might reverse or stabilize before continuing its trend. These levels—38.2%, 50%, and 61.8%—act as guideposts for finding potential entry or exit points.
For example, imagine the EUR/USD pair climbs from 1.1000 to 1.1500. You notice it starts pulling back after hitting 1.1500. Using the Fibonacci retracement tool, you mark the high at 1.1500 and the low at 1.1000. The tool then plots the retracement levels, giving you price zones to watch for potential reversals. If EUR/USD pauses at the 50% level (around 1.1250), it might signal a buying opportunity to continue with the uptrend.
Forex trading is known for its volatility, but Fibonacci retracement provides a structured way to handle these fluctuations. Always combine it with other tools, like moving averages or trend lines, to make more confident decisions.

Fibonacci Retracement for Crypto Trading
Cryptocurrency markets are notoriously unpredictable, making Fibonacci retracement an essential tool for crypto trading. Whether you’re trading Bitcoin, Ethereum, or altcoins, retracement levels help you anticipate key price areas where the market might react. Since crypto prices tend to move quickly, having a logical framework like Fibonacci retracement is a huge asset.
Take Bitcoin, for instance. Suppose it surges from $93,000 to $95,000 in a short time frame, and then you start seeing a dip in the price. Using the Fibonacci retracement tool, you plot the movement, marking $93,000 as the low and $95,000 as the high. If Bitcoin’s price hovers near one of these levels and shows signs of bouncing, it could be an indication that investors are stepping back in.
Crypto trading can feel overwhelming due to its rapid pace, but Fibonacci retracement simplifies your decision-making, helping you focus on logical points of interest rather than emotions or guesswork.

Fibonacci Retracement in Stock Market Analysis
Fibonacci retracement in stock market analysis is a widely used method for identifying price pullbacks during strong market trends. Whether you’re trading blue-chip companies or smaller growth stocks, retracement levels give you a structured approach to understanding price behavior.
For example, assume you’re tracking a tech stock that has rallied from $100 to $150 on positive earnings. Naturally, no price moves up forever, and you observe the stock starting to dip. Applying the Fibonacci retracement tool from the low of $100 to the high of $150, you see the levels appear. If the price begins to stabilize near the 38.2% level (roughly $130) or 50% level (around $125), it might signal a good re-entry point for continuing the trend. Many traders use these levels not just to identify potential entry points, but also to set stop-loss orders and targets.
By combining Fibonacci retracement with other methods like volume analysis or fundamental insights, stock traders can build stronger strategies. It’s one of those tools that becomes second nature once you practice.
Combining Fibonacci Retracement with Moving Averages and More
Once you’ve mastered the basics, you can pair Fibonacci retracement with other tools to refine your strategy. Combining Fibonacci retracement with moving averages, for example, adds another layer of confirmation. If a retracement level aligns with a significant moving average, it could signal a high-probability trade.
Combining Fibonacci Retracement with Moving Averages
Fibonacci retracement and moving averages work beautifully together to create a more reliable trading strategy. While Fibonacci levels help you identify potential pullbacks, moving averages provide a sense of the overall market direction. When used together, they can highlight high-probability areas to enter or exit trades.
For example, assume you are analyzing an uptrend in a stock. The price rises from $50 to $100 and begins to retrace. You use the Fibonacci tool to mark the retracement levels, and you also overlay a 50-day moving average on the chart. If the price pulls back to the 50% retracement level and also aligns with the 50-day moving average, this convergence might indicate a strong area of support. It’s as if both tools are confirming the same thing, which can boost your confidence.

By combining Fibonacci retracement with moving averages, you filter out weaker signals and create a strategy grounded in both price levels and momentum. It takes practice, but this combination often turns out to be a game-changer for many traders.
Fibonacci Retracement and Support/Resistance Levels
Support and resistance levels are key concepts in trading, and Fibonacci retracement can help you uncover them with precision. These levels represent areas where price has historically struggled to move beyond (resistance) or where it has typically bounced back (support). By aligning Fibonacci levels with these zones, you can pinpoint solid trading opportunities.
For instance, picture a forex pair like USD/JPY that has advanced from 120 to 125 but then starts to correct downward. You use the Fibonacci retracement tool to mark 38.2%, 50%, and 61.8%. Now, if the 61.8% Fibonacci level, for example, aligns with a known support level on the chart, it becomes a strong signal. You might consider buying here, expecting the price to bounce.

When trading with both tools, always look for how price reacts near these intersections. If the price hesitates or forms clear candlestick patterns at these combined levels, it often reinforces their significance, giving you more confidence in your trades.
Fibonacci Retracement and Elliott Wave Theory
Fibonacci retracement aligns seamlessly with Elliott Wave theory, a method that breaks down market trends into predictable price waves. If you’re learning Elliott Wave theory, you’ll notice that Fibonacci ratios are often used to estimate the size of corrective and impulsive waves within a trend.

Here’s an example: Suppose you’re looking at a stock during an uptrend and identify Wave 1 (an upward movement) and Wave 2 (a pullback). According to Elliott Wave theory, Wave 2 often retraces between 38.2% and 61.8% of Wave 1. You use the Fibonacci retracement tool to measure this range. If the price pulls back to the 50% level and begins to consolidate, it might indicate Wave 3 is about to start—a potential strong upward move.
Combining Fibonacci retracement with Elliott Wave theory requires a bit of practice and familiarity. However, when done right, it offers a powerful framework for understanding price behavior, particularly during trends. This pairing is often preferred by advanced traders looking for more in-depth market analysis.

How to Trade Reversals with Fibonacci Retracement
Trading reversals is exciting but tricky, and this is where Fibonacci retracement becomes a helpful ally. Reversals happen when the price changes direction, moving from an uptrend to a downtrend or vice versa. Fibonacci levels help you identify likely zones where this might occur.
For example, imagine a cryptocurrency like Ethereum is dropping from $4000 to $3800 and suddenly starts to recover. You measure this downtrend using Fibonacci retracement, plotting from $4000 to $3800. The levels will show upward pullbacks, like 38.2% at $1,308 or 50% at $1,350. If price approaches one of these levels but begins to struggle, it could signal the end of the pullback and a potential continuation of the downtrend, a great spot for a reversal trade.
When trading reversals, confirmation is essential. Look for candlestick patterns, volume changes, or signals from other indicators like RSI. Fibonacci retracement gives you the levels, but it’s crucial to rely on other evidence to strengthen your trade idea. Over time, you’ll get more comfortable recognizing these setups.
Common Mistakes When Using Fibonacci Retracement
Fibonacci retracement isn’t a crystal ball, and it’s important to avoid common mistakes when using it. One big error is relying on it alone. If you’ve asked yourself, “Why Fibonacci retracement doesn’t work sometimes?” it could be because you’re not considering the bigger picture.
Trends, market sentiment, and other technical factors all play a role in how well Fibonacci levels hold. To avoid false signals with Fibonacci retracement, always pair it with other tools. Pay attention to how the price behaves near key levels, confirmation is crucial.

Why Fibonacci Retracement Doesn’t Work Sometimes
Fibonacci retracement doesn’t always work, and there are a few key reasons why this happens. First, market conditions constantly change. If there’s a sudden influx of news, like an earnings report or geopolitical event, it might override technical indicators like Fibonacci levels entirely. Markets can become irrational during these times, disregarding levels that would otherwise hold.
Second, Fibonacci retracement levels aren’t magical. They indicate possible turning points, not guaranteed outcomes. For example, the price may blow right past the 61.8% level without reversing. Why? Because other traders might be following different strategies, like focusing on support/resistance zones or breaking news updates.
Additionally, the time frame you’re analyzing matters. If you’re using Fibonacci levels on a 5-minute chart but the market is reacting to daily or weekly levels, your analysis may not align with the bigger picture. It’s crucial to pair Fibonacci retracement with other tools and ensure you’re considering the right time frame for your trading strategy.
How to Avoid False Signals with Fibonacci Retracement
Avoiding false signals when using Fibonacci retracement requires a multi-step approach.
First, always analyze the overall trend. If you’re trading an uptrend and the retracement tool suggests a bounce at a 50% level, verify that the overall trend is still intact. Tools like moving averages can help confirm whether the trend remains strong or is weakening.

Second, look for convergence with other indicators. If a Fibonacci level aligns with established support or resistance areas, it adds strength to the signal. For instance, if a stock retraces to 38.2% and this level also aligns with previous swing highs, the zone is more likely to be significant.
Volume is another important confirmation tool. If the price bounces from a Fibonacci retracement level and is accompanied by a spike in volume, it’s a stronger indication of a reversal. Without this increase in volume, it’s possible the bounce might just be temporary noise.
Lastly, practice patience. Allow the market to show its hand before committing to a trade based solely on Fibonacci levels. Waiting for confirmation, such as candlestick patterns like bullish engulfing or hammer formations, can help avoid jumping into trades based on false signals.
Fibonacci Retracement Not Working? Here’s Why
If Fibonacci retracement isn’t working for you, don’t worry—you’re not alone. One of the main reasons this happens is a lack of practice with identifying the right swing points. To use this tool effectively, you need to pinpoint the proper high and low of a price movement. If these points are off, the retracement levels won’t align with actual market behavior.

Another reason is using Fibonacci levels in isolation. The market is influenced by a variety of factors, from technical indicators to fundamentals. If you’re only relying on Fibonacci retracement without context, its effectiveness is reduced. For example, drawing retracement levels on a stock without considering earnings season or major headlines can lead to frustration when price disregards the levels entirely.
Finally, overusing Fibonacci retracement across every market or time frame can dilute its effectiveness. Some assets or time frames respond better to other strategies. For instance, cryptocurrency markets, known for their extreme volatility, may only partly respect Fibonacci levels. Instead of throwing out the tool completely, combine it with other methods and recognize situations where Fibonacci retracement adds value. Adaptation is key!
Fibonacci Retracement and Other Strategies
Fibonacci retracement, when combined with other strategies like RSI, trendlines, or candlestick patterns, helps traders identify high-probability entry and exit points. This combination strengthens decision-making by adding confirmation and reducing the risk of false signals.
Fibonacci Retracement vs Pivot Points
Fibonacci retracement and pivot points are both tools used to identify potential price levels, but they work in different ways. Fibonacci retracement is based on mathematical ratios derived from price movement. It helps you spot pullback levels where an asset might pause or reverse. For example, if a stock rallies from $50 to $100, Fibonacci levels like 38.2% or 61.8% might indicate where the price could retrace before continuing its trend.
On the other hand, pivot points are calculated using the previous period’s high, low, and close. They provide predefined levels for potential support and resistance. Pivot points are especially useful for short-term traders and are recalculated daily, making them more suited for day or swing trading.
The key difference here is that while Fibonacci retracement reacts to a specific price movement, pivot points are more fixed and apply to a broader time frame. Many traders combine both tools to get a clearer picture. For example, if a Fibonacci level aligns with a daily pivot point, it could signal a stronger area of support or resistance.
Fibonacci Retracement vs Trendlines
Trendlines and Fibonacci retracement share a common goal of identifying potential reversal levels, but they take different approaches. Trendlines are drawn by connecting a series of highs or lows on a chart to map out the current direction of the market. They help traders see the bigger picture and confirm the strength of an ongoing trend. For example, in an uptrend, a trendline drawn under rising lows acts as a visual guide for where price corrections might stop.

Fibonacci retracement, on the other hand, focuses on specific ratios of a prior price movement. While trendlines follow a linear path, Fibonacci levels show horizontal ranges where reversals are likely. For example, if price pulls back to the 38.2% retracement but also touches an ascending trendline, it’s a good sign that the level might hold.
Using both tools together can provide powerful insights. Trendlines help you spot the overall direction, while Fibonacci retracement pinpoints more specific zones for trading opportunities within that trend.
Fibonacci Retracement vs Gann Levels
Fibonacci retracement and Gann levels are both mathematical tools, but they are rooted in different theories. Fibonacci retracement is built on ratios like 38.2% and 61.8%, derived from the Fibonacci sequence. These levels act as guides to where price might retrace and find support or resistance.
Gann levels, however, are based on time and geometry. Developed by W.D. Gann, this method combines angles drawn on charts with specific price ranges to predict turning points. Gann’s 50% retracement level is one of the most common overlaps between the two techniques.
One major difference lies in their complexity. Fibonacci retracement is simpler to use and widely recognized, while interpreting Gann levels requires a bit more expertise. However, some traders find that combining the two enhances accuracy. For instance, if a Gann angle aligns with a key Fibonacci level, it increases the chance that price might react in that area.

Fibonacci Retracement vs MACD
Fibonacci retracement and MACD (Moving Average Convergence Divergence) serve different purposes in technical analysis. Fibonacci retracement identifies price levels where reversals or bounces are likely based on prior swings. It’s a static tool, meaning the levels don’t change unless the price reaches new highs or lows.
MACD, on the other hand, is a momentum indicator. It focuses on moving averages and helps you gauge whether the market’s trend is strengthening or fading. For example, when the MACD line crosses above the signal line, it’s often a sign of upward momentum.
While Fibonacci retracement pinpoints potential entry or exit levels, MACD helps confirm whether the market is ready to reverse at those levels. For instance, if the price hits the 61.8% retracement level and the MACD shows a bullish crossover, the two signals combined make a stronger case for an upward reversal.
Both tools shine in different aspects of trading, but when used together, they allow you to not only spot price zones but also confirm whether the market is supporting your hypothesis.
Fibonacci Retracement for Different Trading Styles
While Fibonacci retracement levels work across trading styles, the key is to adapt them to your time frame and goals. By understanding how Fibonacci retracement complements each trading style, you can better integrate this powerful tool into your strategy.
Fibonacci Retracement for Swing Trading
Swing trading is all about capturing medium-term price moves, usually lasting a few days to weeks. Fibonacci retracement fits well with this style because it helps identify strong pullback levels during these trends. When you’re swing trading, the goal is to spot where price might retrace before continuing its direction, and Fibonacci levels like 38.2%, 50%, and 61.8% are perfect for this.
For example, imagine you spot that a stock has rallied from $70 to $100. Rather than jumping in at a random point, you wait for the price to pull back, likely to one of the Fibonacci retracement levels. If the price touches 50% (around $85) and shows signs of bouncing, you might enter the trade, anticipating it will resume its climb. Swing traders often find this useful because it ensures they’re buying during a dip in an uptrend or selling during a bounce in a downtrend.
Pair Fibonacci retracement with other tools like trendlines or RSI to confirm the trend and strengthen your analysis. This approach helps you improve your entry points and increases the odds of catching profitable swings.
Fibonacci Retracement for Scalping Strategies
Scalping involves making quick trades throughout the day to capture small price moves. While Fibonacci retracement is designed for tracking larger trends, it can still be helpful for scalping, especially if you’re trading short time frames like 1-minute or 5-minute charts.
Here’s how it works for scalping. Suppose you spot a mini rally in a forex pair like EUR/USD, and the price climbs 20 pips before pulling back. You plot Fibonacci levels and watch for a retracement to, say, 38.2% of the move. If the price stalls here and shows bullish momentum (like a few green candles in a row), it might signal a quick buying opportunity.

Scalping with Fibonacci retracement requires precision and speed. You’ll often use it alongside other indicators like moving averages or MACD to confirm the market’s direction. Since scalpers aim for small profits, even smaller retracements like 23.6% can provide actionable signals. Keep in mind that the shorter the time frame, the higher the risk of false signals, so practice caution and fast decision-making.
Fibonacci Retracement for Long-Term Investing
Long-term investors tend to focus on broader price trends rather than quick, short-term moves. Fibonacci retracement is valuable to this group as well, particularly when identifying larger pullbacks in a long-term uptrend or downtrend. This helps you determine when to buy into a promising stock or asset at a better price.
Take a scenario where a stock has been in a steady uptrend, climbing from $100 to $200 over several months. It’s natural for price to correct during such a move, and Fibonacci retracement can highlight key levels where the price might stabilize. For instance, if the stock retraces to 50% ($150) and shows signs of support, this might be a great opportunity for a long-term investor to buy in at a discount.
Long-term investors usually combine Fibonacci retracement with fundamentals. If a company reports strong earnings while the price is lingering near a major Fibonacci level, it might further convince you to hold or add to your position. This makes the tool a great addition for timing those larger purchases or evaluating market corrections.
Fibonacci Retracement for Intraday Trading
Intraday traders focus on price movements within the same trading day, aiming to profit from short-term volatility. Fibonacci retracement is particularly effective for identifying quick opportunities to trade reversals or continuations during the day. It helps you spot intraday turning points based on the morning high and low moves.

For example, say a stock rallies strongly when the market opens, from $20 to $25, but then starts to pull back. An intraday trader might use Fibonacci retracement to plot levels like 38.2% or 50%. If the price consolidates at one of these levels and then resumes its climb, it can present a solid opportunity to enter a trade before the trend continues.
Keep in mind that intraday trading relies heavily on timing. Using Fibonacci retracement alongside real-time tools like MACD or stochastic indicators can help confirm trades and reduce the risk of false entries. It’s also important to stay adaptive since intraday markets are fast-moving, and Fibonacci levels might only remain relevant for a short period.
Fibonacci Retracement for Amateur Traders
If you’re new to trading, Fibonacci retracement can be a great tool to help you find potential price levels to enter or exit trades. Amateur traders often feel overwhelmed by the sheer number of charts, indicators, and strategies out there. Fibonacci retracement simplifies this by highlighting natural levels in price movements where reversals or pauses are likely to happen.
For example, imagine you’re trading a stock that’s risen sharply from $50 to $75. Instead of jumping in randomly, you use Fibonacci retracement to identify key pullback levels like 38.2% ($66.45) or 50% ($62.50). When the price reaches these levels and shows signs that it’s holding steady, you might decide to enter the trade, possibly improving your chances of success.

The best part is that Fibonacci retracement is easy to apply on most trading platforms. By practicing with small test trades or demo accounts, amateur traders can quickly get comfortable using this method without taking on too much risk upfront.
Fibonacci Retracement for Small Accounts
When you have a small account, every dollar counts. Overextending your trades or placing incorrect entries can deplete your funds quickly. This is where Fibonacci retracement shines—it helps you trade smarter by offering clearer entry and exit points. Using Fibonacci retracement means you’re relying on logical price levels instead of guessing when to buy or sell.
For example, say you have $500 in your account and are trading shares of a company priced at $10. If the stock rises to $12 and starts to pull back, you can use Fibonacci retracement to pinpoint levels like $11.40 (61.8%) or $11 (50%) as possible entry points. This minimizes the risk of buying in at the top and allows you to catch the stock at a dip, with a higher probability it will resume its upward trend.
Traders with small accounts also benefit from setting stop-loss orders at levels just below the Fibonacci retracement zones. This ensures you limit losses on trades that don’t go as planned. By combining this tool with solid money management, even small accounts can build consistency over time.
Fibonacci Retracement for Non-Professionals
Non-professional traders typically have other commitments and often trade part-time. They need tools that are quick, easy to understand, and effective. Fibonacci retracement fits this need perfectly because it doesn’t require advanced software or constant screen-watching to produce insights.

Say you’re trading part-time and notice that a currency pair, like USD/JPY, has risen sharply from 140.00 to 145.00. You may not have hours to analyze the chart, so you quickly apply Fibonacci retracement to identify levels like 143.09 (38.2%) or 142.50 (50%). If price starts consolidating here when you check later, it indicates a potential buy opportunity for when you return to your charts.
Fibonacci retracement is also adaptable across different time frames. Whether you’re a daily trader or someone who only checks their charts every evening, the tool can align with your schedule. This makes it incredibly useful for non-professionals aiming to trade efficiently without turning it into a full-time effort.
Fibonacci Retracement for New Traders
New traders often face a steep learning curve. Fibonacci retracement offers a structured way to approach trading without making it too complicated. It’s an excellent starting point because it doesn’t rely on subjective interpretation like some other strategies. Instead, it provides predefined levels that can act as guides to help you make more informed decisions.

For example, if you’re just starting and notice that a stock has dropped from $50 to $40, you might use Fibonacci retracement to see levels like 38.2% ($44) or 50% ($45) as zones where the price might bounce. These levels simplify your decision-making and give you a clear idea of where to watch for action.
Even better, Fibonacci retracement pairs well with other beginner-friendly tools like trendlines or moving averages. If you see a Fibonacci level aligning with an upward trendline, it reinforces your decision and boosts your confidence as a new trader. By practicing on demo accounts and learning how to spot these levels, you can gradually improve your trading skills and develop a more disciplined approach.
Fibonacci Retracement Backtesting Strategies
Backtesting is a vital step in mastering Fibonacci retracement. It helps you gauge how well this tool works on the assets you trade, and in what conditions. To begin, choose a past time frame on your preferred asset, whether it’s stocks, forex, or crypto. Look for clear trends followed by pullbacks.
Plot Fibonacci levels on historical price swings and observe how the levels align with real price movements. For instance, was there a significant bounce or reversal at the 61.8% level? Did prices consolidate near the 50% level before resuming their trend? Jot down your findings and document how often Fibonacci retracement successfully predicted turning points.

Combine this exercise with other tools like moving averages or candlestick patterns to see if you can strengthen your predictions. Backtesting also allows you to fine-tune your approach, for example, deciding which levels work best for certain markets. Over time, this practice builds confidence and helps refine your trading strategy for live market scenarios.
Fibonacci Retracement in Live Trading
Using Fibonacci retracement in live trading requires preparation, quick decision-making, and disciplined execution. Once your levels are plotted during a trading session, monitor the price closely as it reacts to these zones. A bounce at a level like 38.2% or 61.8%, confirmed by bullish candlestick patterns or increased buying volume might signal a good entry point.
For example, say you’re trading forex, and EUR/USD retraces to the 50% level after a sharp rally. You notice that the price starts consolidating and volume spikes upward. This combination could indicate that buyers are stepping in, which might be your cue to enter a long position.
It’s vital to set clear stop-loss and take-profit levels before entering the trade. Live trading moves fast, so knowing when to exit is crucial. Pair Fibonacci retracement with real-time indicators like RSI or MACD to confirm whether a price level is likely to hold. Stay flexible and adapt, markets are unpredictable, and not every setup will lead to a perfect trade. By practicing in live markets, you’ll become more attuned to how Fibonacci retracement interacts with the constantly changing dynamics.
Frequently Asked Questions
How to calculate Fibonacci retracement levels?
To calculate Fibonacci retracement levels, identify a significant high and low in the price chart. Subtract the low from the high, then multiply the difference by Fibonacci ratios like 0.236, 0.382, 0.5, 0.618, and 0.786. Add the results to the low or subtract them from the high to find the levels.
How to set up Fibonacci levels?
Use a trading platform’s Fibonacci retracement tool to mark the high and low of a price move. The tool will automatically plot the retracement levels between these points. You can customize the levels based on your strategy if needed.

How to Trade Fibonacci levels?
Trading Fibonacci levels involves watching for price reactions at retracement points like 0.382, 0.5, or 0.618. Look for confirmation signals like candlestick patterns, RSI divergence, or trendlines to validate entries. Use these levels as potential areas for stop-loss and profit-taking.
What is 0.618 in trading?
The 0.618 level represents a 61.8% retracement, derived from the golden ratio in mathematics. It is considered one of the most reliable levels for spotting reversals in trading. Many traders look for strong price reactions at this level to make entry or exit decisions.
What is 0.236 in Fibonacci level?
The 0.236 level reflects a 23.6% retracement, often indicating a shallow pullback in a trend. While less significant than deeper levels, it can signal areas of minor consolidation or support/resistance. Traders often use it alongside other levels for confirmation.
How does Fibonacci retracement work?
Fibonacci retracement works by highlighting key levels where prices may reverse or continue during a correction. These levels are derived from the Fibonacci sequence and are used to predict support and resistance zones. Traders use it to time entries, exits, or stop-loss placements.
What is the best Fibonacci retracement level?
The best level depends on the market trend and your strategy, but 0.382, 0.5, and 0.618 are considered the most reliable. These levels often align with significant support or resistance zones. Traders often monitor price action around these levels for confirmation.
How to use Fibonacci in forex?
To use Fibonacci retracement in forex, identify a major currency pair’s high and low on the chart. Apply the Fibonacci tool to plot retracement levels and watch for price reactions at these points. Combine Fibonacci levels with indicators like MACD or RSI for more robust decision-making.
What are the 7 Fibonacci levels?
The seven Fibonacci levels typically used are 0.236, 0.382, 0.5, 0.618, 0.786, 1.0, and 1.618. Levels above 1.0, such as 1.618, are extensions used to predict potential price targets in a trend continuation. These levels help traders identify possible pullbacks and extensions in price movement.
Wrapping It Up
Fibonacci retracement is a powerful tool that simplifies your trading decisions. Whether you’re in forex trading, crypto trading, or stock market analysis, this tool gives you structured guidance on where the market might move next. Learn how to use Fibonacci retracement in trading with patience and practice. The more you experiment, the better you’ll understand how to apply it effectively. Stay consistent, and over time, you’ll find this tool invaluable in your trading arsenal.
Disclaimer:
This article is for informational purposes only and does not constitute financial advice. Trading forex, stocks, and commodities carries significant risk. Geopolitical events can cause extreme and unexpected market movements. Always verify information from multiple sources.