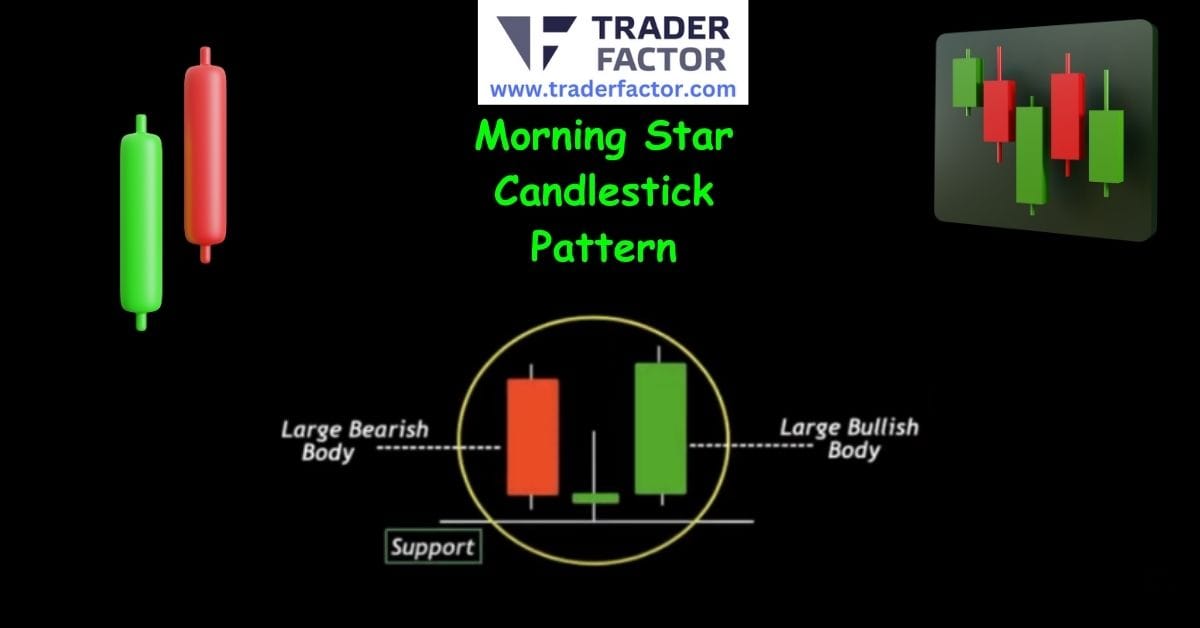

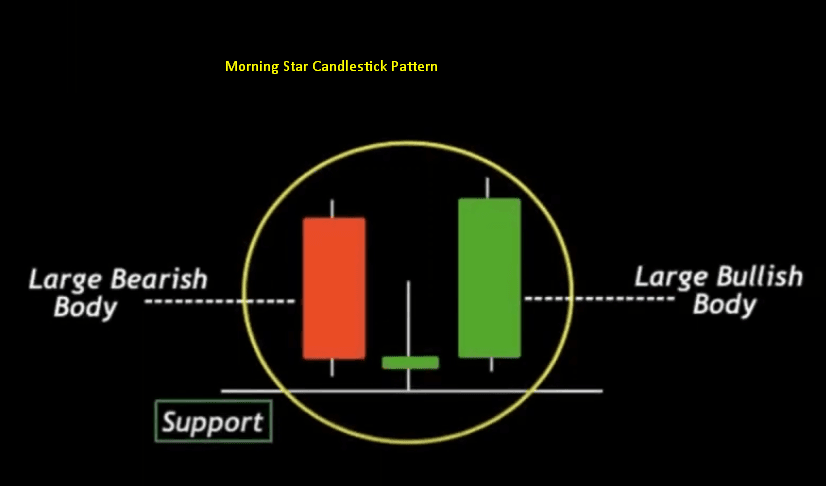
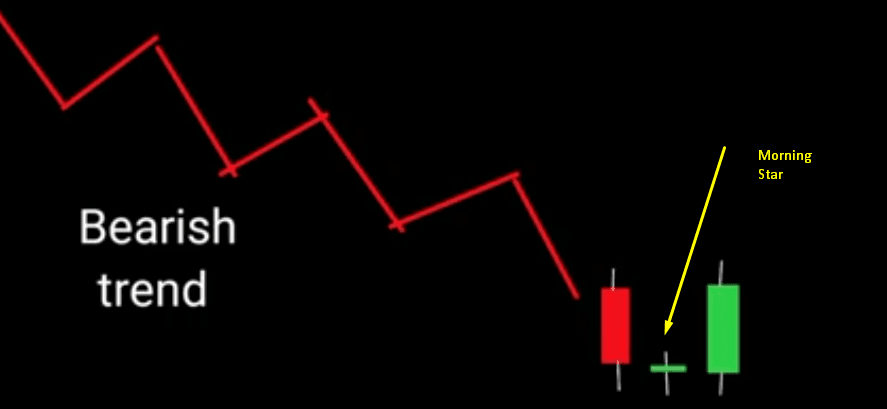
The Morning Star candlestick pattern is a powerful bullish reversal signal that traders use to identify potential turning points in the market after a downtrend. Comprising three distinct candles, this visual formation provides valuable insight into shifting market sentiment, moving from bearish control to bullish momentum. Understanding the basics of this pattern, from its structure to its confirmation, is crucial for anyone looking to enhance their technical analysis skills. Recognizing and effectively trading the Morning Star candlestick pattern can significantly improve your ability to spot profitable entry points.
Understanding the Anatomy of the Morning Star Candlestick Pattern
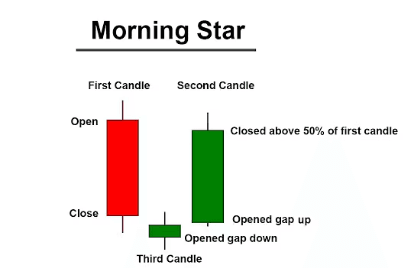
To effectively trade the Morning Star candlestick pattern, you must first understand its components. This formation is not just a random collection of candles; it tells a story of a battle between buyers and sellers where the momentum is shifting. A deep dive into the structure of this bullish three-candlestick pattern is essential for any trader aiming to capitalize on the signals it provides in the financial markets.
The pattern signals that a preceding downtrend may be losing steam and that a new uptrend could be on the horizon.
The First Candle: The Bearish Continuation
The first candle of the Morning Star candlestick pattern is a large, bearish candle that appears during a clear downtrend. This candle signifies that sellers are still firmly in control of the market, pushing prices lower with significant momentum. Its long body indicates a substantial price drop from the open to the close, reinforcing the prevailing negative sentiment. For traders analyzing the market, this initial candle confirms the strength of the existing downtrend, but it also sets the stage for the potential reversal that the complete Morning Star candlestick pattern will signal if the subsequent candles form correctly.
The Second Candle: The Indecision
The second candle in the Morning Star candlestick pattern is the most critical element, representing a moment of indecision and a potential stall in the bearish momentum. This small-bodied candle, which can be bullish, bearish, or neutral (like a Doji), appears after the large bearish candle. It indicates a significant decrease in selling pressure, as the session opens and closes at nearly the same price level. This part of the bullish candlestick reversal pattern shows that sellers are losing their grip, and buyers are beginning to step in, creating a standoff. The presence of this small candle within the Morning Star candlestick pattern is the first real hint that the downtrend is weakening.
Identifying a Valid Morning Star Candlestick Pattern
- Identify a bearish trend.
- Spot the doji candle.
- Spot a bullish continuation candle after the doji.
Spotting a valid Morning Star candlestick pattern requires more than just seeing three candles in a sequence; it involves confirming that the formation meets specific criteria. This bullish visual pattern is a signal of a potential bottom, but its reliability increases when it appears in the correct context and its structure adheres to established guidelines. Misinterpreting this pattern can lead to premature entries and potential losses. Therefore, traders must be diligent in verifying every aspect of the formation before considering it a true Morning Star candlestick pattern.

Context is Key: The Preceding Downtrend
A crucial rule for identifying a genuine Morning Star candlestick pattern is its appearance after a sustained downtrend. The pattern’s significance as a bullish reversal signal is derived from its ability to mark the end of a period of selling pressure. If this formation appears during a sideways market or an uptrend, it loses its predictive power and should not be considered a reliable signal. The preceding decline confirms that there is bearish momentum to reverse, making the emergence of the Morning Star candlestick pattern a noteworthy event that suggests a significant shift in market psychology from bearish to bullish.
Confirming the Reversal: The Third Candle
The third candle of the Morning Star candlestick pattern is the confirmation of the bullish reversal. This candle must be a strong, bullish candle that closes well into the body of the first bearish candle. A strong close, ideally above the midpoint of the first candle’s body, demonstrates that buyers have decisively taken control from sellers. This final candle validates the indecision shown by the second candle and confirms the new upward momentum. Without this strong bullish follow-through, the potential reversal indicated by the initial parts of the Morning Star candlestick pattern remains unconfirmed and is a much weaker signal.

The Psychology Behind the Morning Star Candlestick Pattern
The power of the Morning Star candlestick pattern lies in the market psychology it reveals. This three-candle formation visually represents a transition in sentiment from overwhelming bearishness to emerging bullishness. The first candle shows sellers are confident and in control, driving prices down. The second candle, small and indecisive, represents a pause where the bearish conviction wavers. This is a critical moment of equilibrium. Finally, the third candle, a strong bullish one, shows that buyers have overpowered the sellers, confirming a shift in control and setting the stage for a new uptrend. Understanding this psychological narrative is key to trusting the Morning Star candlestick pattern.
From Bearish Control to Indecision
The initial phase of the Morning Star candlestick pattern is dominated by sellers.
The long bearish candle reflects a market where negative sentiment prevails, and participants expect prices to continue falling. However, the appearance of the second, small-bodied candle signals a dramatic shift. This candle shows that despite the prior momentum, sellers were unable to push the price significantly lower. This hesitation creates a moment of indecision and uncertainty. This part of the Morning Star candlestick pattern is where smart money often starts accumulating positions, anticipating the reversal that is yet to be confirmed.

The Bullish Takeover
The final candle of the Morning Star candlestick pattern signifies a decisive bullish takeover. After the period of indecision represented by the second candle, a large bullish candle emerges, confirming that buyers have seized control. This candle often opens higher than the previous close and pushes prices up significantly, erasing a substantial portion of the losses from the first bearish candle. This strong buying pressure demonstrates a clear and powerful shift in market dynamics. For traders, this third candle is the ultimate confirmation that the reversal is in motion, providing the confidence needed to act on the Morning Star candlestick pattern.

How to Formulate a Trade with the Morning Star Candlestick Pattern
Developing a trading strategy around the Morning Star candlestick pattern formula involves more than just identifying the pattern. You need a clear plan for entry, stop-loss placement, and profit targets. A well-defined strategy helps manage risk and maximizes the potential reward from the bullish reversal this pattern signals. Simply entering a trade upon seeing the pattern is not enough; a systematic approach is necessary to consistently profit from the opportunities presented by the Morning Star candlestick pattern.
Entry Strategy After Pattern Confirmation
A common entry strategy is to place a buy order after the third candle of the Morning Star candlestick pattern has closed. Waiting for the close of this bullish confirmation candle ensures that the reversal signal is complete and valid. Some aggressive traders might enter during the formation of the third candle, but this carries higher risk as the candle could fail to close strongly. A more conservative approach is to wait for the price to break above the high of the third candle, providing an additional layer of confirmation that the new upward momentum is sustainable. This disciplined entry is a core part of trading the Morning Star candlestick pattern successfully.

Setting Your Stop-Loss and Take-Profit Levels
Proper risk management is crucial when trading the Morning Star candlestick pattern. A logical place to set a stop-loss is just below the low of the entire pattern, which is typically the low of the second candle. Placing the stop-loss here protects your trade against a failed reversal, where the price drops back down instead of continuing upward. For take-profit targets, you can look for previous resistance levels or use a risk-to-reward ratio, such as 2:1 or 3:1. This structured approach to managing your trade ensures you protect your capital while aiming for realistic gains when the Morning Star candlestick pattern plays out as expected.
The Morning Star Candlestick Pattern in Different Markets
The Morning Star candlestick pattern is a versatile tool that can be applied across various financial markets, including forex, stocks, commodities, and cryptocurrencies. Its effectiveness stems from the fact that it reflects universal market psychology, the shift from selling pressure to buying pressure. Regardless of the asset being traded, this pattern can provide valuable clues about potential trend reversals. However, traders should always consider the specific volatility and characteristics of the market they are trading when interpreting the Morning Star candlestick pattern.

Application in Forex Trading
In the forex market, the Morning Star candlestick pattern is a widely used signal for identifying potential bottoms in currency pairs. Given the high liquidity and 24-hour nature of forex, these patterns can form on various timeframes, from intraday charts to daily and weekly charts. A forex trader might spot a Morning Star candlestick pattern on the EUR/USD daily chart after a prolonged downtrend, signaling an opportunity to go long. The principles remain the same: look for the pattern after a clear decline and wait for the confirmation candle before entering a trade.

Use in the Stock Market
Stock traders also frequently use the Morning Star candlestick pattern to spot potential buying opportunities. The pattern can indicate that a stock that has been in a downtrend may be poised for a recovery. For instance, if a tech stock has been declining for several weeks, the appearance of a Morning Star candlestick pattern on the daily chart could signal a reversal. Volume can be a particularly useful confirmation tool in stock trading; an increase in volume on the third bullish candle adds significant weight to the validity of the Morning Star candlestick pattern.
Distinguishing the Morning Star Candlestick Pattern from Other Patterns
To avoid false signals, it’s important to differentiate the Morning Star candlestick pattern from other similar formations. Patterns like the bullish Engulfing or Piercing Line also signal potential reversals, but their structures are different. The Morning Star is unique because of its three-candle structure with the small-bodied second candle gapping down. Mistaking another pattern for a Morning Star, or vice-versa, can lead to flawed analysis and poor trading decisions. A clear understanding of these differences is essential for accurately reading chart signals related to the Morning Star candlestick pattern.

Morning Star vs. Evening Star Pattern
The Evening Star pattern is the direct bearish counterpart to the Morning Star candlestick pattern. While the Morning Star is a bullish reversal signal that appears after a downtrend, the Evening Star is a bearish reversal signal that forms after an uptrend. It consists of a large bullish candle, followed by a small-bodied candle that gaps up, and then a large bearish candle that closes deep into the body of the first candle. The psychology is reversed: from bullish confidence to indecision, followed by a bearish takeover. Recognizing the difference between Morning and Evening Stars is fundamental to technical analysis.

Morning Star vs. Shooting Star Candlestick
The Shooting star candlestick is a single-candle bearish reversal pattern, which makes it distinct from the three-candle Morning Star candlestick pattern. A Shooting Star has a long upper wick, a small lower body, and little to no lower wick, and it appears after an uptrend, signaling a potential top. It indicates that buyers pushed prices up, but sellers ultimately forced them back down. In contrast, the Morning Star candlestick pattern is a bullish signal that forms after a downtrend. Confusing these two could lead a trader to mistakenly prepare for a price drop when a rise is imminent.
The Bullish Morning Star Candlestick Pattern and Confirmation
The bullish Morning Star candlestick pattern is a powerful indicator, but its reliability is significantly enhanced when combined with other forms of technical analysis for confirmation. Relying solely on the pattern itself can be risky, as false signals can and do occur. By seeking additional evidence that supports the bullish reversal, traders can increase their confidence in a trade and improve their odds of success. Using indicators or other chart patterns to confirm the signal from the bullish Morning Star candlestick pattern is a hallmark of a disciplined trading approach.

Using Volume for Confirmation
Volume is an excellent tool for confirming the validity of a bullish Morning Star candlestick pattern. Ideally, volume should decrease on the second candle (the star), reflecting the market’s indecision. Then, on the third candle (the bullish confirmation), volume should increase significantly. This surge in volume indicates strong buying pressure and conviction behind the reversal. A bullish Morning Star candlestick pattern accompanied by this volume signature is a much stronger and more reliable signal than one that forms on low or declining volume.

Combining with Technical Indicators
Pairing the bullish Morning Star candlestick pattern with technical indicators like the Relative Strength Index (RSI) and Moving Average Convergence Divergence (MACD) brings a deeper layer of confirmation to your trading strategy. By blending this bullish candlestick reversal pattern with classic technical analysis tools, you can more confidently filter out false signals and better detect when a true bullish reversal signal is taking shape. This approach is especially valuable for traders seeking high-probability setups in dynamic market conditions.
Using RSI for Confirmation of the Morning Star Candlestick Pattern
When applying RSI to your technical analysis, look for the bullish Morning Star candlestick pattern to form while the RSI is in oversold territory, typically reading below 30. This situation signals that the prevailing trend has likely reached an exhaustion point. If the RSI then begins to turn upward as the three candlesticks of the Morning Star pattern complete, it further confirms that a bullish reversal signal is emerging. For instance, in the forex market, spotting both the Morning Star candlestick pattern and an RSI bounce from oversold levels on EUR/USD after a significant downtrend can strongly suggest that buyers are reclaiming control and that a new uptrend may begin. This layered analysis helps validate the bullish visual pattern and supports traders in making more informed entry decisions.

Leveraging MACD with the Morning Star Candlestick Pattern
The MACD indicator is another powerful ally when trading the Morning Star candlestick pattern. After identifying the three-candlestick formation, check if the MACD line crosses above the signal line—this is a classic bullish crossover and signals growing upward momentum. If this bullish crossover occurs soon after the Morning Star candlestick pattern appears, it’s a strong confirmation that the previous downtrend is reversing. For example, a trader monitoring the stock market might spot the bullish Morning Star candlestick pattern on a daily chart, followed by an MACD bullish crossover the next day. Together, these signals reinforce one another and give extra weight to the probability of a sustained move higher, making this bullish candlestick pattern a more reliable foundation for your trade.

Combining Multiple Indicators for Trend Confirmation
For even greater reliability in confirming a bullish reversal signal, consider combining the Morning Star candlestick pattern with both RSI and MACD, as well as other elements of technical analysis, such as trendlines or moving averages. If the bullish Morning Star candlestick pattern develops at a major support level, the RSI emerges from oversold conditions, and the MACD produces a bullish crossover, the likelihood of a trend reversal greatly increases. This multilayered confirmation can provide a strong foundation for taking a confident position, whether you’re trading forex, stocks, or another asset class. Integrating multiple forms of technical analysis with the Morning Star candlestick pattern sets you up for higher accuracy in identifying powerful market reversals..
Advanced Trading with the Morning Star Candlestick Pattern
Once you have mastered the basics, you can explore advanced techniques for trading the Morning Star candlestick pattern. This involves looking at the pattern’s formation across multiple timeframes or integrating it into more complex trading systems. Advanced trading isn’t about complicating things unnecessarily but about adding layers of analysis to increase precision and filter for higher-probability setups. These methods can help you refine your entries and exits when trading the Morning Star candlestick pattern.

Multi-Timeframe Analysis
A powerful advanced technique is to use multi-timeframe analysis with the Morning Star candlestick pattern. For example, you might identify a Morning Star candlestick pattern on a daily chart, which provides a strong signal for a major trend reversal. You could then zoom into a shorter timeframe, like a 4-hour or 1-hour chart, to look for a more precise entry point. This approach allows you to align a long-term signal with a short-term entry trigger, potentially improving your risk-to-reward ratio and timing.

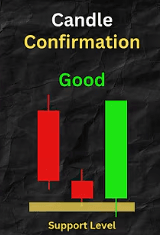
Integrating with Support and Resistance
The Morning Star candlestick pattern becomes an even more potent signal when it forms at a key support level. A support level is a price area where buying pressure has historically been strong enough to halt a decline. When the pattern appears at a well-established support zone, it provides dual confirmation that the level is likely to hold and that a reversal is underway. This confluence of signals—the pattern and the support level—creates a high-probability trading setup based on the Morning Star candlestick pattern.
Pitfalls to Avoid When Trading the Morning Star Candlestick Pattern
While the Morning Star candlestick pattern is a reliable bullish signal, there are several common pitfalls that traders should avoid. Ignoring market context, trading the pattern in isolation, or failing to use proper risk management can turn a promising setup into a losing trade. Being aware of these potential mistakes is the first step toward avoiding them. A disciplined and cautious approach will always serve you better when trading the Morning Star candlestick pattern.

Ignoring the Overall Market Context
One of the biggest mistakes is trading the Morning Star candlestick pattern without considering the broader market context. If the pattern appears during a very strong, long-term bear market, it may only signal a minor pullback rather than a full-blown reversal. Always assess the primary trend on higher timeframes before acting on a signal. A Morning Star candlestick pattern that forms in alignment with a potential bottom on a weekly or monthly chart is far more significant than one that appears in isolation on a 15-minute chart.

Acting Before Confirmation
Another common error is entering a trade before the Morning Star candlestick pattern is fully formed and confirmed. Some traders, fearing they will miss the move, jump in during the formation of the second or third candle. This is premature and risky because the pattern can easily fail to complete. You must wait for the third bullish candle to close strongly, confirming the buyers’ control. Patience is a virtue in trading, and waiting for confirmation is a critical part of a successful strategy involving the Morning Star candlestick pattern.
Reviewing the Morning Star Candlestick Bearish Scenario
While primarily a bullish reversal pattern, it’s important to understand the Morning Star candlestick bearish scenario, which is when the pattern fails. A failed Morning Star occurs when, after the three candles form, the price does not continue upward but instead reverses and breaks below the pattern’s low. This failure is a bearish signal in itself, indicating that the attempt to reverse the downtrend was rejected and sellers have regained control. Recognizing a failed Morning Star candlestick bearish scenario allows traders to quickly exit long positions or even consider entering a short trade.

What a Failed Pattern Indicates
A failed Morning Star candlestick pattern suggests that the initial buying pressure was not strong enough to sustain a reversal. When the price breaks below the low of the star candle, it invalidates the bullish signal. This failure often indicates that the underlying downtrend is very strong and is likely to continue. Traders who entered a long position should view this as a clear signal to exit and cut their losses. The Morning Star candlestick bearish failure is a powerful reminder that no pattern is foolproof.

How to Trade a Pattern Failure
You can trade a Morning Star candlestick bearish failure by placing a short-sell order once the price breaks decisively below the low of the pattern. The stop-loss for this trade would be placed above the high of the third candle. This strategy capitalizes on the renewed bearish momentum after the bullish reversal attempt has been thwarted. Trading pattern failures can be a profitable counter-trend strategy, but it requires quick recognition and disciplined execution when a Morning Star candlestick pattern does not play out as expected.
Conclusion
In summary, the Morning Star candlestick pattern is an invaluable tool for traders seeking to identify bullish reversals at the end of a downtrend. This three-candle formation provides a clear visual representation of shifting market sentiment from bearish to bullish. By understanding its structure, the psychology behind it, and the importance of confirmation through volume or other indicators, you can effectively integrate this pattern into your trading strategy. Ultimately, mastering the art of identifying and trading the Morning Star candlestick pattern can significantly enhance your ability to spot high-probability entry points and improve your overall trading performance.

What is a Morning Star Pattern?
A Morning Star is a bullish, three-candle reversal pattern that appears at the bottom of a downtrend. It signals a potential shift from bearish to bullish momentum.
What does the morning star candlestick mean?
It means that a preceding downtrend is losing strength and that buyers are starting to take control. The pattern suggests a potential price bottom and an upcoming uptrend.
What are the rules for morning star?
The pattern must appear after a clear downtrend. It consists of a large bearish candle, a small-bodied candle that gaps down, and a large bullish candle that closes well into the first candle’s body.

How to read Morning Star?
You read it as a story of a power shift: sellers are in control (first candle), then indecision sets in (second candle), and finally, buyers take over (third candle). This sequence signals a likely reversal.
What is the morning star used for?
The Morning Star is used by traders to identify potential buying opportunities. It helps signal the end of a downtrend and the potential start of a new uptrend.
How do you confirm a Morning Star pattern?
You can confirm it by waiting for the third bullish candle to close strongly. Additional confirmation can come from an increase in trading volume or from other technical indicators like the RSI or MACD.
How accurate is the Morning Star?
No pattern is 100% accurate, but the Morning Star is considered one of the more reliable reversal patterns. Its accuracy increases when it appears at a key support level and is confirmed by other indicators.

Does a Morning Star always mean a reversal?
No, it doesn’t always guarantee a reversal. The pattern can fail, especially in a very strong downtrend, so using stop-losses and seeking confirmation is crucial.
What is the psychology behind the Morning Star?
The psychology is a transition from bearish confidence to market indecision, and finally to a bullish takeover. It shows a battle where sellers lose their momentum and buyers gain control.
What does a Morning Star tell traders?
It tells traders that selling pressure is diminishing and that a trend reversal to the upside is likely. It serves as a signal to look for potential long (buy) entry points.
Disclaimer:
All information has been prepared by TraderFactor or partners. The information does not contain a record of TraderFactor or partner’s prices or an offer of or solicitation for a transaction in any financial instrument. No representation or warranty is given as to the accuracy or completeness of this information. Any material provided does not have regard to the specific investment objective and financial situation of any person who may read it. Past performance is not a reliable indicator of future performance.