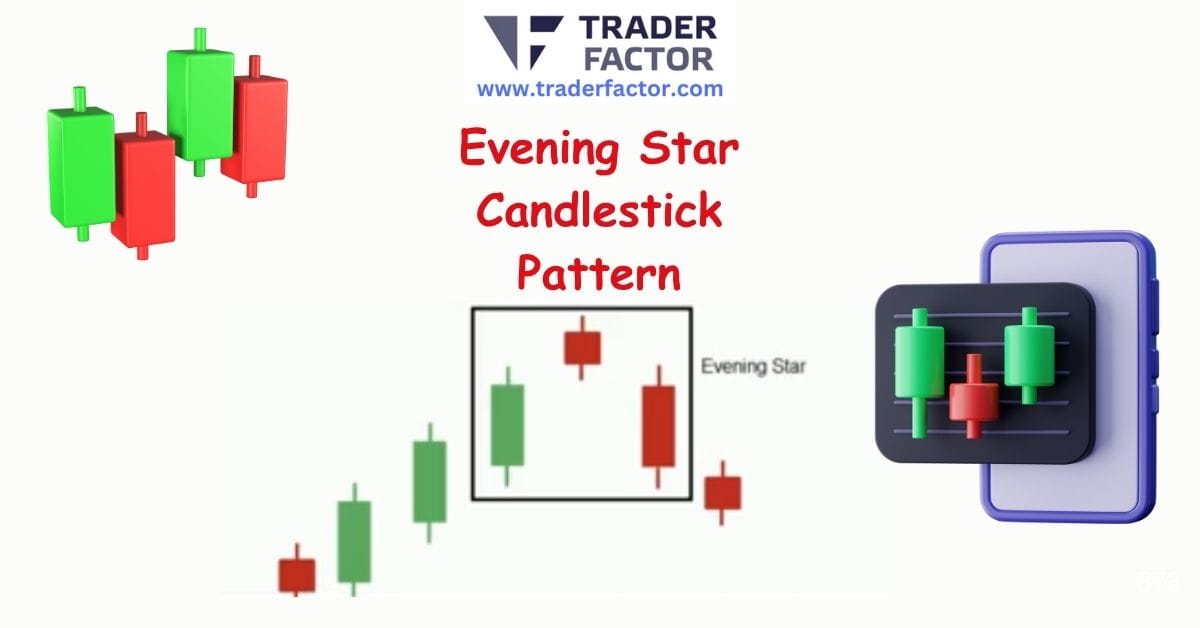

The Evening Star candlestick pattern is a widely recognized bearish reversal signal that technical analysts use to identify potential turning points at the peak of an uptrend. This formation, composed of three distinct candles, offers a visual narrative of market sentiment shifting from bullish dominance to bearish control, signaling that upward price momentum’s reversal to bearish momentum may be imminent. For traders aiming to refine their technical skills, learning to spot and act on the signals provided by the Evening Star candlestick pattern is an essential step toward anticipating market tops.
Understanding the Structure of the Evening Star Candlestick Pattern
This pattern is not simply three random candles; it’s a powerful story about a shift in market control from buyers to sellers. The complete formation is a strong bearish reversal pattern that suggests a preceding uptrend is losing its strength and a new downtrend is likely to begin. A thorough understanding of this bearish reversal candlestick pattern consisting of three candles is foundational for any trader looking to capitalize on the bearish opportunities it presents.
To effectively trade the Evening Star candlestick pattern, you must first grasp its underlying structure.
The First Candle: Bullish Momentum
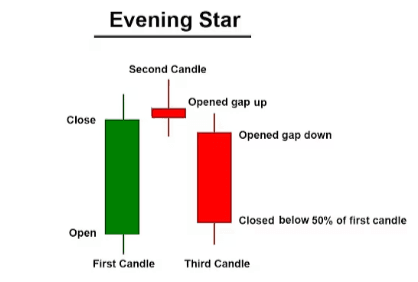
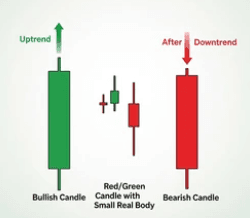
The initial candle in the Evening Star candlestick pattern is a large, bullish candle that forms during a clear and established uptrend. This candle reflects strong buying pressure, with a long body indicating that buyers are confidently pushing the price higher, reinforcing the prevailing positive market sentiment. For traders analyzing the charts, this first candle confirms the strength of the existing uptrend but also sets the stage for the potential reversal. The proper formation of the subsequent candles is crucial for the Evening Star candlestick pattern to be considered a valid signal.
The Second Candle: A Moment of Indecision
The second candle is the pivotal point of the Evening Star candlestick pattern, representing a pause or moment of indecision in the market. This small-bodied candle, which can be bullish, bearish, or a neutral Doji, typically gaps up from the close of the first candle. This component shows that despite the prior bullish momentum, buyers were unable to continue pushing the price significantly higher. This stall in buying pressure within the Evening Star candlestick pattern is the first concrete warning that the uptrend is losing steam and sellers are beginning to challenge the buyers’ control.

How to Correctly Identify the Evening Star Candlestick Pattern
The pattern’s predictive power is greatest when it appears in the right market context and its structure is clearly defined. Misinterpreting this formation can lead to poorly timed short entries and unnecessary losses, so traders must be meticulous in confirming every aspect before considering it a true Evening Star candlestick pattern.
Identifying a valid Evening Star candlestick pattern involves more than just recognizing the three-candle sequence; it requires a strict adherence to specific criteria to ensure its reliability as a bearish signal.
The Importance of a Preceding Uptrend
A fundamental rule for identifying an authentic Evening Star candlestick pattern is its appearance after a sustained uptrend. The pattern’s significance as a bearish reversal signal comes from its ability to mark the exhaustion of buying pressure. If this formation were to appear in a ranging or sideways market, it would carry little to no predictive weight and should be disregarded. The preceding uptrend confirms there is bullish momentum to reverse, making the emergence of the Evening Star candlestick pattern a noteworthy event suggesting a significant psychological shift from bullish to bearish sentiment.
The Third Candle: The Bearish Confirmation
The third and final candle of the Evening Star candlestick pattern serves as the bearish confirmation. This candle must be a large, bearish candle that opens below the previous day’s close and closes well into the body of the first bullish candle, ideally below its midpoint. This strong downward move demonstrates that sellers have decisively seized control from the buyers, validating the indecision shown by the second candle. Without this powerful bearish follow-through, the potential reversal suggested by the initial stages of the Evening Star candlestick pattern remains unconfirmed and represents a much weaker trading signal.

The Market Psychology Driving the Evening Star Candlestick Pattern
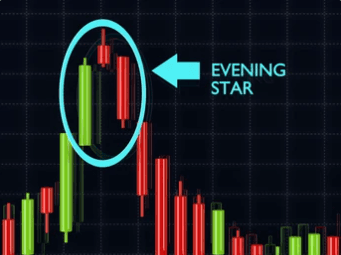
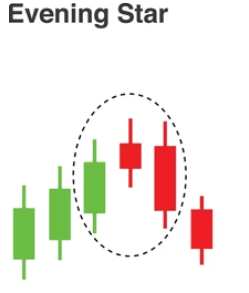
The effectiveness of the Evening Star candlestick pattern is rooted in the clear market psychology it illustrates. This three-candle formation visually depicts a transfer of power from confident buyers to determined sellers. The first candle shows a market dominated by bullish enthusiasm. The second, small candle signals a crack in that confidence, a moment of equilibrium where buying pressure stalls. The third, a strong bearish candle, confirms that sellers have overwhelmed the buyers, completing the narrative and setting the stage for a new downtrend. Grasping this psychological shift is key to trading the Evening Star candlestick pattern with conviction.
From Bullish Confidence to Market Indecision
The initial phase of the Evening Star candlestick pattern is defined by bullish control.
The long green candle reflects a market where positive sentiment prevails, and traders expect prices to continue their ascent. However, the emergence of the second, small-bodied candle indicates a dramatic change.
It shows that despite the previous upward momentum, buyers lacked the conviction to push prices further. This hesitation creates a critical moment of indecision, where the established uptrend is questioned. This part of the Evening Star candlestick pattern is often where informed traders begin to anticipate the coming reversal.

The Decisive Bearish Takeover
The final candle of the Evening Star candlestick pattern signifies a conclusive takeover by the bears. Following the period of uncertainty represented by the second candle, a large red candle forms, confirming that sellers have successfully wrestled control from the buyers. This candle often gaps down from the previous close and drives prices significantly lower, erasing a substantial portion of the gains from the first bullish candle. This strong selling pressure is the ultimate confirmation of the reversal, providing traders with the confidence to act on the signal provided by the Evening Star candlestick pattern.

Formulating a Trade with the Evening Star Candlestick Pattern
Developing a robust trading plan using the Evening Star candlestick pattern formula involves defining clear rules for entry, stop-loss, and take-profit levels. A well-structured strategy is essential for managing risk and maximizing the potential profit from the bearish reversal this pattern signals. Simply shorting the market as soon as you see the formation is a recipe for inconsistency. A systematic approach to the Evening Star pattern entry is necessary to effectively trade the opportunities presented by the Evening Star candlestick pattern.

Entry Strategy After Pattern Confirmation
A common entry strategy is to place a sell order after the close of the third bearish candle of the Evening Star candlestick pattern. Waiting for this confirmation candle to close ensures that the bearish reversal signal is complete and validated. More aggressive traders might enter during the formation of the third candle, but this carries a higher risk because the candle could fail to close strongly bearish. A more conservative evening star pattern entry is to wait for the price to break below the low of the third candle, which provides an extra layer of confirmation that the new downward momentum is real and sustainable.
Setting Your Stop-Loss and Take-Profit
Effective risk management is paramount when trading the Evening Star candlestick pattern. A logical location for a stop-loss order is just above the high of the entire pattern, which is usually the high of the second (star) candle. Placing the stop-loss here protects your trade if the reversal fails and the price moves back up. For take-profit targets, you can identify previous support levels or use a predefined risk-to-reward ratio, such as 2:1. This methodical approach to trade management helps protect your capital while aiming for realistic profits when the Evening Star candlestick pattern unfolds as anticipated.

The Evening Star Candlestick Pattern Across Different Markets
The Evening Star candlestick pattern is a versatile technical tool applicable across numerous financial markets, including forex, stocks, cryptocurrencies, and commodities. Its universal relevance comes from the fundamental market psychology it represents—the transition from buying pressure to selling pressure. Regardless of the asset being analyzed, this formation can offer valuable insights into potential trend reversals. However, you should always account for the specific volatility and characteristics of each market when interpreting the Evening Star candlestick pattern.

Application in Forex Trading
In the highly liquid forex market, the Evening Star candlestick pattern is a frequently used signal for identifying potential tops in currency pairs. Because forex trades around the clock, these patterns can appear on various timeframes, from short-term intraday charts to long-term daily and weekly charts. A forex trader might spot an Evening Star candlestick pattern on the GBP/JPY daily chart after a prolonged rally, signaling an opportunity to go short. The core principles of identification and confirmation remain constant when applying this pattern to currency trading.
Usage in the Stock Market
Stock traders often rely on the Evening Star candlestick pattern to spot potential selling or shorting opportunities. The pattern can indicate that a stock that has been rallying may be due for a correction or a reversal. For example, if a popular stock has been in a strong uptrend for several weeks, the appearance of an Evening Star candlestick pattern on its daily chart could signal a prime time to exit a long position or initiate a short one. Volume analysis is particularly useful here; an increase in volume on the third bearish candle adds significant credibility to the reversal signal from the Evening Star candlestick pattern.

Differentiating the Evening Star Candlestick Pattern from Similar Formations
To trade effectively and avoid false signals, it is crucial to distinguish the Evening Star candlestick pattern from other candlestick patterns that may appear similar. For instance, a Shooting star candlestick pattern also signals a bearish reversal, but it is a single-candle formation. Confusing these patterns can lead to flawed analysis and poor trading decisions. A clear understanding of these nuances is essential for accurately interpreting chart signals and successfully trading the Evening Star candlestick pattern.

Evening Star vs. Morning Star Candlestick Pattern
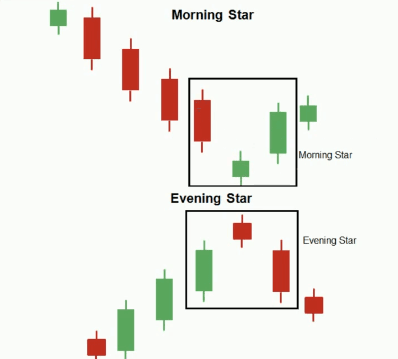
The Morning Star candlestick pattern is the direct bullish counterpart to the Evening Star candlestick pattern. The morning star and evening star candlestick pattern are both three-candle reversal patterns, but they signal opposite moves. While the Evening Star appears at the top of an uptrend and signals a bearish reversal, the Morning Star pattern forms at the bottom of a downtrend and signals a bullish reversal. Knowing the difference between these two is fundamental, and it’s useful to learn how to trade the Morning and Evening Star candlestick patterns as a pair of opposing signals.
Evening Star vs. Shooting Star Candlestick Pattern
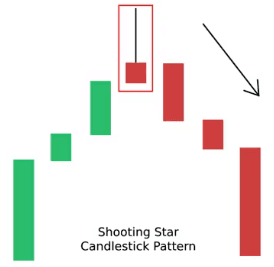
The Shooting star candlestick pattern is a single-candle bearish reversal pattern, which distinguishes it from the three-candle Evening Star candlestick pattern.
A Shooting Star has a long upper wick, a small lower body, and appears after an uptrend, indicating that buyers tried to push the price up but were overwhelmed by sellers. While both signal potential tops, the three-candle structure of the Evening Star candlestick pattern is generally considered a more robust and conclusive signal of a trend change than the single Shooting star candlestick pattern.

Confirmation Techniques for the Evening Star Candlestick Pattern
While the Evening Star candlestick pattern is a powerful bearish indicator, its reliability increases significantly when confirmed with other technical analysis tools. Relying on the pattern in isolation can be risky, as false signals are always a possibility in trading. By seeking complementary evidence that supports the bearish reversal, you can filter for higher-probability setups and trade with greater confidence. Using indicators to confirm the signal from the Evening Star candlestick pattern is a key practice of disciplined traders.

Using Volume as a Confirmation Tool
Trading volume provides excellent confirmation for the validity of an Evening Star candlestick pattern. Ideally, volume on the first bullish candle should be strong, reflecting the uptrend. The volume might decrease on the second candle (the star), showing indecision. Most importantly, volume should increase significantly on the third bearish candle, indicating strong selling pressure and conviction behind the reversal. An Evening Star candlestick pattern that is accompanied by this specific volume signature is a much stronger and more reliable bearish signal.
Combining with Technical Indicators
Pairing the Evening Star candlestick pattern with momentum indicators like the Relative Strength Index (RSI) or Moving Average Convergence Divergence (MACD) can offer powerful confirmation. For example, if the pattern forms while the RSI is in overbought territory (above 70) and is starting to turn down, it strongly reinforces the bearish reversal signal. Similarly, a bearish crossover on the MACD shortly after the pattern’s completion provides another layer of evidence that momentum is shifting downwards. Using these tools helps validate the signal from the Evening Star candlestick pattern.

Advanced Strategies for Trading the Evening Star Candlestick Pattern
Once you are comfortable with the basics, you can begin to explore advanced strategies for trading the Evening Star candlestick pattern. This involves integrating the pattern with other technical concepts like key resistance levels or analyzing its formation across multiple timeframes. These advanced methods are designed to increase the precision of your entries and improve the overall quality of the trading setups you take based on the Evening Star candlestick pattern.

Multi-Timeframe Analysis Approach
A powerful advanced technique is to apply multi-timeframe analysis to the Evening Star candlestick pattern. For example, you might identify a clear Evening Star candlestick pattern on a daily chart, which signals a major potential trend reversal. You can then drill down to a lower timeframe, such as a 4-hour or 1-hour chart, to pinpoint a more precise entry for your short trade. This approach allows you to align a major bearish signal on a higher timeframe with a tactical entry on a lower timeframe, potentially improving your risk-to-reward ratio.
Integrating with Resistance Levels
The Evening Star candlestick pattern becomes an even more formidable signal when it forms at a major resistance level. A resistance level is a price area where selling pressure has historically been strong enough to stop an advance. When the pattern appears at a well-established resistance zone, it provides a dual confirmation that the level is likely to hold and a reversal is imminent. This confluence of signals—the resistance level and the pattern itself—creates a high-probability shorting opportunity based on the Evening Star candlestick pattern.

Common Mistakes When Trading Evening Star Candlestick Pattern
While the Evening Star candlestick pattern is a reliable tool, traders can fall into several common traps that undermine its effectiveness. Some of the most frequent errors include ignoring the broader market context, trading the pattern without sufficient confirmation, or using poor risk management. Being aware of these common mistakes when trading evening star candlestick pattern is the first step toward avoiding them and improving your trading outcomes when you encounter this powerful bearish signal.

Ignoring the Overall Market Context
One of the most significant mistakes is trading an Evening Star candlestick pattern without considering the primary trend on higher timeframes. If a major long-term bull market is in effect, an Evening Star on a lower timeframe might only signal a temporary pullback rather than a full-blown trend reversal. Always assess the broader market context before acting on a signal. An Evening Star candlestick pattern that forms in alignment with overbought conditions on a weekly or monthly chart is far more significant than one appearing in isolation on an intraday chart.
Acting Before Full Pattern Confirmation
Another frequent error is entering a trade before the Evening Star candlestick pattern has been fully formed and confirmed. Anxious not to miss the move, some traders will jump into a short position during the formation of the second or third candle. This is a premature and high-risk action because the pattern could easily fail to complete as expected. You must exercise patience and wait for the third bearish candle to close strongly, confirming that sellers are firmly in control before committing to a trade based on the Evening Star candlestick pattern.

Understanding a Failed Evening Star Candlestick Pattern
While it is a strong bearish reversal pattern, it is crucial to understand what happens when an Evening Star candlestick pattern fails. A failed pattern occurs when, after the three candles have formed, the price does not continue downward but instead reverses and breaks above the pattern’s high. This failure is a bullish signal in its own right, indicating that the attempt to reverse the uptrend was rejected and buyers have reasserted their control. Recognizing a failed Evening Star candlestick pattern allows you to quickly exit short positions to avoid significant losses.

What a Failed Pattern Signals
A failed Evening Star candlestick pattern suggests that the initial selling pressure was not powerful enough to overcome the underlying bullish momentum. When the price breaks above the high of the star candle, it invalidates the bearish signal entirely. This failure often indicates that the underlying uptrend is exceptionally strong and is likely to continue its upward trajectory. Traders who entered a short position should see this as a clear signal to exit the trade immediately. This scenario highlights why no pattern is foolproof and risk management is critical when trading the Evening Star candlestick pattern.

How to Trade a Pattern Failure
You can actually trade the failure of an Evening Star candlestick pattern by placing a long (buy) order once the price breaks decisively above the high of the pattern. The stop-loss for such a trade would be placed below the low of the third candle. This counter-strategy capitalizes on the renewed bullish momentum after the bearish reversal attempt has been soundly defeated. Trading pattern failures can be a profitable approach, but it requires swift recognition and disciplined execution when an Evening Star candlestick pattern does not behave as expected.
Conclusion
To conclude, the Evening Star candlestick pattern is an essential tool for any trader looking to identify bearish reversals at the conclusion of an uptrend. This three-candle formation offers a clear and reliable visual of market sentiment shifting from bullish to bearish. By understanding its structure, the psychology behind it, and the critical importance of confirmation through volume or other technical indicators, you can effectively incorporate it into your trading arsenal. Mastering the ability to identify and trade the Evening Star candlestick pattern can significantly sharpen your ability to spot high-probability shorting opportunities and protect profits.

Is the evening star bullish or bearish?
The Evening Star is a strong bearish reversal pattern. It appears at the top of an uptrend and signals a potential shift to a downtrend.
How to confirm evening star pattern?
Confirm the pattern by waiting for the third bearish candle to close strongly. Additional confirmation can be gained from high volume on the third candle or overbought signals on indicators like the RSI.
How accurate is the evening star pattern?
While no pattern is 100% accurate, the Evening Star is considered a highly reliable bearish reversal signal. Its accuracy increases when it forms at a key resistance level and is confirmed by other factors.
How to trade an evening star candlestick?
To trade it, enter a short (sell) position after the third candle closes. Place a stop-loss above the high of the pattern and set a take-profit target at a previous support level.

How often does the evening star pattern occur?
The pattern is relatively common but requires a clear uptrend to be valid. Its frequency depends on the market and timeframe you are trading, appearing less often on higher timeframes.
Do I buy when it’s bullish or bearish?
You do not buy on an Evening Star pattern, as it is a bearish signal. The pattern suggests it is time to consider selling or entering a short position.
How to tell if something is bullish or bearish?
Bullish means prices are expected to rise, often indicated by upward trends and patterns like the Morning Star. Bearish means prices are expected to fall, indicated by downtrends and patterns like the Evening Star.
Is morning star bullish or bearish?
The Morning Star pattern is bullish. It is the direct opposite of the Evening Star and signals a potential bottom and reversal to an uptrend.
What is the evening star indicator on Tradingview?
On TradingView, the “Evening Star” is an automated pattern recognition indicator. It automatically scans charts and highlights when an Evening Star candlestick pattern has formed, saving traders manual effort.
Disclaimer:
All information has been prepared by TraderFactor or partners. The information does not contain a record of TraderFactor or partner’s prices or an offer of or solicitation for a transaction in any financial instrument. No representation or warranty is given as to the accuracy or completeness of this information. Any material provided does not have regard to the specific investment objective and financial situation of any person who may read it. Past performance is not a reliable indicator of future performance.