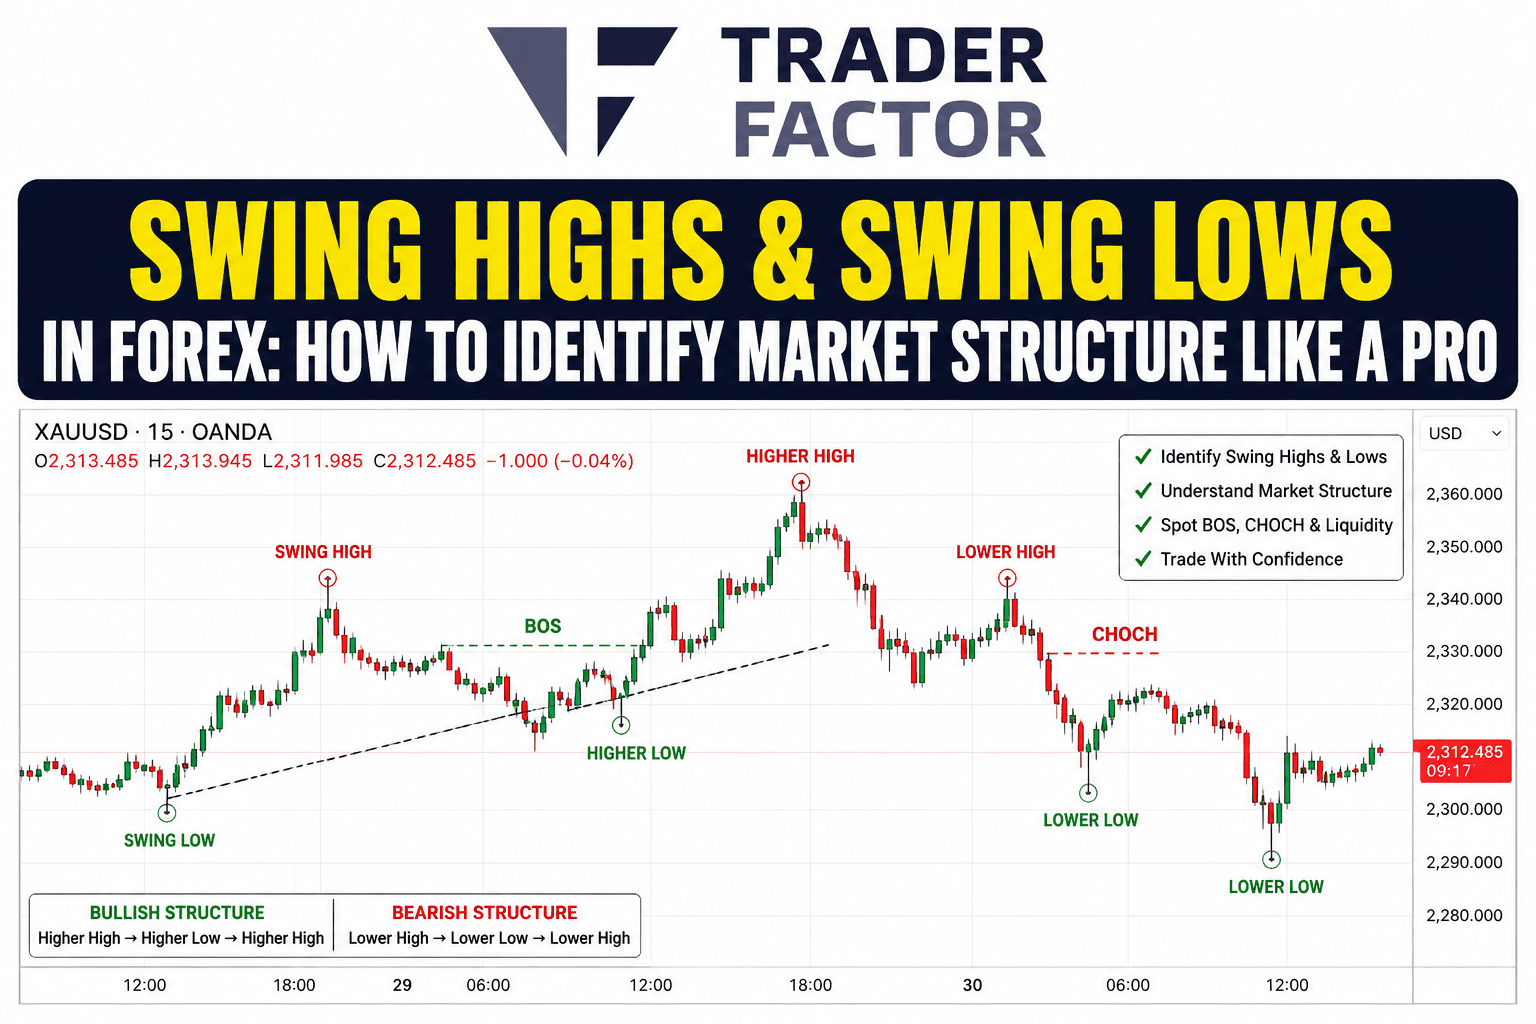

Swing Highs and Swing Lows in Forex explained: learn market structure, HH, HL, LH, LL, BOS and CHoCH for smarter trading decisions today!
🔥 CUT YOUR FOREX TRADING COSTS
High spreads can eat into your trading results.
Compare brokers offering competitive spreads, different account types and trading conditions.
✓ Compare spreads ✓ Account types ✓ Trading costs
Key Takeaways: Swing Highs and Swing Lows in Forex
- Swing Highs mark local price peaks.
- Swing Lows mark local price bottoms.
- Bullish structure forms HH and HL.
- Bearish structure forms LH and LL.
- Focus on swings that create displacement or break structure.
- Use wicks to mark exact swing levels.
- Liquidity often sits above highs and below lows.
- Combine swings with BOS, CHoCH, FVGs and order blocks.
Swing Highs and Swing Lows in Forex: How to Identify Market Structure Like a Pro
Understanding swing highs and swing lows in forex is one of the most important skills a trader can develop.
Before traders can correctly identify a higher high, higher low, lower high, lower low, Break of Structure (BOS), Change of Character (CHoCH), liquidity sweep, order block or market structure shift, they first need to know where the genuine swing points are.
Swing highs and swing lows reveal how price is moving from one important turning point to another. They help traders determine whether the forex market is bullish, bearish or ranging.
More importantly, they provide the structural framework used in price action trading, Smart Money Concepts (SMC), ICT trading, supply and demand, support and resistance and institutional order-flow analysis.
In this guide, we explain exactly what swing highs and swing lows are, how to identify them correctly and how traders can use them to read forex market structure.
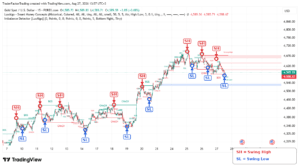
Swing highs are price peaks where buyers lose momentum and price turns lower, while swing lows are troughs where sellers lose momentum and price turns higher.
On this XAUUSD 15-minute chart, the major swing high is around 4660–4670, while the recent swing low is around
4570–4580, with stronger structural support near 4530–4540.
Focus mainly on swings that cause a clear BOS, CHoCH, strong displacement, or major reaction rather than every small candle fluctuation.
What Is a Swing High in Forex?
A swing high is a price level where an upward move temporarily ends and price begins moving lower.
It represents a local peak in the market.
At its simplest, a swing high occurs when a candle’s high is higher than the highs of the candles immediately surrounding it.
For example:
               Swing High
                    ▲
                   / \
                  /   \
                 /     \
                /       \
           Price         Price
           rises         falls
A simple three-candle swing high would look like this:
           Candle 2
              ▲
             ███
        ███  ███  ███
        ███  ███  ███
         1    2    3
Candle 2 has a higher high than Candle 1 and Candle 3.
Therefore, the high of Candle 2 can be classified as a swing high.
Simple Swing High Rule
A swing high generally requires:
High of middle candle > High of previous candle
and
High of middle candle > High of following candle
The actual swing-high price is normally measured from the highest wick, not the candle body.
What Is a Swing Low in Forex?
A swing low is the opposite.
It occurs when a downward price move temporarily ends and buyers push the market higher.
It represents a local bottom.
           Price         Price
           falls         rises
                \       /
                 \     /
                  \   /
                   \ /
                    ▼
                Swing Low
Using a three-candle structure:
         1    2    3
        ███  ███  ███
        ███  ███  ███
             ███
              ▼
          Swing Low
The middle candle has a lower low than both neighbouring candles.
Simple Swing Low Rule
A swing low generally requires:
Low of middle candle < Low of previous candle
and
Low of middle candle < Low of following candle
Again, the lowest wick normally determines the exact swing-low price.
Swing High vs Swing Low
| Feature | Swing High | Swing Low |
|---|---|---|
| Location | Local price peak | Local price bottom |
| Price movement before | Rising | Falling |
| Price movement after | Falling | Rising |
| Represents | Temporary buyer exhaustion | Temporary seller exhaustion |
| Liquidity often found | Above the high | Below the low |
| SMC terminology | Buy-side liquidity area | Sell-side liquidity area |
| Break can indicate | Bullish continuation | Bearish continuation |
Swing highs and lows become especially useful when they are compared with previous swing points.
That comparison creates market structure.

Why Swing Highs and Swing Lows Matter in Forex Trading
Many traders make the mistake of looking at indicators before understanding price structure.
Indicators can provide useful information, but price itself shows whether buyers or sellers currently control the market.
Swing points allow traders to answer important questions such as:
- Is the market trending upward or downward?
- Has the bullish structure been broken?
- Has bearish momentum started?
- Where is liquidity likely resting?
- Where could a market structure shift occur?
- Which highs or lows are protected?
- Where could price retrace before continuing?
- Where should a stop loss logically be placed?
- Is a breakout genuine or simply a liquidity sweep?
Once swing highs and lows are mapped correctly, many advanced trading concepts become easier to understand.
How Swing Highs and Swing Lows Create Market Structure
Forex markets generally move in waves.
Price expands, retraces, expands again and retraces again.
These movements create swing highs and swing lows.
The relationship between consecutive swings allows traders to classify the market as:
- Bullish
- Bearish
- Ranging

Bullish Market Structure: Higher Highs and Higher Lows
A bullish market generally produces:
Higher High → Higher Low → Higher High → Higher Low
Common abbreviations are:
- HH — Higher High
- HL — Higher Low
Example:
                         HH
                         ▲
                       /   \
                      /     \
             HH      /       \
             ▲      /         HL
            / \    /
           /   \  /
          /     HL
         /
        /
       SL
Suppose EUR/USD moves:
- From 1.1000 to 1.1100
- Retraces to 1.1050
- Rallies to 1.1150
- Retraces to 1.1090
- Rallies toward 1.1200

The structure could be interpreted as:
Swing Low → Swing High → Higher Low → Higher High → Higher Low → Higher High
Buyers remain structurally dominant as long as important higher lows continue holding.
What Is a Higher High?
A higher high occurs when price exceeds the previous significant swing high.
Example:
Previous swing high:
1.1100
New swing high:
1.1150
Because 1.1150 is above 1.1100, price has created a higher high.
A higher high confirms that buyers have successfully pushed price beyond the previous high.
What Is a Higher Low?
A higher low occurs when a pullback remains above the previous significant swing low.
Example:
Previous swing low:
1.1000
New swing low:
1.1050
Since the new low is higher than the previous low, it becomes a higher low.
The higher low is extremely important because it often becomes the structural level buyers need to defend.

Bearish Market Structure: Lower Highs and Lower Lows
A bearish market produces the opposite sequence:
Lower Low → Lower High → Lower Low → Lower High
Abbreviations:
- LL — Lower Low
- LH — Lower High
Example:
       SH
        \
         \
          LH
           \
            \
             LL
              \
               LH
                \
                 \
                  LL
Suppose GBP/USD moves:
- From 1.3000 down to 1.2900
- Retraces to 1.2960
- Falls to 1.2850
- Retraces to 1.2910
- Falls toward 1.2800
The market is producing:
Swing High → Swing Low → Lower High → Lower Low → Lower High → Lower Low
Sellers remain structurally dominant while significant lower highs continue holding.

What Is a Lower High?
A lower high forms when a rally fails below the previous significant swing high.
Example:
Previous swing high:
1.3000
New swing high:
1.2960
The new high is lower, creating a lower high.
Lower highs can provide important sell-side areas during bearish trends.
What Is a Lower Low?
A lower low occurs when price breaks beneath the previous significant swing low.
Example:
Previous swing low:
1.2900
New swing low:
1.2850
This creates a lower low and confirms continued bearish pressure.

The Most Important Rule: Not Every High or Low Is a Structural Swing
This is where many traders become confused.
Charts contain hundreds of small highs and lows.
Technically, many satisfy the basic three-candle swing rule.
However, not every small pivot should be used for major market structure analysis.
Consider:
                   Major Swing High
                         ▲
                       /   \
                     x       x
                    / \     / \
                   x   x   x   x
                  /             \
                 /               \
          Major Swing Low
The small x points represent minor fluctuations.
They may technically qualify as short-term swing highs or lows, but they are part of internal structure.
The larger turning points define the more important structural range.
This creates an important distinction.
Minor Swing
A short-term pivot occurring inside a larger price move.
Major or Structural Swing
A significant turning point that produces enough displacement to break another meaningful market structure level.

How to Identify a Significant Swing High or Swing Low
Instead of marking every three-candle formation, ask:
Did price move away from this level strongly enough to break meaningful structure?
If the answer is yes, that swing deserves more attention.
For example:
              Swing High
                  ▲
                 / \
                /   \
               /     \
              /       \
             /         \
            /           \
                       Break
                         ↓
                 Previous Swing Low
The swing high that initiated the bearish displacement becomes significantly more important because sellers from that region successfully broke a previous low.
Similarly:
        Previous Swing High
                 ↑
                 │ BREAK
                 │
               /
              /
             /
            /
           ▲
       Swing Low
The swing low that produced enough bullish displacement to break the previous swing high becomes structurally significant.
What Is a Protected Swing Low?
In bullish SMC market structure, an important higher low may become a protected low.
Consider:
                     HH
                     ▲
                    /
                   /
                  /
             HL ▲
               /
              /
         Previous High
If price rallies from a higher low and subsequently breaks an important previous swing high, the higher low that caused that bullish break becomes extremely important.
That low is often called the protected low.

Why?
Because buyers are expected to defend it if bullish structure remains valid.
A decisive break below the protected low could indicate a change in market character.
What Is a Protected Swing High?
The bearish equivalent is a protected high.
Suppose price forms a lower high and then aggressively breaks a previous swing low.
       Protected High
             ▼
            LH
             \
              \
               \
                LL
The lower high responsible for the bearish continuation becomes an important structural high.
As long as price remains below that protected high, bearish structure may remain intact.
Strong Highs, Weak Highs, Strong Lows and Weak Lows
Smart Money Concepts traders also classify swing points according to whether they are likely to hold or eventually be taken.
What Is a Weak High?
During a strong bullish trend, the latest higher high may be considered a weak high.
Why?
Because bullish structure suggests price may eventually continue upward and take that high.
Liquidity often rests above it.
          Weak High
             ▲
     Buy-Side Liquidity
             ▲
             │
          Previous HH
The high becomes a possible future liquidity target.

What Is a Strong Low?
In the same bullish structure, the higher low responsible for creating the higher high may be considered the strong low.
That is because bullish structure depends upon that low remaining protected.
        Weak High
            ▲
           /
          /
         /
        /
Strong Low
    ▲
Therefore, a common bullish structure interpretation is:
Strong Low → Weak High
Strong High and Weak Low in a Bearish Market
In bearish structure, the relationship is reversed.
The lower high that produces a lower low may act as the strong high, while the low becomes potentially vulnerable.
Strong High
     ▼
      \
       \
        \
         \
        Weak Low
           ▼
Therefore:
Bearish structure = Strong High → Weak Low
This idea becomes useful when traders begin analysing liquidity targets.

Swing Highs and Swing Lows as Liquidity
Swing points are important because orders frequently accumulate around them.
Above a swing high, there may be:
- Buy stop orders
- Stop losses from short traders
- Breakout buy orders
- Algorithmic liquidity
This area is often called buy-side liquidity (BSL).
Below a swing low there may be:
- Sell stop orders
- Stop losses from long traders
- Breakdown sell orders
- Algorithmic liquidity

This is commonly called sell-side liquidity (SSL).
Buy-Side Liquidity Above Swing Highs
Imagine price approaching a previous swing high:
          Buy Stops
        ▲ ▲ ▲ ▲ ▲ ▲
        Swing High
             ▲
            / \
           /   \
Retail breakout traders may place buy orders above the swing high.
At the same time, traders who sold earlier may have their stop losses above the same high.
This creates liquidity.
Price may therefore move above the swing before determining its next direction.
Sell-Side Liquidity Below Swing Lows
The same principle works below swing lows:
             \ /
              ▼
          Swing Low
        ▼ ▼ ▼ ▼ ▼ ▼
          Sell Stops
Liquidity can accumulate beneath the swing.
Price may temporarily move through the level, trigger the orders and then reverse.
This is one reason traders should understand the difference between a liquidity sweep and a genuine structural breakout.

Swing Break vs Liquidity Sweep
Suppose the previous swing low is at:
1.2500
Price briefly trades to:
1.2495
but then quickly returns above 1.2500.
Has bearish structure definitely broken?
Not necessarily.
This could be a sell-side liquidity sweep.
Compare that with price producing a large bearish candle that closes at:
1.2460
and continues lower.
That provides much stronger evidence of a genuine bearish structural break.
Should You Use Wicks or Candle Closes to Identify Swing Breaks?
This is another important distinction.
Identifying the Swing Itself
Use the wick.
If the highest wick reaches 1.2705, then the swing high is approximately 1.2705.
If the lowest wick reaches 1.2502, the swing low is approximately 1.2502.

Confirming BOS or CHoCH
Many market structure traders prefer to see a candle body close through the structural level.
A wick through a high or low can simply represent a liquidity sweep.
A strong candle close with displacement provides stronger structural confirmation.
Therefore:
Swing location → Wick
Structural break confirmation → Preferably candle close + displacement
What Is Break of Structure (BOS)?
A Break of Structure, or BOS, generally represents continuation of the existing trend.
For bullish structure:
             Previous SH
                 ▲
                 │
                 │ BOS
                 ▲
               Price
Price forms a higher low and then breaks above the previous swing high.
This confirms bullish continuation.
In bearish structure:
             Price
               ▼
               │ BOS
           Previous SL
Price forms a lower high and then breaks beneath the previous swing low.
This confirms bearish continuation.

What Is CHoCH?
CHoCH stands for Change of Character.
It can provide early evidence that the existing trend is weakening.
Suppose the market has:
HH → HL → HH → HL → HH
This is bullish.
Then price suddenly breaks beneath the important higher low.
             HH
            /  \
           /    \
          /      HL
         /         \
        HH          \
                     ↓
                  CHoCH
The failure of the protected higher low indicates that bullish structure may be changing.
The reverse applies to bearish structure.
CHoCH vs BOS Using Swing Points
A simple way of remembering the distinction is:
BOS
Breaks structure in the direction of the existing trend.
CHoCH
Breaks an important swing against the existing trend.
Example:
Bullish market:
Breaking a swing high = BOS
Breaking a protected swing low = potential CHoCH
Bearish market:
Breaking a swing low = BOS
Breaking a protected swing high = potential CHoCH
Context remains important because terminology can vary slightly between SMC traders.

Market Structure Shift (MSS)
A Market Structure Shift (MSS) usually involves more than simply crossing a swing point.
Traders often look for:
- Liquidity sweep
- Rejection
- Strong displacement
- Break of an important opposing swing
- Possible imbalance or Fair Value Gap
Example:
       Buy-Side Liquidity
             ▲
             │
          Swing High
             ▲
             │ sweep
             │
             ▼
       Strong bearish move
             │
             │
             ▼
      Previous Swing Low

             MSS
The combination of liquidity and displacement can provide stronger evidence of a genuine change in order flow.
Internal vs External Swing Highs and Lows
Understanding internal and external structure prevents traders from overreacting to every small market movement.

External Swing Structure
External swings define the larger trading range.
For example:
External High
      ▲
      │
      │       Internal swings
      │      /\  /\  /\  /\
      │     /  \/  \/  \/
      │
      ▼
External Low
The external high and external low form the major boundaries of the range.
Internal Swing Structure
Internal swing highs and lows form inside the larger range.
These shorter-term movements can be useful for lower-timeframe entries but do not necessarily change the higher-timeframe trend.
This explains why traders sometimes see:
M5 bearish
while:
M30 bullish
and:
H4 bullish
There is no contradiction.
The trader is simply observing different layers of market structure.
Multi-Timeframe Swing Analysis
Swing highs and lows become much more useful when analysed across multiple timeframes.
A practical framework could be:
| Timeframe | Purpose |
|---|---|
| Daily | Macro directional structure |
| H4 | Major swing structure and POIs |
| H1 | Intermediate order flow |
| M30 | Setup structure |
| M15 | Entry confirmation |
| M5 | Precise execution |
| M1 | Very aggressive execution |
Not every trader needs all these timeframes.
The important idea is to avoid using a tiny lower-timeframe swing to invalidate a much larger higher-timeframe structure.

Example of Multi-Timeframe Structure
Imagine:
H4
HH → HL → HH
Bullish.
H1
Price begins retracing:
LH → LL
Short-term bearish.
M15
Price reaches an H4 demand zone and gives:
LL → CHoCH → HH → HL
Now the lower timeframe is beginning to align again with the H4 bullish direction.
This may provide a much more useful trading narrative than simply saying:
“M15 is bullish.”
The full context becomes:
The H4 market remains bullish, H1 experienced a bearish retracement, and M15 has now shifted bullish from higher-timeframe demand.
That is structured market analysis.

How to Mark Swing Highs and Swing Lows Step by Step
Here is a practical process.
Step 1: Select Your Timeframe
Never start marking random swings without deciding what structure you are analysing.
For example:
If analysing H1 market structure, use H1 candles.
Do not constantly switch between M5 and H1 while deciding which swing is important.
Step 2: Zoom Out
Zoom out enough to see the broader market movement.
Ask:
- Is price generally rising?
- Falling?
- Consolidating?
- Where was the last major impulsive move?
The larger structure should be identified before minor pivots.
Step 3: Find Obvious Turning Points
Identify areas where price clearly changed direction.
A swing high should have price rising into it and falling away.
A swing low should have price falling into it and rising away.

Step 4: Apply the Candle Rule
For a basic swing high:
The pivot should have lower highs on both sides.
For a basic swing low:
The pivot should have higher lows on both sides.
The three-candle method is sufficient for many situations.
Some traders use a five-candle fractal, requiring two candles on each side of the pivot.
The additional confirmation reduces the number of minor swings identified.
Three-Candle vs Five-Candle Swing Method
Three-Candle Method
      Swing High
          ▲
          │
     █    █    █
Only one candle on either side is required.
Advantage:
Faster identification
Disadvantage:
More market noise
Five-Candle Method
          Swing High
              ▲
              │
     █   █    █    █   █
Two candles must exist on both sides.

Advantage:
Cleaner swing identification
Disadvantage:
Later confirmation
Neither method is automatically superior.
Context is more important than blindly counting candles.
Step 5: Look for Displacement
After finding a possible swing, examine how price moved away.
Strong structural swings frequently produce:
- Large-bodied candles
- Consecutive directional candles
- Increased momentum
- Fair Value Gaps
- Imbalances
- Breaks of previous highs or lows

The stronger the displacement, the more attention the originating swing deserves.
Step 6: Determine What Structure the Swing Broke
Ask:
What did this swing actually accomplish?
If a low caused price to break an important high, it may be a structurally important swing low.
If a high caused price to break an important low, it may be a structurally important swing high.
This is one of the best ways to filter out insignificant price noise.
Step 7: Classify the Swing
Once the important swings are established, label them:
- SH — Swing High
- SL — Swing Low
- HH — Higher High
- HL — Higher Low
- LH — Lower High
- LL — Lower Low
Then determine the dominant structure.

Step 8: Identify the Protected Swing
In bullish structure, find the low responsible for the latest important bullish structural break.
In bearish structure, find the high responsible for the latest important bearish break.
These levels become critical when determining whether the market remains structurally bullish or bearish.
Step 9: Mark Liquidity Around the Swings
Look above important highs for:
Buy-side liquidity
Look below important lows for:
Sell-side liquidity
Also watch:
- Equal highs
- Equal lows
- Previous day high
- Previous day low
- Previous week high
- Previous week low
- Session highs
- Session lows
These areas may interact with the swing structure.
📚 Master Forex Trading with TraderFactor
Build your trading edge with expert guides covering Smart Money Concepts (SMC), liquidity, market structure, price action and professional risk management.
📈 CHoCH & BOS Trading GuideLearn how Smart Money traders identify trend reversals using Change of Character and Break of Structure. | 💧 Identify LiquidityUnderstand where institutional traders hunt liquidity before major market moves. |
🎯 Liquidity Sweep StrategyMaster one of the most powerful Smart Money Concepts used before major reversals. | ⚖ Buy Side vs Sell Side LiquidityUnderstand where institutions target stop-losses and how liquidity drives price. |
🏦 Smart Money Concepts (SMC)Complete beginner’s guide to institutional trading and market structure. | 🚨 Avoid Liquidity GrabsLearn to recognize fake breakouts before they trap retail traders. |
📊 Forex Breakout StrategyDiscover how to trade high-probability breakout opportunities with confidence. | ⚡ Market Imbalance GuideUnderstand Fair Value Gaps and institutional imbalances like a professional trader. |
🛡 Protect Your Trading CapitalDiscover why Negative Balance Protection is essential for every forex trader and how it helps safeguard your account during periods of extreme market volatility. | |
How Equal Highs and Equal Lows Relate to Swing Structure
Sometimes the market does not create a clean HH or LH.
Instead, two swing highs may form at approximately the same level.
These are called Equal Highs (EQH).
         EQH        EQH
          ▲          ▲
          │          │
        /   \      /   \
Liquidity can accumulate above the equal highs.
Similarly:
        \   /      \   /
          ▼          ▼
         EQL        EQL
Equal lows can attract sell-side liquidity.
Price may target these pools before the next significant structural move.

Swing High and Swing Low Trading Strategy
Swing analysis should not normally be used as a standalone entry signal.
Instead, traders can combine swing structure with other confluences.
A potential setup might include:
- Higher-timeframe direction
- Important swing liquidity
- Premium or discount location
- Liquidity sweep
- Order block
- Fair Value Gap
- CHoCH or MSS
- Lower-timeframe confirmation
- Defined invalidation
- Logical liquidity target

Example Bullish Swing Setup
Suppose H4 remains bullish.
Price retraces toward an H4 bullish order block.
During the pullback, M15 creates lower highs and lower lows.
Price then:
- Sweeps a previous M15 swing low
- Enters H4 demand
- Rejects the area
- Produces strong bullish displacement
- Breaks the latest M15 lower high
- Leaves an FVG

This could indicate that lower-timeframe bearish structure is shifting back toward the higher-timeframe bullish direction.
A trader could then monitor a retracement into the FVG or order block rather than buying simply because price touched support.
Example Bearish Swing Setup
Suppose H4 structure is bearish.
Price rallies into a premium area containing an H4 bearish order block.
M15 initially remains bullish during the retracement.
Price then:
- Sweeps an M15 swing high
- Takes buy-side liquidity
- Rejects the higher-timeframe POI
- Displaces strongly lower
- Breaks an M15 higher low
- Creates a bearish CHoCH/MSS
- Retraces toward an imbalance

This provides considerably more information than simply selling because price reached resistance.
Swing Highs and Fibonacci Retracement
Swing highs and swing lows are also necessary when using the Fibonacci retracement tool.
For a bullish move, traders commonly draw Fibonacci:
Swing Low → Swing High
For a bearish move:
Swing High → Swing Low
Incorrect swing selection produces incorrect Fibonacci levels.
Popular retracement areas include:
- 50%
- 61.8%
- 70.5%
- 78.6%

ICT traders may also refer to certain deeper retracement areas as Optimal Trade Entry (OTE) zones.
However, Fibonacci should normally be used as confluence rather than as an automatic entry signal.
Swing Highs and Premium/Discount
A dealing range can be created between an important swing high and swing low.
Example:
Swing High
    ▲
    │
 Premium
    │
 50% Equilibrium
    │
 Discount
    │
    ▼
Swing Low
Above the midpoint is generally considered premium.
Below the midpoint is generally considered discount.
In a bullish narrative, traders may prefer buying from discount areas.
In a bearish narrative, traders may prefer selling from premium areas.
The validity of the range depends heavily on selecting meaningful swing points.

Swing Highs and Order Blocks
Order blocks are often connected to swing structure.
A bullish order block may appear near a swing low before strong bullish displacement.
A bearish order block may appear near a swing high before strong bearish displacement.
However, not every candle before a move should automatically be labelled an order block.
Ask:
Did the move originating here produce meaningful displacement and structural change?
If yes, the area becomes much more relevant.
Swing Highs and Fair Value Gaps
Strong moves away from swing highs or lows can create Fair Value Gaps (FVGs).
For example:
Swing Low
    ▼
     █
      ███
          ███
             ███
           ↑
          FVG
If the bullish displacement breaks structure and leaves an imbalance, traders may later monitor the FVG during a retracement.
This combines:
Swing structure + displacement + imbalance
rather than relying on a single concept.

Swing Highs and Support and Resistance
Traditional support and resistance and SMC swing analysis have significant overlap.
A previous swing high may become resistance.
A broken swing high may later act as support.
A previous swing low may act as support.
A broken swing low may later act as resistance.
The difference is that SMC analysis often adds:
- Liquidity
- BOS
- CHoCH
- Order flow
- Displacement
- Institutional POIs
to the traditional horizontal-level framework.
Confirmed vs Unconfirmed Swing Highs and Lows
This is an important concept.
Suppose price is currently making a new low.
Can you immediately call it a swing low?
No.
A swing requires price to begin moving away from the pivot.

Consider:
Price
  \
   \
    \
     \
      ▼ Current Low
There is no evidence yet that the low is finished.
Price could simply continue falling.
Once price begins rallying and sufficient candles form to the right, the pivot can become a confirmed swing low.
The same applies to swing highs.
Why Traders Mark Swing Points Too Early
A common mistake is trying to predict a swing instead of identifying one.
For example:
“Gold has fallen a lot, so this must be the swing low.”
That is not market structure analysis.
Price being oversold, extended or near support does not automatically create a swing low.
The market must actually demonstrate a reaction.

Common Swing High and Swing Low Mistakes
1. Marking Every Tiny Pivot
Too many labels make the chart almost impossible to analyse.
Focus on the swings relevant to your trading timeframe.
2. Ignoring the Higher Timeframe
An M5 bearish swing structure may only represent a retracement inside an H4 bullish trend.
Always establish context.
3. Treating Every Wick as BOS
A wick through a swing may represent liquidity collection.
Look for a meaningful close and displacement.
4. Using Candle Bodies for Swing Extremes
The wick represents the actual traded extreme.
Use the highest or lowest wick to mark the swing itself.
5. Confirming a Swing Before Price Turns
The current high or low remains unconfirmed until price begins moving away.
6. Ignoring Displacement
The strength of the reaction from a swing provides useful information about its significance.
7. Confusing Internal and External Structure
A small internal CHoCH does not automatically reverse the broader trend.
8. Trading Every Swing
A swing point is structural information.
It is not automatically a buy or sell signal.
9. Ignoring Liquidity
Important swing highs and lows frequently attract stop orders.
Price may sweep these areas before reversing.
10. Moving Swing Levels to Fit a Bias
Mark structure objectively.
Do not change which high or low matters simply because you want a particular trade direction.

A Simple Swing Identification Checklist
Before classifying an important swing, ask:
1. Is it an obvious turning point?
2. Are there candles on both sides of the pivot?
3. Did price move away with meaningful momentum?
4. Did the move break an important previous swing?
5. Is this internal or external structure?
6. What timeframe does the swing belong to?
7. Is it a HH, HL, LH or LL?
8. Is the swing protected or vulnerable?
9. Is liquidity resting above or below it?
10. Has the level actually been broken by a meaningful close?
If these questions can be answered clearly, your market structure analysis becomes considerably more objective.

A Professional Top-Down Swing Analysis Workflow
One practical workflow is:
Step 1 — Daily
Identify the larger directional structure.
Mark major:
- Swing highs
- Swing lows
- Previous day/week extremes
- Liquidity
Step 2 — H4
Determine the active dealing range.
Mark:
- Strong high
- Strong low
- Weak high
- Weak low
- Order blocks
- FVGs
- Major liquidity
Step 3 — H1
Analyse intermediate order flow.
Determine whether price is:
- Expanding
- Retracing
- Consolidating
- Shifting structure
Step 4 — M30 or M15
Look for setup development.
Watch:
- Liquidity sweeps
- CHoCH
- MSS
- BOS
- Displacement
- Entry POIs
Step 5 — M5 or Lower
If your strategy requires precise execution, refine the entry.
Do not allow tiny lower-timeframe movements to override your higher-timeframe narrative without sufficient structural evidence.

Swing Structure Example
Assume XAU/USD produces:
4600 → 4650 → 4620 → 4680
The structure is:
Swing Low:
4600
Swing High:
4650
Higher Low:
4620
Higher High:
4680
This remains bullish.
Price then falls to:
4610
If 4620 was the protected higher low and price decisively breaks beneath it, the bullish structure has been damaged.
Suppose price then rallies only to:
4645
and falls to:
4580
Now the sequence may become:
HH 4680 → LL 4610 → LH 4645 → LL 4580
Short-term structure has transitioned bearish.
This is why correctly identifying the original protected swing is so important.

Can Swing Highs and Lows Predict Reversals?
Not by themselves.
Swing structure helps traders identify what the market has done and determine what would need to happen for the structure to change.
It does not guarantee the next price movement.
A previous swing high can be:
- Rejected
- Broken
- Swept
- Consolidated around

The same applies to a swing low.
Traders should therefore combine swing analysis with risk management and additional confluence.
Are Swing Highs and Swing Lows Useful for Stop-Loss Placement?
Yes.
Structural swings can provide logical invalidation points.
For example, in a bullish setup following a confirmed higher low, the trade thesis may become invalid if price decisively breaks beneath the protected low.
Similarly, in bearish structure, a stop may logically sit beyond the swing high that would invalidate the bearish thesis.
However, placing stops directly on obvious highs or lows can expose traders to liquidity sweeps.
Spread, volatility, market conditions and the trading strategy should all be considered.
Can Swing Highs and Lows Be Used for Take-Profit Targets?
Yes.
Previous swing highs and lows frequently provide natural liquidity targets.
A bullish trader may watch:
- Previous swing high
- Equal highs
- Previous day high
- External range high

A bearish trader may watch:
- Previous swing low
- Equal lows
- Previous day low
- External range low
This helps traders align profit targets with areas where liquidity may be concentrated.
Swing Highs and Swing Lows for Day Trading
Day traders often use H1 or M30 structure to establish directional context.
Then M15, M5 or M1 may be used for execution.
For example:
H1 bullish
Price retraces into H1 discount.
M5 becomes bearish during the pullback.
After sell-side liquidity is taken, M5 forms bullish CHoCH and displacement.
The lower-timeframe shift can help identify potential continuation in line with the larger H1 structure.

Swing Highs and Swing Lows for Swing Trading
Swing traders may focus on:
- Weekly
- Daily
- H4
Minor M5 and M15 structure may have little importance for their strategy.
A swing trader might identify a Daily higher low and hold a position targeting a previous weekly swing high.
The appropriate swing therefore depends upon the trader’s holding period and strategy.
What Timeframe Is Best for Swing Highs and Swing Lows?
There is no universally best timeframe.
The correct timeframe depends on the trading style.
Scalpers
M1–M15
Day Traders
M15–H1
Intraday Swing Traders
M30–H4
Swing Traders
H4–Daily
Position Traders
Daily–Weekly
What matters most is consistency.
A trader analysing H4 structure should not allow every tiny M1 swing to change the H4 bias.

Swing Highs and Swing Lows vs Indicators
Indicators such as:
- Moving averages
- RSI
- MACD
- Stochastic
- ATR
can complement market structure.
However, swing highs and lows are derived directly from price action.
They show where participants previously shifted control of the market.
For this reason, many price-action traders first analyse structure and then use indicators only as additional confirmation.
Do Swing Highs and Swing Lows Work in All Forex Pairs?
The basic concept applies to any liquid market where price forms auctions between buyers and sellers.
This includes:
- EUR/USD
- GBP/USD
- USD/JPY
- AUD/USD
- USD/CAD
- USD/CHF
- NZD/USD
- Gold
- Major stock indices
- Cryptocurrency markets

However, volatility differs significantly between instruments.
Gold, for example, can produce much deeper liquidity sweeps than some major currency pairs.
Risk management must therefore be adapted to the instrument being traded.
Frequently Asked Questions About Swing Highs and Swing Lows
What is a swing high in forex?
A swing high is a local price peak where an upward move ends and price begins moving lower. The highest wick of the pivot normally defines the swing-high price.
What is a swing low in forex?
A swing low is a local price bottom where a downward move ends and price begins moving higher.
How do I identify swing highs and lows?
A simple method uses three candles. A swing high has a higher high than the candles immediately before and after it. A swing low has a lower low than the candles immediately before and after it.
Should I use candle bodies or wicks?
Use wicks to identify the exact swing high or low. For structural breaks, many traders prefer a candle close beyond the swing rather than a wick alone.
What is a higher high?
A higher high occurs when price creates a new swing high above the previous significant swing high.
What is a higher low?
A higher low occurs when a new swing low remains above the previous significant swing low.
What is a lower high?
A lower high occurs when a new swing high forms below the previous important swing high.
What is a lower low?
A lower low occurs when price forms a new swing low beneath the previous significant swing low.
What is the difference between BOS and CHoCH?
BOS generally confirms continuation in the existing structural direction. CHoCH indicates that an important opposing swing has been broken and the existing trend may be weakening.
What is a protected low?
A protected low is an important swing low that produced a bullish structural break. Bullish structure generally remains stronger while that low remains intact.
What is a protected high?
A protected high is an important swing high that produced a bearish structural break.
Is every three-candle pivot important?
No. Many three-candle pivots represent internal market noise. Structural swings that generate strong displacement or break meaningful highs and lows are generally more significant.
Can swing highs and lows be used as entries?
They can help identify trade locations, but a swing alone is not necessarily an entry signal. Traders may look for liquidity, displacement, BOS, CHoCH, order blocks, FVGs or other confirmation.
Are swing highs resistance?
They can act as resistance, but they may also represent liquidity that price eventually breaks.
Are swing lows support?
Swing lows can act as support, but they may also contain sell-side liquidity that price targets before reversing or continuing lower.
Can a swing high or low change after it forms?
A confirmed historical swing remains a pivot, although its structural importance can change as new price action develops.

Key Takeaways
Understanding swing highs and swing lows in forex provides the foundation for reading market structure.
A swing high forms where price creates a local peak and turns lower.
A swing low forms where price creates a local bottom and turns higher.
Bullish market structure generally produces:
Higher Highs + Higher Lows
Bearish market structure generally produces:
Lower Highs + Lower Lows
However, traders should avoid marking every tiny pivot as a major swing.
The most important structural swings tend to produce meaningful displacement, break previous structure or establish protected highs and lows.
Swing points also help traders identify:
- Market direction
- BOS
- CHoCH
- MSS
- Buy-side liquidity
- Sell-side liquidity
- Order blocks
- Fair Value Gaps
- Premium and discount
- Fibonacci ranges
- Stop-loss locations
- Profit targets
The central question should always be:
Which swing actually caused meaningful structure to break?
Once traders learn to distinguish major structural swings from minor internal fluctuations, market structure becomes significantly easier to read.
Instead of reacting to every candle, traders can begin viewing price as a sequence of swing highs, swing lows, liquidity targets and structural transitions.
That is the foundation behind many modern price-action, SMC and ICT trading strategies.

Final Trading Checklist
- Higher-timeframe structure is identified.
- Major swing high and swing low are marked.
- HH, HL, LH and LL are correctly classified.
- Internal structure is separated from external structure.
- The protected high or protected low is known.
- Nearby buy-side and sell-side liquidity is identified.
- Any BOS or CHoCH is supported by meaningful displacement.
- A wick sweep has not been mistaken for a confirmed structural break.
- Entry occurs at a logical POI rather than randomly in the middle of a range.
- Stop-loss placement has a clear structural invalidation reason.
- Profit targets correspond with realistic liquidity or swing objectives.
- Risk remains controlled even if the analysis is wrong.
📚 Master Forex Trading with TraderFactor
Build your trading edge with expert guides covering Smart Money Concepts (SMC), liquidity, market structure, price action and professional risk management.
📈 CHoCH & BOS Trading GuideLearn how Smart Money traders identify trend reversals using Change of Character and Break of Structure. | 💧 Identify LiquidityUnderstand where institutional traders hunt liquidity before major market moves. |
🎯 Liquidity Sweep StrategyMaster one of the most powerful Smart Money Concepts used before major reversals. | ⚖ Buy Side vs Sell Side LiquidityUnderstand where institutions target stop-losses and how liquidity drives price. |
🏦 Smart Money Concepts (SMC)Complete beginner’s guide to institutional trading and market structure. | 🚨 Avoid Liquidity GrabsLearn to recognize fake breakouts before they trap retail traders. |
📊 Forex Breakout StrategyDiscover how to trade high-probability breakout opportunities with confidence. | ⚡ Market Imbalance GuideUnderstand Fair Value Gaps and institutional imbalances like a professional trader. |
🛡 Protect Your Trading CapitalDiscover why Negative Balance Protection is essential for every forex trader and how it helps safeguard your account during periods of extreme market volatility. | |
Risk Warning: Forex, CFDs and other leveraged products involve significant risk. Market structure analysis does not guarantee profitable trades. Traders should use appropriate risk management and never risk capital they cannot afford to lose.
About the Author
Zahari Rangelov
Head of Business Development, TraderFactor
Zahari specializes in broker analysis, regulatory research, and trading education. He has over a decade of experience helping traders navigate the complex world of online brokers. His expertise spans technical and fundamental analysis, medium-term trading strategies, risk management, and trading psychology. A respected mentor and speaker, Zahari regularly leads webinars and seminars covering market sentiment, speculative instruments, and automated trading systems. His research-backed, practical approach has established him as a trusted authority within the global trading community.

Reviewed By:
Reviewed by Alex Kanyi, Head of Compliance at TraderFactor
“This report is for general information only. Trading involves significant risk. Seek independent advice before acting on any content.”