
The Doji Candlestick is one of the most valuable patterns you’ll encounter in Forex trading, revealing moments of indecision and potential shifts in market trends. If you’re a Forex trader seeking to strengthen your technical analysis skills, understanding the Doji Candlestick can be a game-changer. It helps you spot signs of market reversal or continuation with precision, guiding your decisions in trades. By the end of this guide, you’ll know how to trade the Doji Candlestick effectively and avoid common trading mistakes associated with it.
Understanding the Basics of a Doji Candlestick
What is a Doji Candlestick?
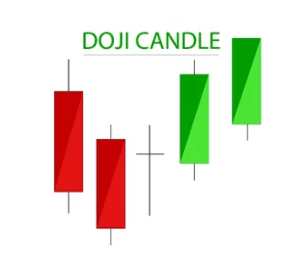
A Doji Candlestick forms when the opening and closing prices of a trading period are nearly identical. This results in a thin candle body, often resembling a cross or plus sign on charts. The Doji is crucial because it represents indecision in the Forex market, where neither buyers nor sellers have control. By identifying it correctly, you’re better prepared to take advantage of potential trend breaks or changes.
For example, when you see this candlestick after a prolonged uptrend, it may indicate price exhaustion and possible reversal. On the other hand, its appearance during consolidation phases might signal an upcoming breakout. You can maximize its utility by combining it with indicators like RSI or volume analysis in Forex.
How Does the Doji Candlestick Relate to Market Indecision?
The Doji embodies market indecision because it reveals that buyers and sellers are evenly matched. This standoff often arises after a strong price move, leading to a pause as traders reassess the situation. Market sentiment analysis during such instances helps you confirm whether the trend will reverse or persist. Pay attention to the shadows or wicks, as their length often provides clues about volatility.
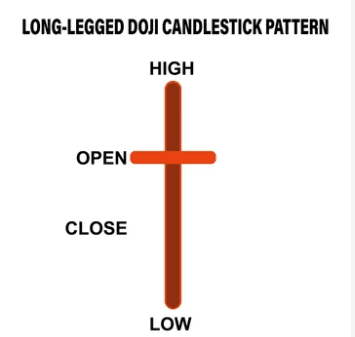
For instance, a Long-legged Doji with extended wicks may indicate significant volatility. By including such patterns in your strategy, you can align your entry and exit points with more confidence.
Types of Doji Candlesticks in Forex
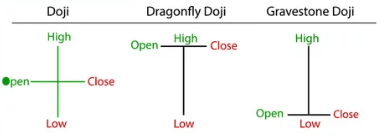
Dragonfly Doji
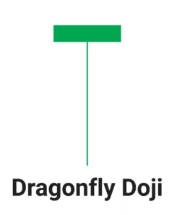
The Dragonfly Doji stands out because its opening and closing prices are near the session high, leaving a long lower shadow. This pattern signals strong buying pressure, which might lead to a trend reversal when paired with support levels.
Imagine spotting a Dragonfly Doji after a steep downtrend near key support. The long lower shadow shows sellers initially dominated, but buyers gained control later. This setup suggests the possibility of a bullish trend, helping you leverage Forex trading with Dragonfly Doji for better results.
Gravestone Doji
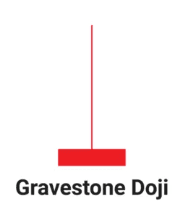
Opposite to the Dragonfly, the Gravestone Doji occurs when the opening and closing prices align near the session low. The upper shadow reveals that buyers failed to sustain higher prices, often signaling bearish sentiment in Forex markets.
Use this pattern to identify potential downtrends, particularly when it appears close to a resistance level. Combining the Gravestone Doji Candlestick in Forex with indicators like Fibonacci retracement sharpens your trading strategy.
Why Doji Candlesticks Are Crucial for Forex Traders
Doji Candlestick Patterns and Trend Reversals
When analyzing Forex candlestick charts, look for Doji candlestick patterns to spot trend reversals. For example, the appearance of a Bullish Doji after a series of bearish candles often hints at a reversal toward higher prices. Similarly, Bearish Doji patterns may confirm upcoming sell-offs in overbought markets.
By understanding Doji candlestick confirmation techniques, you ensure that you act on the most reliable signals. Context is everything—pair Doji patterns with support and resistance levels for maximum payoff.
Identifying Doji in Consolidation Phases
Consolidation phases are the market’s way of taking a breath, and the Doji Candlestick often emerges during these periods. Its presence can indicate that an impending breakout is on the horizon. A Long-legged Doji, for instance, suggests building tension that could resolve into a new trend. By anticipating such movements, you set yourself up for profitable opportunities.
Using Indicators to Analyze Doji Candlestick Patterns
Best Indicators for Doji Analysis
Technical indicators amplify the meaning behind a Doji Candlestick. Tools like RSI and MACD help confirm whether the indecision represented by the Doji aligns with overbought or oversold conditions, giving you a roadmap for execution.
Suppose you spot a Doji during a downtrend alongside RSI signaling an oversold market. This setup indicates a potential trend reversal. Incorporating best indicators for Doji Candlestick analysis ensures you approach trades systematically.
Using Volume Analysis with Doji
Volume often validates the significance of a Doji Candlestick. High trading volume during its appearance highlights significant market participation, making it a stronger signal. Conversely, weak volume may warrant additional confirmation before taking action. By combining volume analysis in Forex with Doji patterns, you refine your decision-making process.
Common Trading Mistakes with Doji Candlesticks
Misinterpreting Doji Candlestick Signals
A common pitfall is overinterpreting every Doji as a sign of reversal. Remember, context matters. If you fail to analyze market environment—such as surrounding candlestick formations or technical indicators—you risk invalidating your trade setup.
For instance, a Doji candlestick at support signifies strength only if combined with confirmation from other Forex trading indicators. By avoiding such mistakes, you trade more confidently.
Impulsive Trading Without Confirmation
Another error is making trades without confirming a Doji’s signal. Always wait for subsequent candlesticks or conditions that validate the Doji’s implication. This step ensures you only act on strong, well-supported setups when tackling Forex market indecision.
Practical Doji Candlestick Trading Strategies
Using Doji at Support and Resistance Levels
Support and resistance levels enhance the power of Doji Candlesticks. For example, spotting a Dragonfly Doji at support often signals a buying opportunity. Conversely, a Gravestone Doji at resistance may suggest a short-selling option. Traders often use Doji candlestick with RSI indicator to confirm such moves.
How to Trade Doji Candlestick in Forex
A reliable approach is the wait-and-see method. Allow the next candlestick to confirm the trend direction before entering. This strategy minimizes risk while enabling strategic entries. To strengthen your trades, layer on tools like Fibonacci and volume analysis.
Enhancing Your Strategy with Doji Candlestick Patterns
Pairing Doji with Trend Continuation Patterns
While often viewed as reversal patterns, Doji Candlesticks also work in trend continuation setups. A Long-legged Doji during an uptrend may indicate temporary indecision before prices resume rising. This insight allows you to adjust your trade targets.

Long-Legged Doji Trading Strategy for Volatile Markets
The Long-legged Doji shines in volatile Forex markets. Its long shadows represent big price swings, suggesting a strong impending move. Waiting for confirmation from subsequent candlesticks ensures you capitalize on these chances effectively.
Final Thoughts
Mastering the Doji Candlestick is an essential step in honing your Forex trading skills. It acts as a valuable tool for detecting market indecision, potential reversals, and trend continuation opportunities. By leveraging Doji with robust technical analysis tools and avoiding common mistakes, you set yourself up for consistent success. Whether you’re a beginner exploring your first Forex candlestick chart or a professional refining your strategy, the Doji can be a powerful ally in navigating market complexities.
Frequently Asked Questions

Is Doji bullish or bearish?
A Doji candlestick can be either bullish or bearish depending on its context within the trend. For example, a Bullish Doji candlestick at a support level may suggest a potential price increase, while a bearish one at resistance signals a potential drop. Always consider additional indicators or patterns for confirmation.
What happens after a Doji?
After a Doji candlestick, the price often consolidates before a trend reversal or continuation. Its outcome depends on market conditions and complementary analysis tools like RSI or moving averages. The Doji candlestick pattern meaning often hints at indecision that traders must interpret within the trading context.

What are the 4 types of Doji?
The four types of Doji candlestick patterns are Dragonfly Doji candlestick, Gravestone Doji candlestick, Long-legged Doji candlestick, and Four-Price Doji. Each type provides unique insights into market indecision, with characteristics like varying shadow lengths. Use these patterns in conjunction with other signals for accurate forecasting.
What is the 3 Doji pattern?
The 3 Doji pattern involves three consecutive Doji candlesticks, which signify prolonged indecision in the market. This pattern often precedes a strong price movement or trend breakout. Analyzing the Long-legged Doji candlestick meaning, in this pattern, can provide clues to the market’s potential direction.
Does a bearish Doji signal a drop?
Yes, a bearish Doji candlestick can signal a potential drop, especially at resistance levels. For instance, a Gravestone Doji candlestick at resistance often highlights selling pressure. Confirmation from additional indicators is essential before trading on this signal.

What is the purpose of the Doji candle?
The purpose of a Doji candlestick is to highlight moments of market indecision. It can signal potential trend reversals or continuation depending on its position within the trend. Traders use this insight to refine entry or exit points in their strategies.
Which Doji candle is best?
The best Doji candlestick depends on the market scenario. A Dragonfly Doji candlestick in uptrend signals bullish sentiment, while a Gravestone Doji candlestick in downtrend suggests bearish pressure. Context and supporting indicators determine which Doji is most effective for you.
What does a red Doji mean?
A red Doji indicates a slight bearish sentiment since it closes slightly below its opening price. However, like any Doji candlestick pattern, its meaning heavily depends on its position in the trend. Always confirm with additional tools like volume or support levels.

How to identify bullish Doji?
You can identify a Bullish Doji candlestick when it forms at a support level and is followed by a bullish confirmation candle. Its long lower shadow, like in a Dragonfly Doji candlestick, often signals a potential upward move. Combine this observation with market sentiment analysis for accuracy.
How to trade a Doji?
To trade a Doji candlestick, wait for confirmation from the next candlestick to determine the price direction. For added accuracy, pair the Doji with indicators like Fibonacci levels or RSI to validate its signal. This approach reduces risks in volatile Forex trading environments.
What is a perfect Doji?
A perfect Doji forms when the opening and closing prices are exactly equal, creating a balanced cross shape. This type of Doji candlestick pattern meaning highlights complete indecision in the market. It often appears before significant price changes.

What is the Doji in downtrend?
A Doji candlestick in downtrend often signals that selling pressure might be weakening. Patterns like the Dragonfly Doji candlestick chart suggest a potential bullish reversal, especially near key support zones. Always confirm with additional indicators for reliable predictions.
What is the bullish Doji strategy?
The bullish Doji strategy involves identifying a Bullish Doji candlestick at support, followed by a rise in price. Patterns like the Dragonfly Doji candlestick strategy work best in this scenario. Combine it with volume analysis for better trade entries.
What does a Gravestone Doji indicate?
A Gravestone Doji signals strong selling pressure, especially near resistance levels. The Gravestone Doji meaning lies in its long upper shadow, which shows buyers were overpowered. Use it to anticipate bearish reversals in an uptrend.
How to trade a Gravestone Doji?
To trade a Gravestone Doji candlestick, confirm the bearish signal with the subsequent candlestick or technical indicators. Place a sell order if it appears at resistance, as it often suggests a price decline. Analyze Gravestone Doji candlestick example scenarios for deeper understanding.

Can Gravestone Doji be green?
Yes, a Gravestone Doji can be green, though its meaning remains bearish due to the long upper shadow. The Bullish Gravestone Doji rarely affects outcomes unless combined with bullish confirmations. Context still plays a critical role in its interpretation.
What does a Dragonfly Doji indicate?
A Dragonfly Doji candlestick indicates strong buying interest, often after downward pressure. The Dragonfly Doji candlestick meaning becomes crucial near support levels as it signals a potential bullish reversal. Its long lower shadow shows sellers being outperformed by buyers.
What is the difference between Dragonfly Doji and Gravestone Doji?
The difference lies in their shadow placement and market sentiment. A Dragonfly Doji candlestick in uptrend has a long lower shadow, signaling bullish potential. Conversely, a Gravestone Doji exhibits a long upper shadow, indicating bearish resistance.

Is a red Dragonfly Doji bullish?
Yes, a red Dragonfly Doji candlestick can indicate bullish potential if it forms near support. Despite the bearish close, its long lower shadow suggests buyers are regaining control. Confirmations are key to verifying this bullish sentiment.
What is the difference between Long-legged Doji and Dragonfly Doji?
The Long-legged Doji candlestick features long shadows on both sides, reflecting extreme indecision. Meanwhile, the Dragonfly Doji candlestick focuses on a long lower shadow, indicating bullish sentiment. Long-legged Doji candlestick meaning often suggests volatility, while Dragonfly implies reversal possibilities.
What happens after Dragonfly Doji?
After a Dragonfly Doji candlestick, prices often rise if it forms near support. It signals a shift in market sentiment from bearish to bullish. Confirm the trend with subsequent bullish candlesticks or volume indicators.

Are Dragonfly Doji candlesticks accurate?
Yes, Dragonfly Doji candlesticks are generally accurate in signaling bullish reversals at support. When paired with strong technical analysis, they enhance trading precision. Dragonfly Doji candlestick strategy works best in trending markets or near critical price zones.
How to use Dragonfly Doji candle?
To use a Dragonfly Doji candlestick, identify it near support in a downtrend. Confirm a bullish reversal by analyzing market sentiment and relevant indicators. Patterns from the Dragonfly Doji candlestick chart can validate the setup for optimal trade entries.
Disclaimer:
TraderFactor or partners have prepared all the information. The information does not contain a record of TraderFactor or partner’s prices or an offer of or solicitation for a transaction in any financial instrument. No representation or warranty is given as to the accuracy or completeness of this information. Any material provided does not regard the specific investment objective and financial situation of any person who may read it. Past performance is not a reliable indicator of future performance.