
A bull flag pattern is a bullish continuation signal in technical analysis, marked by an initial steep price rise called the flagpole, followed by a period of consolidation within parallel downward-sloping trendlines. During this consolidation, volume usually decreases. Upon breaking the upper trendline, volume typically increases, confirming the pattern and indicating renewed buying interest. Key characteristics include strong initial momentum, orderly consolidation, and distinct volume changes. Recognizing these signs allows traders to anticipate continued upward movement, enhancing their trading strategies.
Definition
The bull flag pattern epitomizes a bullish continuation signal in technical analysis, suggesting potential price increases following a sharp price surge. This chart pattern is characterized by a preceding vertical price spike, commonly referred to as the “flagpole,” which highlights strong buying pressure. Subsequently, the price enters a brief consolidation phase, forming a rectangular or slightly downward-sloping flag shape.

During this consolidation, the price action stays confined within two parallel trendlines, which slope downward, reflecting a temporary decrease in trading volume. Despite this, the overall market trends remain bullish, indicating that the consolidation phase is merely a pause in a continuing uptrend.

A critical aspect of the bull flag pattern is its trading volume analysis. Typically, volume decreases during the flag formation, but a notable increase occurs upon a breakout above the upper trendline. This breakout signifies a resumption of the upward trend and provides traders with a clear entry point.
Formation Process
Understanding the bull flag pattern’s formation process begins with recognizing the sequence of price movements that construct this bullish continuation signal. Initially, the pattern starts with the “flagpole,” a sharp upward movement reflecting strong buying pressure. This stage is vital as it sets the foundation for the pattern, underscoring the flagpole’s importance in indicating robust bullish sentiment.

Following the flagpole, the market enters the consolidation phase. During this stage, prices drift slightly lower or move sideways, forming a rectangle or downward-sloping channel. This phase is marked by decreasing volume, suggesting a temporary pause in buying activity while sellers cannot markedly drive prices down. The consolidation phase is essential for the pattern’s integrity, as it indicates stability and prepares for a potential breakout.
The final stage is the breakout confirmation. This occurs when the price breaks above the upper trendline of the consolidation phase, signaling a resurgence of buying interest. Volume analysis during the breakout is critical; a considerable increase in volume confirms the breakout’s legitimacy and the continuation of the upward trend. These formation stages collectively guarantee the bull flag pattern’s effectiveness as a bullish continuation signal.

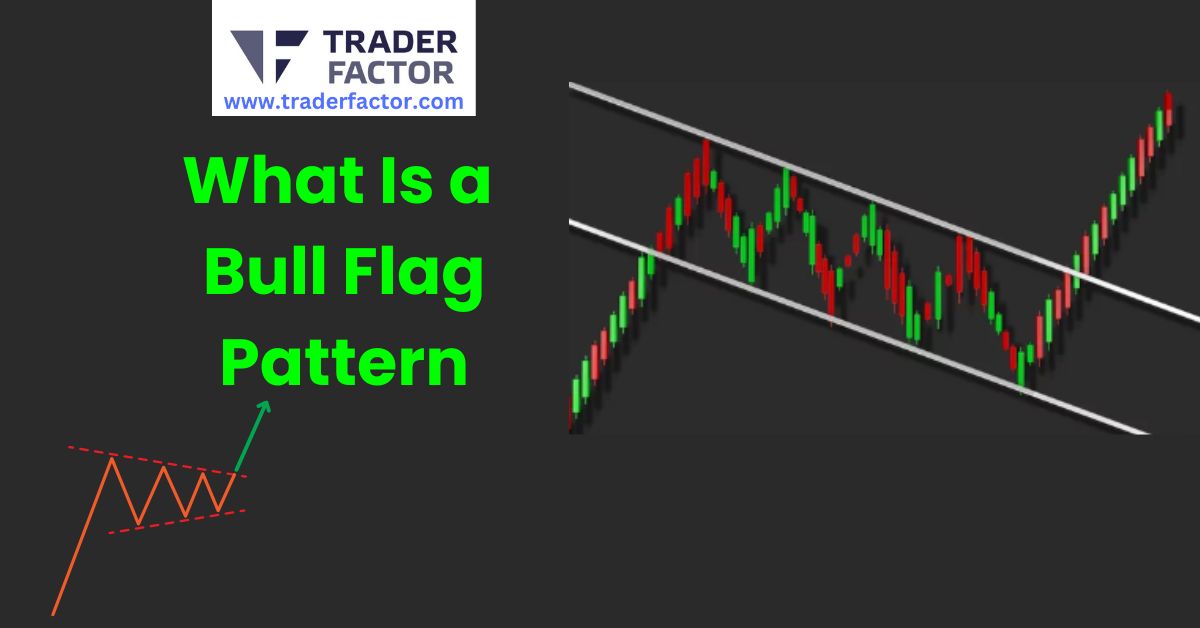
The Bull Flag pattern in the image represents a continuation pattern in technical analysis, often seen in an uptrend. Here’s how to interpret it:
- Flagpole: The initial strong upward movement, depicted with green candlesticks, represents the flagpole. This indicates a sharp rise in price due to strong buying interest.
- Flag: Following the flagpole, there’s a consolidation phase where the price moves sideways or slightly downward, forming a rectangular shape. This is shown with a mix of green and red candlesticks. It represents a pause in the trend as traders take profits or the market consolidates before the next move.
- Breakout: Traders look for a breakout above the flag’s resistance line to confirm the continuation of the uptrend. This breakout is typically accompanied by increased volume, signaling renewed buying interest.

Overall, the Bull Flag pattern suggests that after a brief consolidation, the price is likely to continue its upward trajectory. Traders often use this pattern to identify potential entry points for long positions.
Key Characteristics
Amid the complexities of chart patterns, bull flags stand out with distinct features that traders keenly analyze. A primary characteristic is the initial sharp upward movement, known as the flagpole. This rise reflects strong buying momentum, an important aspect of bull flag psychology. Following this surge, the price enters a consolidation phase, forming a rectangular or downward-sloping channel. During consolidation, the market experiences a pause, allowing traders to digest gains and prepare for the next move.

Volume analysis is significant here; typically, volume decreases during the consolidation phase, indicating a temporary reduction in trading activity. A decline in volume suggests that sellers aren’t dominant, supporting the potential for trend continuation. For breakout confirmation, traders look for a volume increase as the price breaks above the upper trendline of the flag. This breakout signifies renewed buying interest and validates the bull flag pattern.
In essence, the bull flag’s key characteristics—sharp initial rise, orderly consolidation, decreased and then increased volume—underscore its utility in predicting trend continuation. Recognizing and understanding these features enables traders to make informed decisions and capitalize on potential price increases.

Trading Signals
Monitoring bull flag patterns enables traders to identify robust trading signals and capitalize on potential upward movements. Breakout confirmation is important in validating a bull flag pattern. When the price breaches the upper resistance trendline, it signals that the consolidation phase is over, and a new rally might commence. Traders should look for increased trading volume during this breakout, as it often indicates strong market interest and reinforces the pattern’s reliability.

Volume analysis plays a significant role in this process. A surge in volume during the breakout suggests that the move is supported by substantial buying pressure, reducing the likelihood of a false breakout. Pattern recognition skills are essential for traders to distinguish genuine bull flags from other formations.
Effective risk management is essential when trading bull flag patterns. Placing stop-loss orders below the lower trendline of the flag guarantees that potential losses are minimized if the breakout fails. Understanding trading psychology is also crucial; traders must remain disciplined and avoid emotional decisions that could jeopardize their strategy.

Strategy Execution
Traders capitalize on bull flag patterns by executing well-defined strategies that maximize profitability. Bull flag strategies start with identifying precise entry points, typically after a breakout confirmation above the upper trendline of the flag formation. This breakout signals the continuation of the prior bullish momentum and sets the stage for initiating long positions.
Stop loss placement is essential for controlling potential losses. Traders usually place stop loss orders just below the lower trendline of the flag, guaranteeing that risk management protocols are adhered to. This minimizes exposure if the breakout fails and the price reverses.
Risk management extends beyond stop loss placement. Position sizing, based on the trader’s risk tolerance and account size, guarantees that no single trade jeopardizes the overall portfolio. Additionally, traders often look for increased volume during the breakout phase, as this breakout confirmation enhances the reliability of the pattern and the subsequent price move.

Reliability
Reliability of the bull flag pattern hinges on several key factors that traders must scrutinize to guarantee accurate trading decisions. One pivotal aspect is understanding pattern psychology, which involves recognizing the market’s sentiment during the consolidation phase. Traders must evaluate whether the consolidation reflects a healthy pause or potential weakness. Volume analysis plays an integral role; declining volume during the flag’s formation suggests a temporary lull, while a surge in volume upon breakout confirmation signals robust buyer interest.
Timeframes impact the pattern’s reliability considerably. Shorter timeframes might produce more false signals due to market noise, whereas longer timeframes generally offer more dependable formations. A disciplined trader mindset is essential, requiring adherence to predefined rules and avoiding emotional trading. This mindset guarantees objective assessment and execution of trades based on the pattern’s characteristics.

Market Analysis
Analyzing the market through the lens of the bull flag pattern provides traders with vital insights into potential price movements. This technical pattern can reveal significant details about market sentiment and price volatility. When a bull flag forms, it indicates that bullish sentiment remains strong despite a temporary consolidation. This consolidation phase allows traders to gauge the underlying strength of the trend and informs their trading psychology.

Volume analysis is essential when evaluating a bull flag pattern. During the initial surge or the “flagpole,” high trading volume suggests robust buying interest. Conversely, the consolidation phase should see a reduction in volume, indicating a lack of significant selling pressure. A breakout from the consolidation phase, accompanied by increased volume, signals a potential continuation of the uptrend.
Risk management becomes paramount when trading this pattern. Traders should set stop-loss orders just below the lower trendline of the flag to mitigate potential losses. Effective risk management guarantees that traders can capitalize on favorable market conditions while protecting their capital.

- Volume Analysis: Confirms the strength of the trend.
- Market Sentiment: Gauges the prevailing bullish outlook.
- Trading Psychology: Helps in making informed decisions.
Limitations
Despite its popularity among technical analysts, the bull flag pattern isn’t without its limitations. Market volatility often complicates pattern recognition, leading to false breakouts that can mislead traders. These false signals can trigger premature entries or exits, disrupting effective risk management strategies. As a result, a trader’s psychology can suffer, as confidence in pattern reliability wanes.

Moreover, the impact of different timeframes on the bull flag pattern cannot be overstated. Shorter timeframes may exhibit more noise, making it difficult to distinguish genuine patterns from random price movements. This noise increases the probability of errors in pattern recognition, contributing to potential financial losses. In contrast, longer timeframes might provide clearer patterns but require more patience and larger capital investments, which not all traders can afford.
Furthermore, the bull flag pattern assumes a continuation of the existing trend, but market conditions can change rapidly. Unexpected news events or shifts in market sentiment can invalidate the pattern, rendering it ineffective. Thus, traders must incorporate additional technical indicators and remain vigilant, constantly adjusting their strategies to account for these limitations. Only through thorough risk management can traders navigate the inherent uncertainties of relying on bull flag patterns.

Related Patterns
While the bull flag pattern has its limitations, understanding related patterns can enhance a trader’s ability to navigate market complexities. One such pattern is the bear flag, the inverse of the bull flag, indicating bearish trends. Recognizing the bear flag involves identifying a sharp downward move followed by a consolidation phase, suggesting potential continuation of the downtrend. This pattern requires traders to employ volume analysis to confirm the validity of the breakout.
Effective trading psychology is vital when dealing with these patterns. Traders must maintain discipline and avoid emotional decisions that could lead to premature entries or exits. Recognizing patterns accurately can mitigate these risks and improve trading outcomes.
Volume analysis plays a pivotal role in validating the breakout of both bull and bear flags. A significant increase in volume during the breakout confirms strong market sentiment and enhances the reliability of the pattern. To further aid in pattern recognition, traders should consider the following:

- Bear Flag: Identifies potential downtrend continuation.
- Volume Analysis: Confirms breakouts and market strength.
- Trading Psychology: Essential for disciplined and rational trading decisions.
Educational Resources
For traders seeking to master the bull flag pattern, educational resources are indispensable tools to enhance their understanding and application of this technical analysis technique. Detailed resources cover essential aspects such as trading psychology, which helps traders manage emotions and maintain discipline during trades. Understanding market sentiment is vital, as it enables traders to gauge the broader market direction and make informed decisions.

Risk management is another significant area, with educational materials often providing strategies to minimize potential losses. By employing proper risk management techniques, traders can protect their capital and sustain long-term profitability. Technical indicators, such as moving averages and relative strength index (RSI), are frequently discussed in these resources to assist traders in identifying potential bull flag formations and confirming breakouts.
Price action analysis is also a focal point, enabling traders to interpret raw market data without relying solely on indicators. Educational platforms like TraderFactor offer in-depth tutorials where traders can get insights and strategies. Utilizing these resources helps traders develop a robust methodology for trading bull flag patterns, ultimately leading to more confident and successful trading decisions.
Frequently Asked Questions

How Long Does a Bull Flag Pattern Typically Last?
A bull flag duration typically lasts one to three weeks. Traders use technical analysis and chart patterns to identify this timeframe, tailoring trading strategies to market trends and ensuring timely entry and exit points for maximum gains.
Can Bull Flag Patterns Appear in Cryptocurrency Markets?
Yes, bull flag patterns can appear in cryptocurrency markets. Traders leverage bull flag psychology to develop trading strategies, set price targets, and manage risk effectively. Market conditions greatly influence the pattern’s formation and subsequent price movements.
What Causes a Bull Flag Pattern to Fail?
A bull flag pattern fails due to shifting bull flag psychology, flawed market sentiment analysis, erratic trader behavior trends, and technical analysis flaws. Ineffective risk management strategies exacerbate these issues, causing the pattern to collapse unexpectedly.
How Do Volume Levels Affect Bull Flag Patterns?
Volume levels impact bull flag patterns by confirming breakouts. High volume during a breakout signals strong market sentiment and validates the pattern’s psychology. Traders use volume analysis to refine trading strategies and guarantee reliable breakout confirmation.
Are Bull Flag Patterns Effective in Volatile Markets?
Bull flag patterns in volatile markets can be effective. Traders utilize bull flag psychology and trading strategies to gauge market sentiment. They integrate technical indicators and emphasize risk management to navigate rapid price changes and confirm breakouts.
Disclaimer:
All information has been prepared by TraderFactor or partners. The information does not contain a record of TraderFactor or partner’s prices or an offer of or solicitation for a transaction in any financial instrument. No representation or warranty is given as to the accuracy or completeness of this information. Any material provided does not have regard to the specific investment objective and financial situation of any person who may read it. Past performance is not a reliable indicator of future performance.